152 Repositories
Latest Python Libraries
Sorting-Algorithms - All information about sorting algorithm you need and you can visualize the code tracer
Sorting-Algorithms - All information about sorting algorithm you need and you can visualize the code tracer

Automatically Visualize any dataset, any size with a single line of code. Created by Ram Seshadri. Collaborators Welcome. Permission Granted upon Request.
AutoViz Automatically Visualize any dataset, any size with a single line of code. AutoViz performs automatic visualization of any dataset with one lin

Pytools is an open source library containing general machine learning and visualisation utilities for reuse
pytools is an open source library containing general machine learning and visualisation utilities for reuse, including: Basic tools for API developmen

A Python toolbox for gaining geometric insights into high-dimensional data
"To deal with hyper-planes in a 14 dimensional space, visualize a 3D space and say 'fourteen' very loudly. Everyone does it." - Geoff Hinton Overview

Visual analysis and diagnostic tools to facilitate machine learning model selection.
Yellowbrick Visual analysis and diagnostic tools to facilitate machine learning model selection. What is Yellowbrick? Yellowbrick is a suite of visual

A Python package to facilitate research on building and evaluating automated scoring models.
Rater Scoring Modeling Tool Introduction Automated scoring of written and spoken test responses is a growing field in educational natural language pro

Optimizers-visualized - Visualization of different optimizers on local minimas and saddle points.
Optimizers Visualized Visualization of how different optimizers handle mathematical functions for optimization. Contents Installation Usage Functions

Visualization Toolbox for Long Short Term Memory networks (LSTMs)
Visualization Toolbox for Long Short Term Memory networks (LSTMs)

CNN visualization tool in TensorFlow
tf_cnnvis A blog post describing the library: https://medium.com/@falaktheoptimist/want-to-look-inside-your-cnn-we-have-just-the-right-tool-for-you-ad

PyMove is a Python library to simplify queries and visualization of trajectories and other spatial-temporal data
Use PyMove and go much further Information Package Status License Python Version Platforms Build Status PyPi version PyPi Downloads Conda version Cond
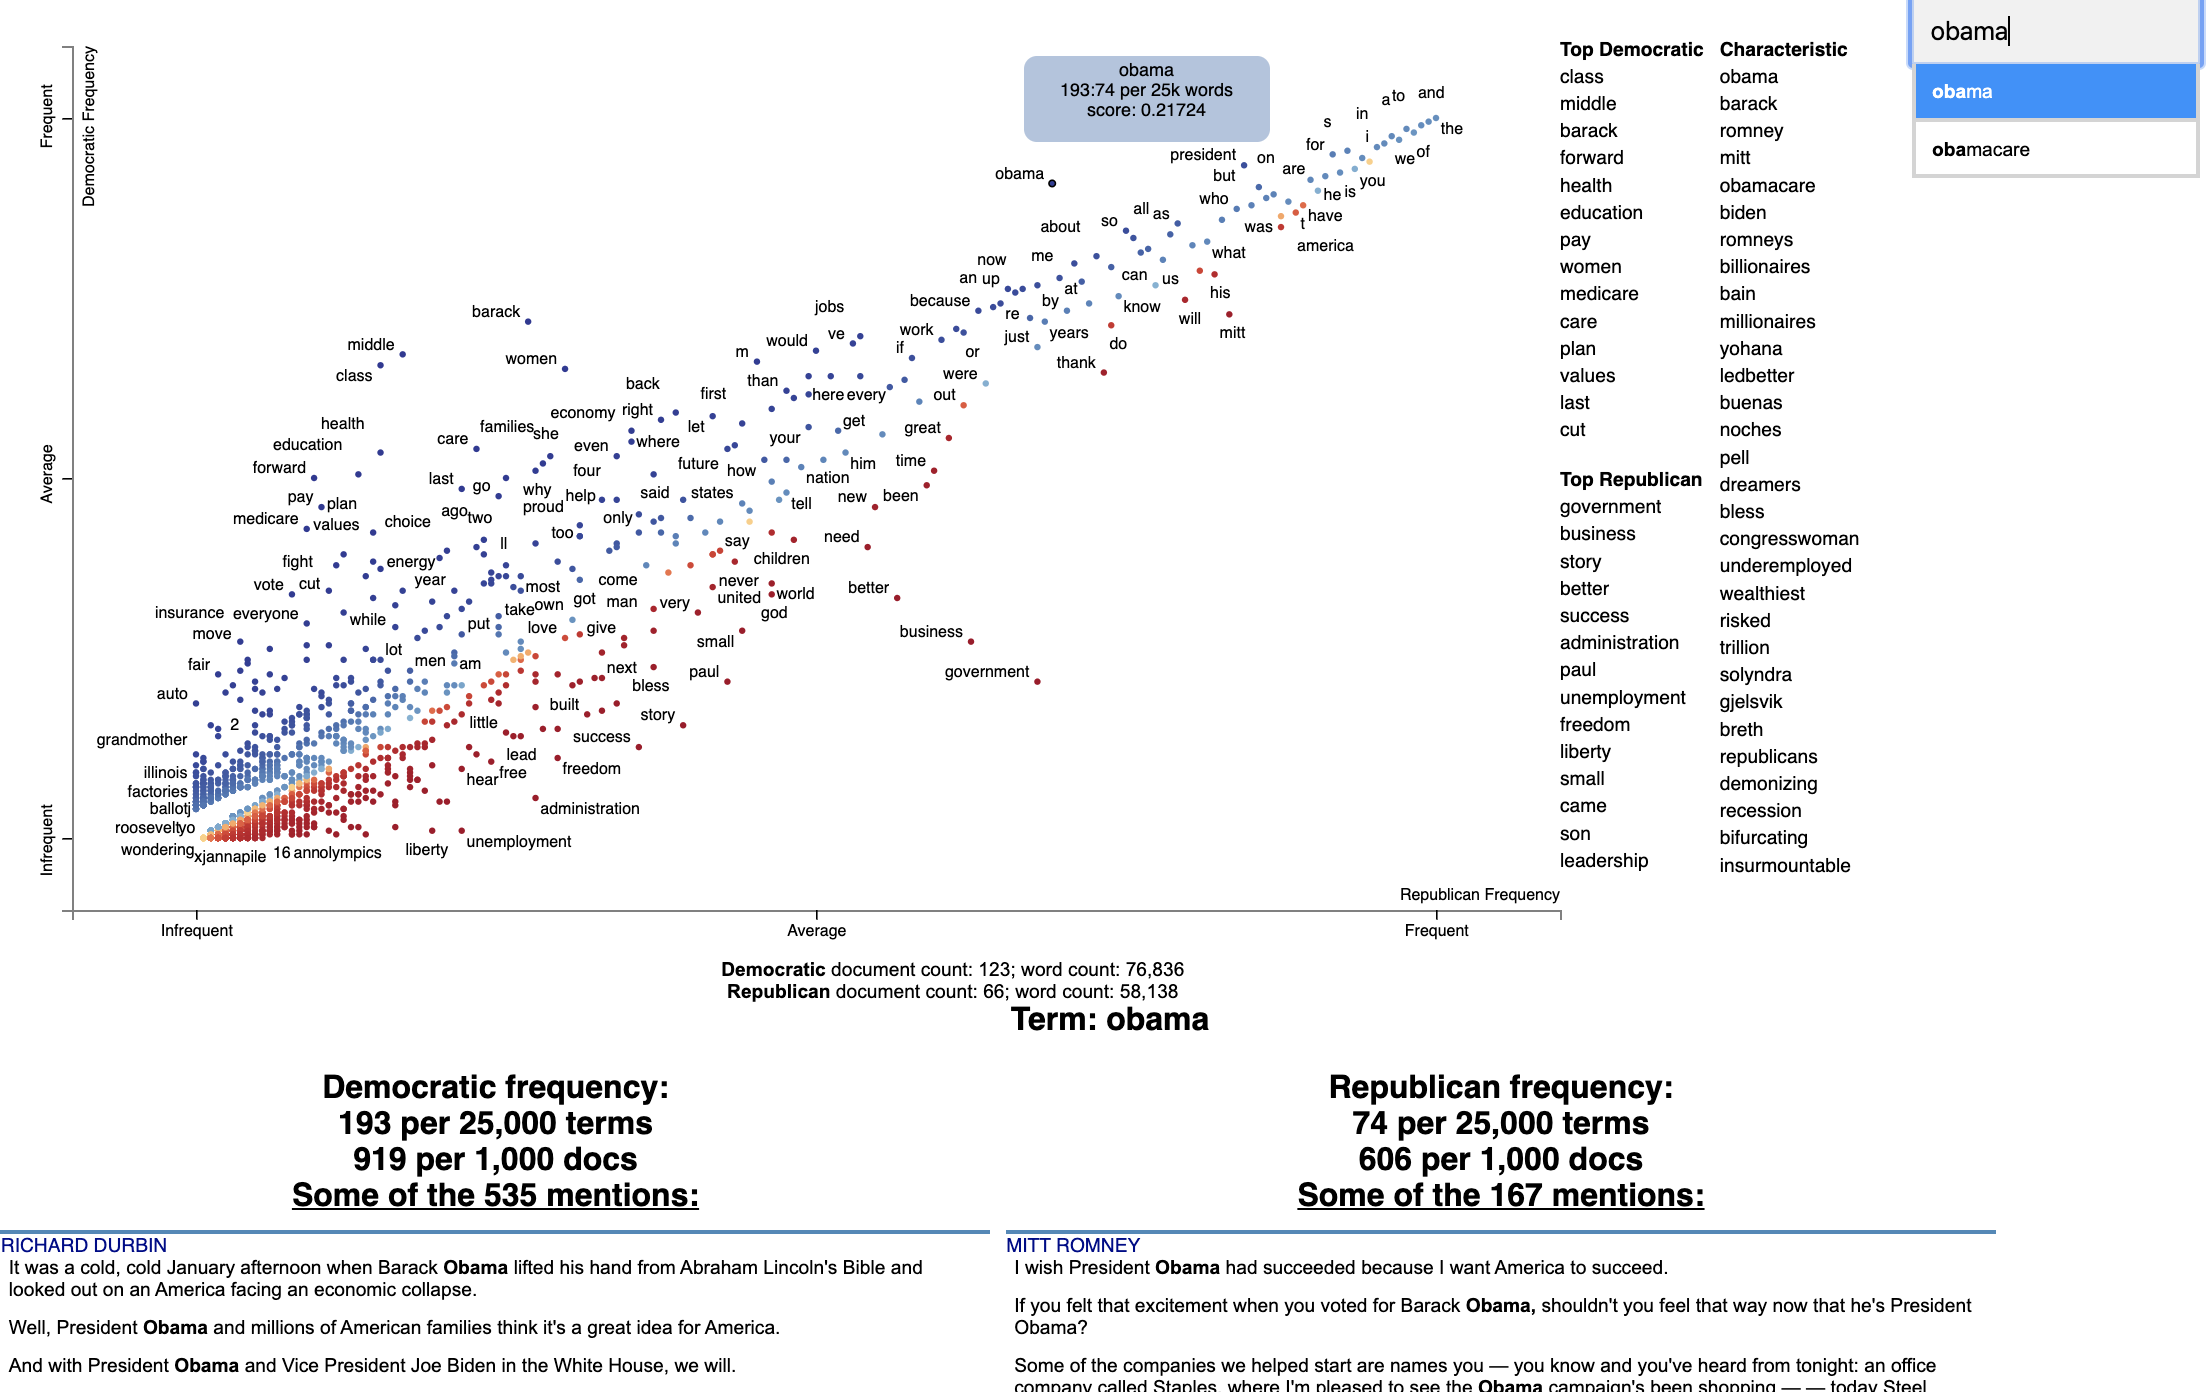
Beautiful visualizations of how language differs among document types.
Scattertext 0.1.0.0 A tool for finding distinguishing terms in corpora and displaying them in an interactive HTML scatter plot. Points corresponding t

决策树分类与回归模型的实现和可视化
DecisionTree 决策树分类与回归模型,以及可视化 DecisionTree ID3 C4.5 CART 分类 回归 决策树绘制 分类树 回归树 调参 剪枝 ID3 ID3决策树是最朴素的决策树分类器: 无剪枝 只支持离散属性 采用信息增益准则 在data.py中,我们记录了一个小的西瓜数据
Graphing communities on Twitch.tv in a visually intuitive way
VisualizingTwitchCommunities This project maps communities of streamers on Twitch.tv based on shared viewership. The data is collected from the Twitch
Fast Fourier Transform-accelerated Interpolation-based t-SNE (FIt-SNE)
FFT-accelerated Interpolation-based t-SNE (FIt-SNE) Introduction t-Stochastic Neighborhood Embedding (t-SNE) is a highly successful method for dimensi

Quickly visualize docker networks with graphviz.
Docker Network Graph Visualize the relationship between Docker networks and containers as a neat graphviz graph. Example Usage usage: docker-net-graph

A multi-platform GUI for bit-based analysis, processing, and visualization
A multi-platform GUI for bit-based analysis, processing, and visualization
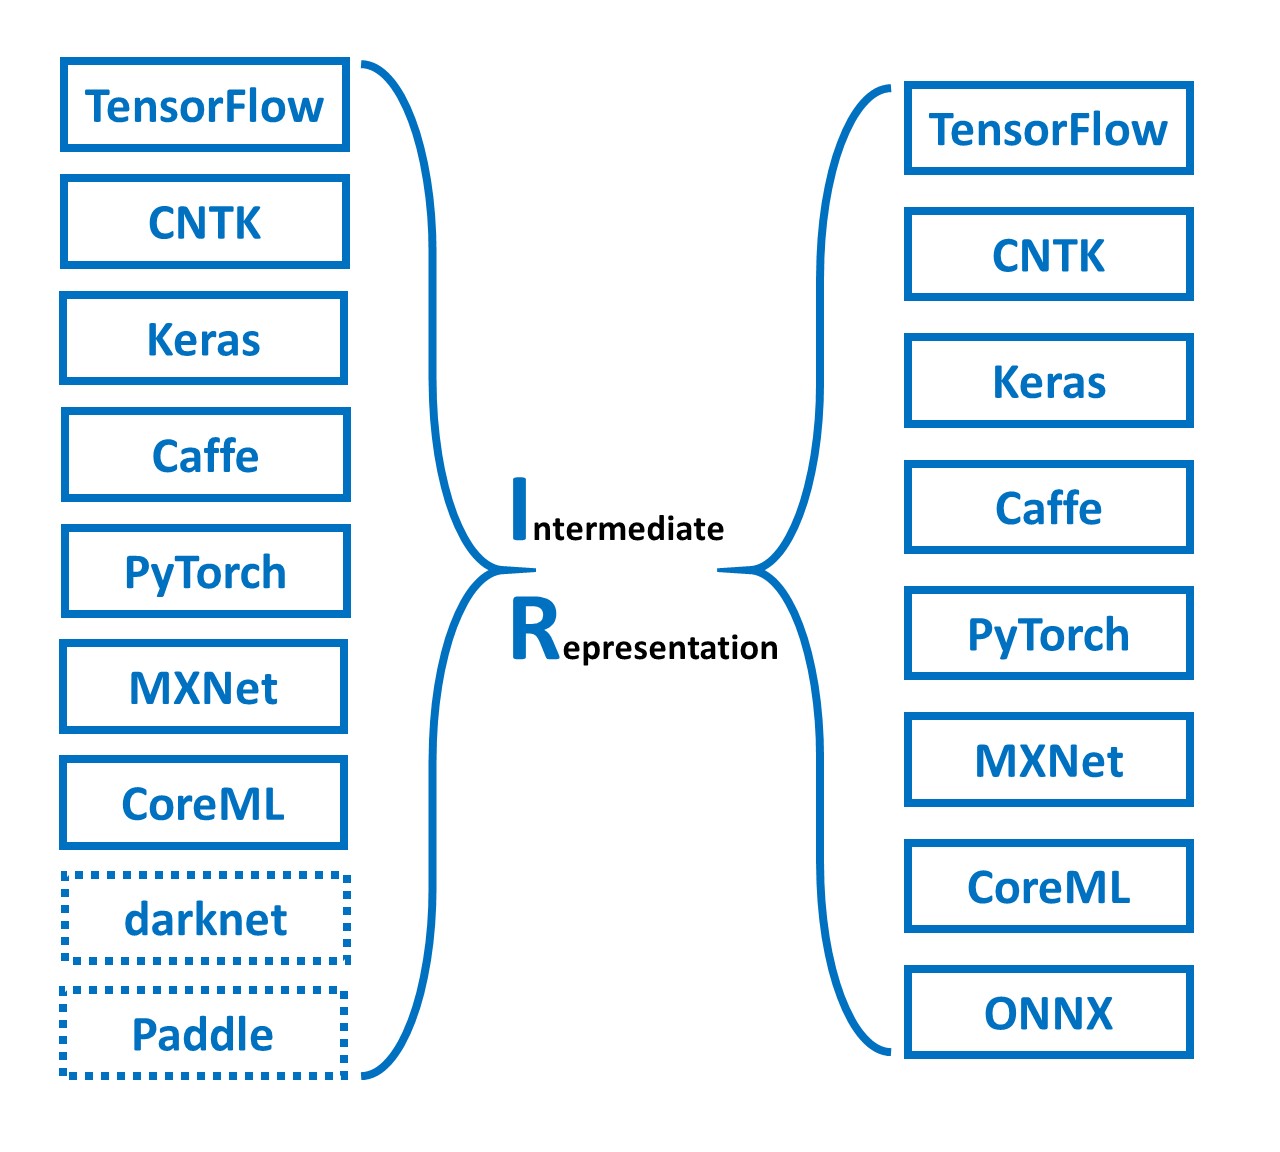
MMdnn is a set of tools to help users inter-operate among different deep learning frameworks. E.g. model conversion and visualization. Convert models between Caffe, Keras, MXNet, Tensorflow, CNTK, PyTorch Onnx and CoreML.
MMdnn MMdnn is a comprehensive and cross-framework tool to convert, visualize and diagnose deep learning (DL) models. The "MM" stands for model manage

Visualization toolkit for neural networks in PyTorch! Demo -->
FlashTorch A Python visualization toolkit, built with PyTorch, for neural networks in PyTorch. Neural networks are often described as "black box". The

Visualization toolkit for neural networks in PyTorch! Demo -->
FlashTorch A Python visualization toolkit, built with PyTorch, for neural networks in PyTorch. Neural networks are often described as "black box". The

A visualization of people a user follows on Twitter
Twitter-Map This software allows the user to create maps of Twitter accounts. Installation git clone
12 Jul 20, 2022
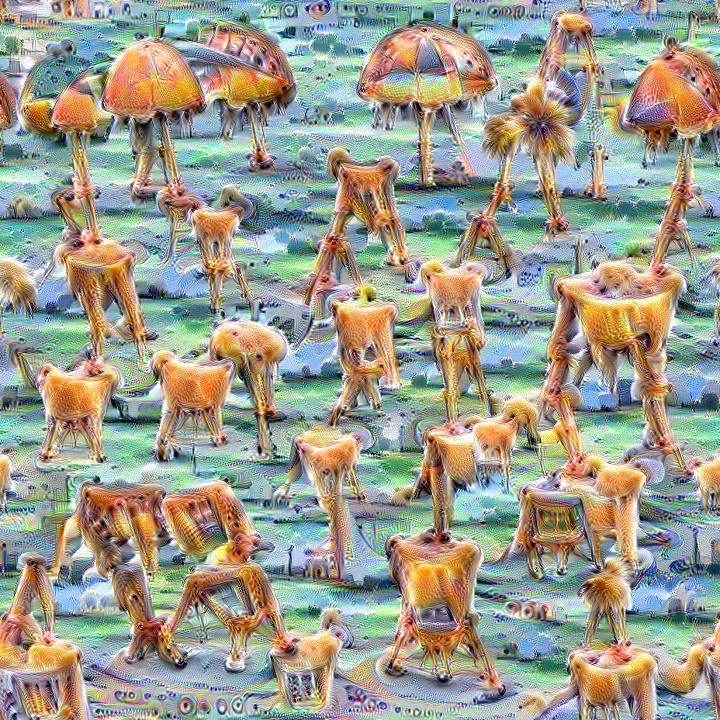
Quickly and easily create / train a custom DeepDream model
Dream-Creator This project aims to simplify the process of creating a custom DeepDream model by using pretrained GoogleNet models and custom image dat

Quickly and easily create / train a custom DeepDream model
Dream-Creator This project aims to simplify the process of creating a custom DeepDream model by using pretrained GoogleNet models and custom image dat

PyTorch implementation of DeepDream algorithm
neural-dream This is a PyTorch implementation of DeepDream. The code is based on neural-style-pt. Here we DeepDream a photograph of the Golden Gate Br

PyTorch implementation of DeepDream algorithm
neural-dream This is a PyTorch implementation of DeepDream. The code is based on neural-style-pt. Here we DeepDream a photograph of the Golden Gate Br

Seaborn-image is a Python image visualization library based on matplotlib and provides a high-level API to draw attractive and informative images quickly and effectively.
seaborn-image: image data visualization Description Seaborn-image is a Python image visualization library based on matplotlib and provides a high-leve
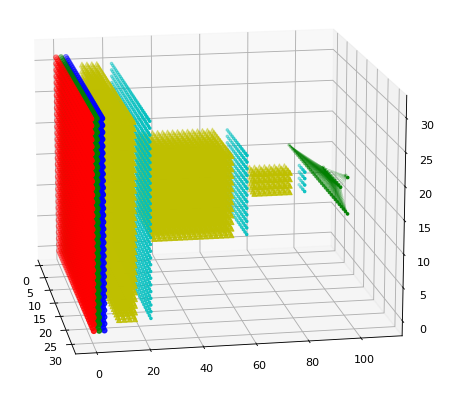
A ultra-lightweight 3D renderer of the Tensorflow/Keras neural network architectures
A ultra-lightweight 3D renderer of the Tensorflow/Keras neural network architectures
Regress.me is an easy to use data visualization tool powered by Dash/Plotly.
Regress.me Regress.me is an easy to use data visualization tool powered by Dash/Plotly. Regress.me.-.Google.Chrome.2022-05-10.15-58-59.mp4 Get Started

This is the pytorch implementation of the paper - Axiomatic Attribution for Deep Networks.
Integrated Gradients This is the pytorch implementation of "Axiomatic Attribution for Deep Networks". The original tensorflow version could be found h
View model summaries in PyTorch!
torchinfo (formerly torch-summary) Torchinfo provides information complementary to what is provided by print(your_model) in PyTorch, similar to Tensor

This is a super simple visualization toolbox (script) for transformer attention visualization ✌
Trans_attention_vis This is a super simple visualization toolbox (script) for transformer attention visualization ✌ 1. How to prepare your attention m

A Power BI/Google Studio Dashboard to analyze previous OTC CatchUps
OTC CatchUp Dashboard A Power BI/Google Studio dashboard analyzing OTC CatchUps. File Contents * ├───data ├───old summaries ─── *.md ├
A python library to artfully visualize Factorio Blueprints and an interactive web demo for using it.
Factorio Blueprint Visualizer I love the game Factorio and I really like the look of factories after growing for many hours or blueprints after tweaki

Visualize classified time series data with interactive Sankey plots in Google Earth Engine
sankee Visualize changes in classified time series data with interactive Sankey plots in Google Earth Engine Contents Description Installation Using P
Title: Graduate-Admissions-Predictor
The purpose of this project is create a predictive model capable of identifying the probability of a person securing an admit based on their personal profile parameters. Simplified visualisations hav

A visualization tool to show a TensorFlow's graph like TensorBoard
tfgraphviz tfgraphviz is a module to visualize a TensorFlow's data flow graph like TensorBoard using Graphviz. tfgraphviz enables to provide a visuali

MPL Plotter is a Matplotlib based Python plotting library built with the goal of delivering publication-quality plots concisely.
MPL Plotter is a Matplotlib based Python plotting library built with the goal of delivering publication-quality plots concisely.

Standardized plots and visualizations in Python
Standardized plots and visualizations in Python pltviz is a Python package for standardized visualization. Routine and novel plotting approaches are f

A multi-functional library for full-stack Deep Learning. Simplifies Model Building, API development, and Model Deployment.
chitra What is chitra? chitra (चित्र) is a multi-functional library for full-stack Deep Learning. It simplifies Model Building, API development, and M

Fast scatter density plots for Matplotlib
About Plotting millions of points can be slow. Real slow... 😴 So why not use density maps? ⚡ The mpl-scatter-density mini-package provides functional

visualize_ML is a python package made to visualize some of the steps involved while dealing with a Machine Learning problem
visualize_ML visualize_ML is a python package made to visualize some of the steps involved while dealing with a Machine Learning problem. It is build

🌐 Local tile server for viewing geospatial raster files with ipyleaflet
🌐 Local Tile Server for Geospatial Rasters Need to visualize a rather large raster (gigabytes) you have locally? This is for you. A Flask application
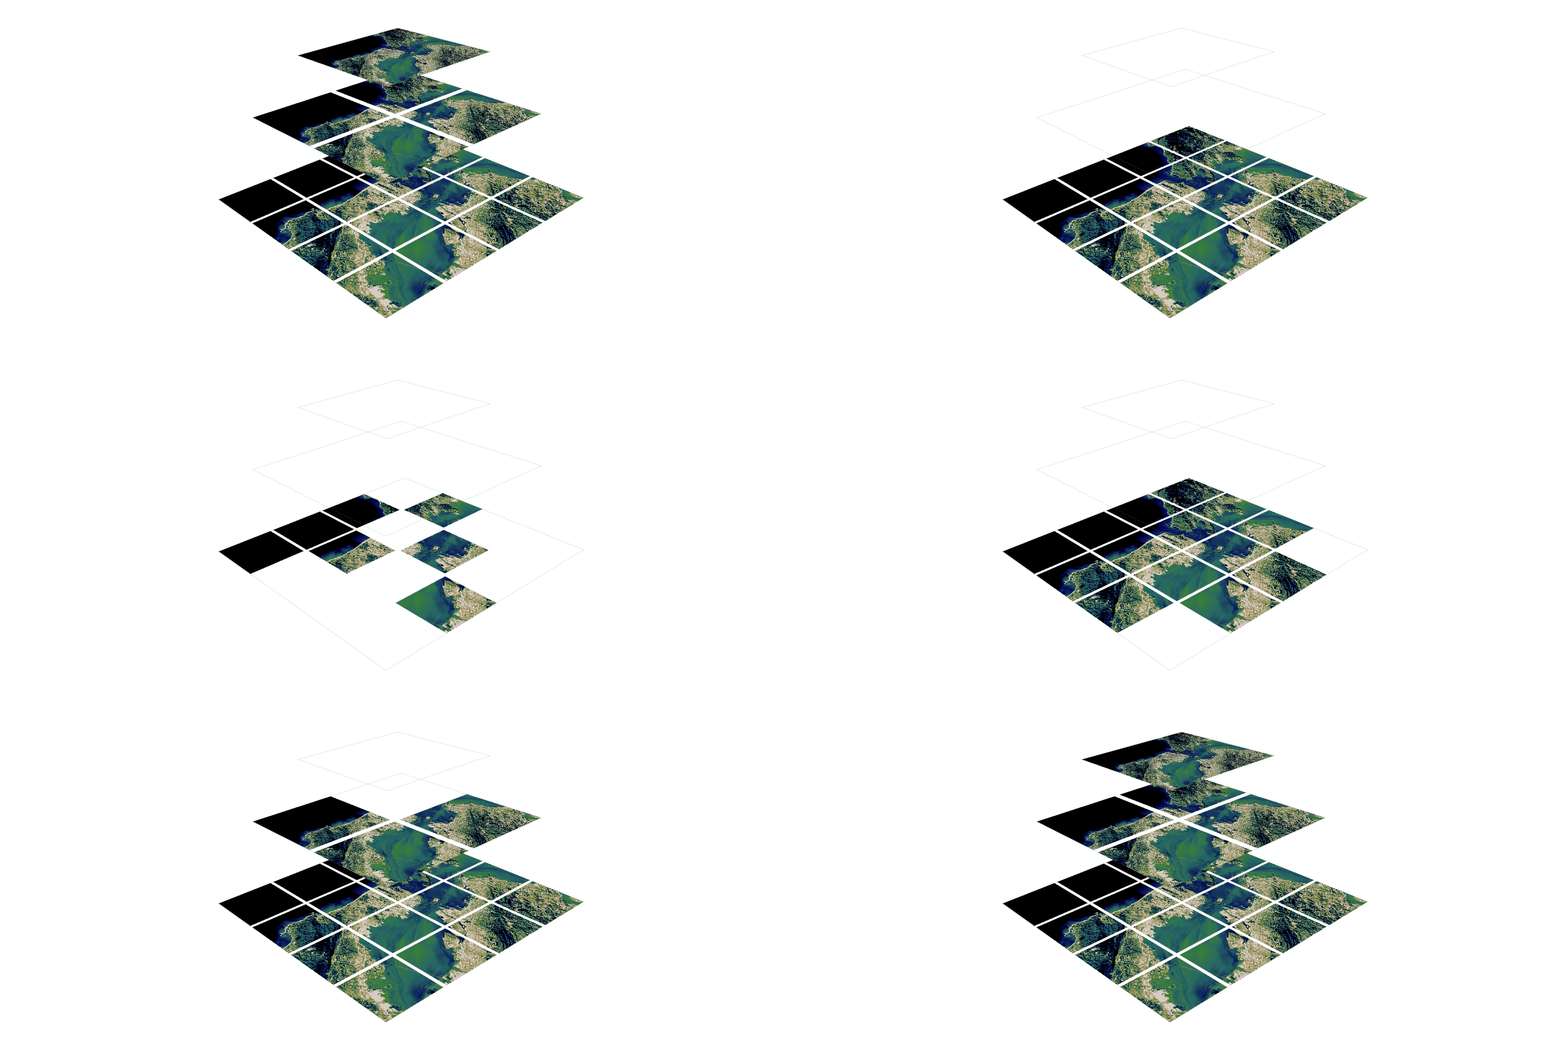
🌐 Local tile server for viewing geospatial raster files with ipyleaflet or folium
🌐 Local Tile Server for Geospatial Rasters Need to visualize a rather large (gigabytes) raster you have locally? This is for you. A Flask application

🍊 :bar_chart: :bulb: Orange: Interactive data analysis
Orange Data Mining Orange is a data mining and visualization toolbox for novice and expert alike. To explore data with Orange, one requires no program
Interactive Data Visualization in the browser, from Python
Bokeh is an interactive visualization library for modern web browsers. It provides elegant, concise construction of versatile graphics, and affords hi

🎆 A visualization of the CapsNet layers to better understand how it works
CapsNet-Visualization For more information on capsule networks check out my Medium articles here and here. Setup Use pip to install the required pytho

Interactive chemical viewer for 2D structures of small molecules
👀 mols2grid mols2grid is an interactive chemical viewer for 2D structures of small molecules, based on RDKit. ➡️ Try the demo notebook on Google Cola

An interactive explorer for single-cell transcriptomics data
an interactive explorer for single-cell transcriptomics data cellxgene (pronounced "cell-by-gene") is an interactive data explorer for single-cell tra

Easily configurable, chart dashboards from any arbitrary API endpoint. JSON config only
Flask JSONDash Easily configurable, chart dashboards from any arbitrary API endpoint. JSON config only. Ready to go. This project is a flask blueprint
Devkit for 3D -- Some utils for 3D object detection based on Numpy and Pytorch
D3D Devkit for 3D: Some utils for 3D object detection and tracking based on Numpy and Pytorch Please consider siting my work if you find this library
Proyecto - Desgaste y rendimiento de empleados de IBM HR Analytics
Acceder al código desde Google Colab para poder ver de manera adecuada todas las visualizaciones y poder interactuar con ellas. Links de acceso: Noteb

A scalable implementation of WobblyStitcher for 3D microscopy images
WobblyStitcher Introduction A scalable implementation of WobblyStitcher Dependencies $ python -m pip install numpy scikit-image Visualization ImageJ
A flexible data historian based on InfluxDB, Grafana, MQTT and more. Free, open, simple.
Kotori Telemetry data acquisition and sensor networks for humans. Documentation: https://getkotori.org/ Source Code: https://github.com/daq-tools/koto

PyTorch implementation of "Transparency by Design: Closing the Gap Between Performance and Interpretability in Visual Reasoning"
Transparency-by-Design networks (TbD-nets) This repository contains code for replicating the experiments and visualizations from the paper Transparenc

Delve is a Python package for analyzing the inference dynamics of your PyTorch model.
Delve is a Python package for analyzing the inference dynamics of your PyTorch model.

A basic molecule viewer written in Python, using curses; Thus, meant for linux terminals
asciiMOL A basic molecule viewer written in Python, using curses; Thus, meant for linux terminals. This is an alpha version, featuring: Opening defaul
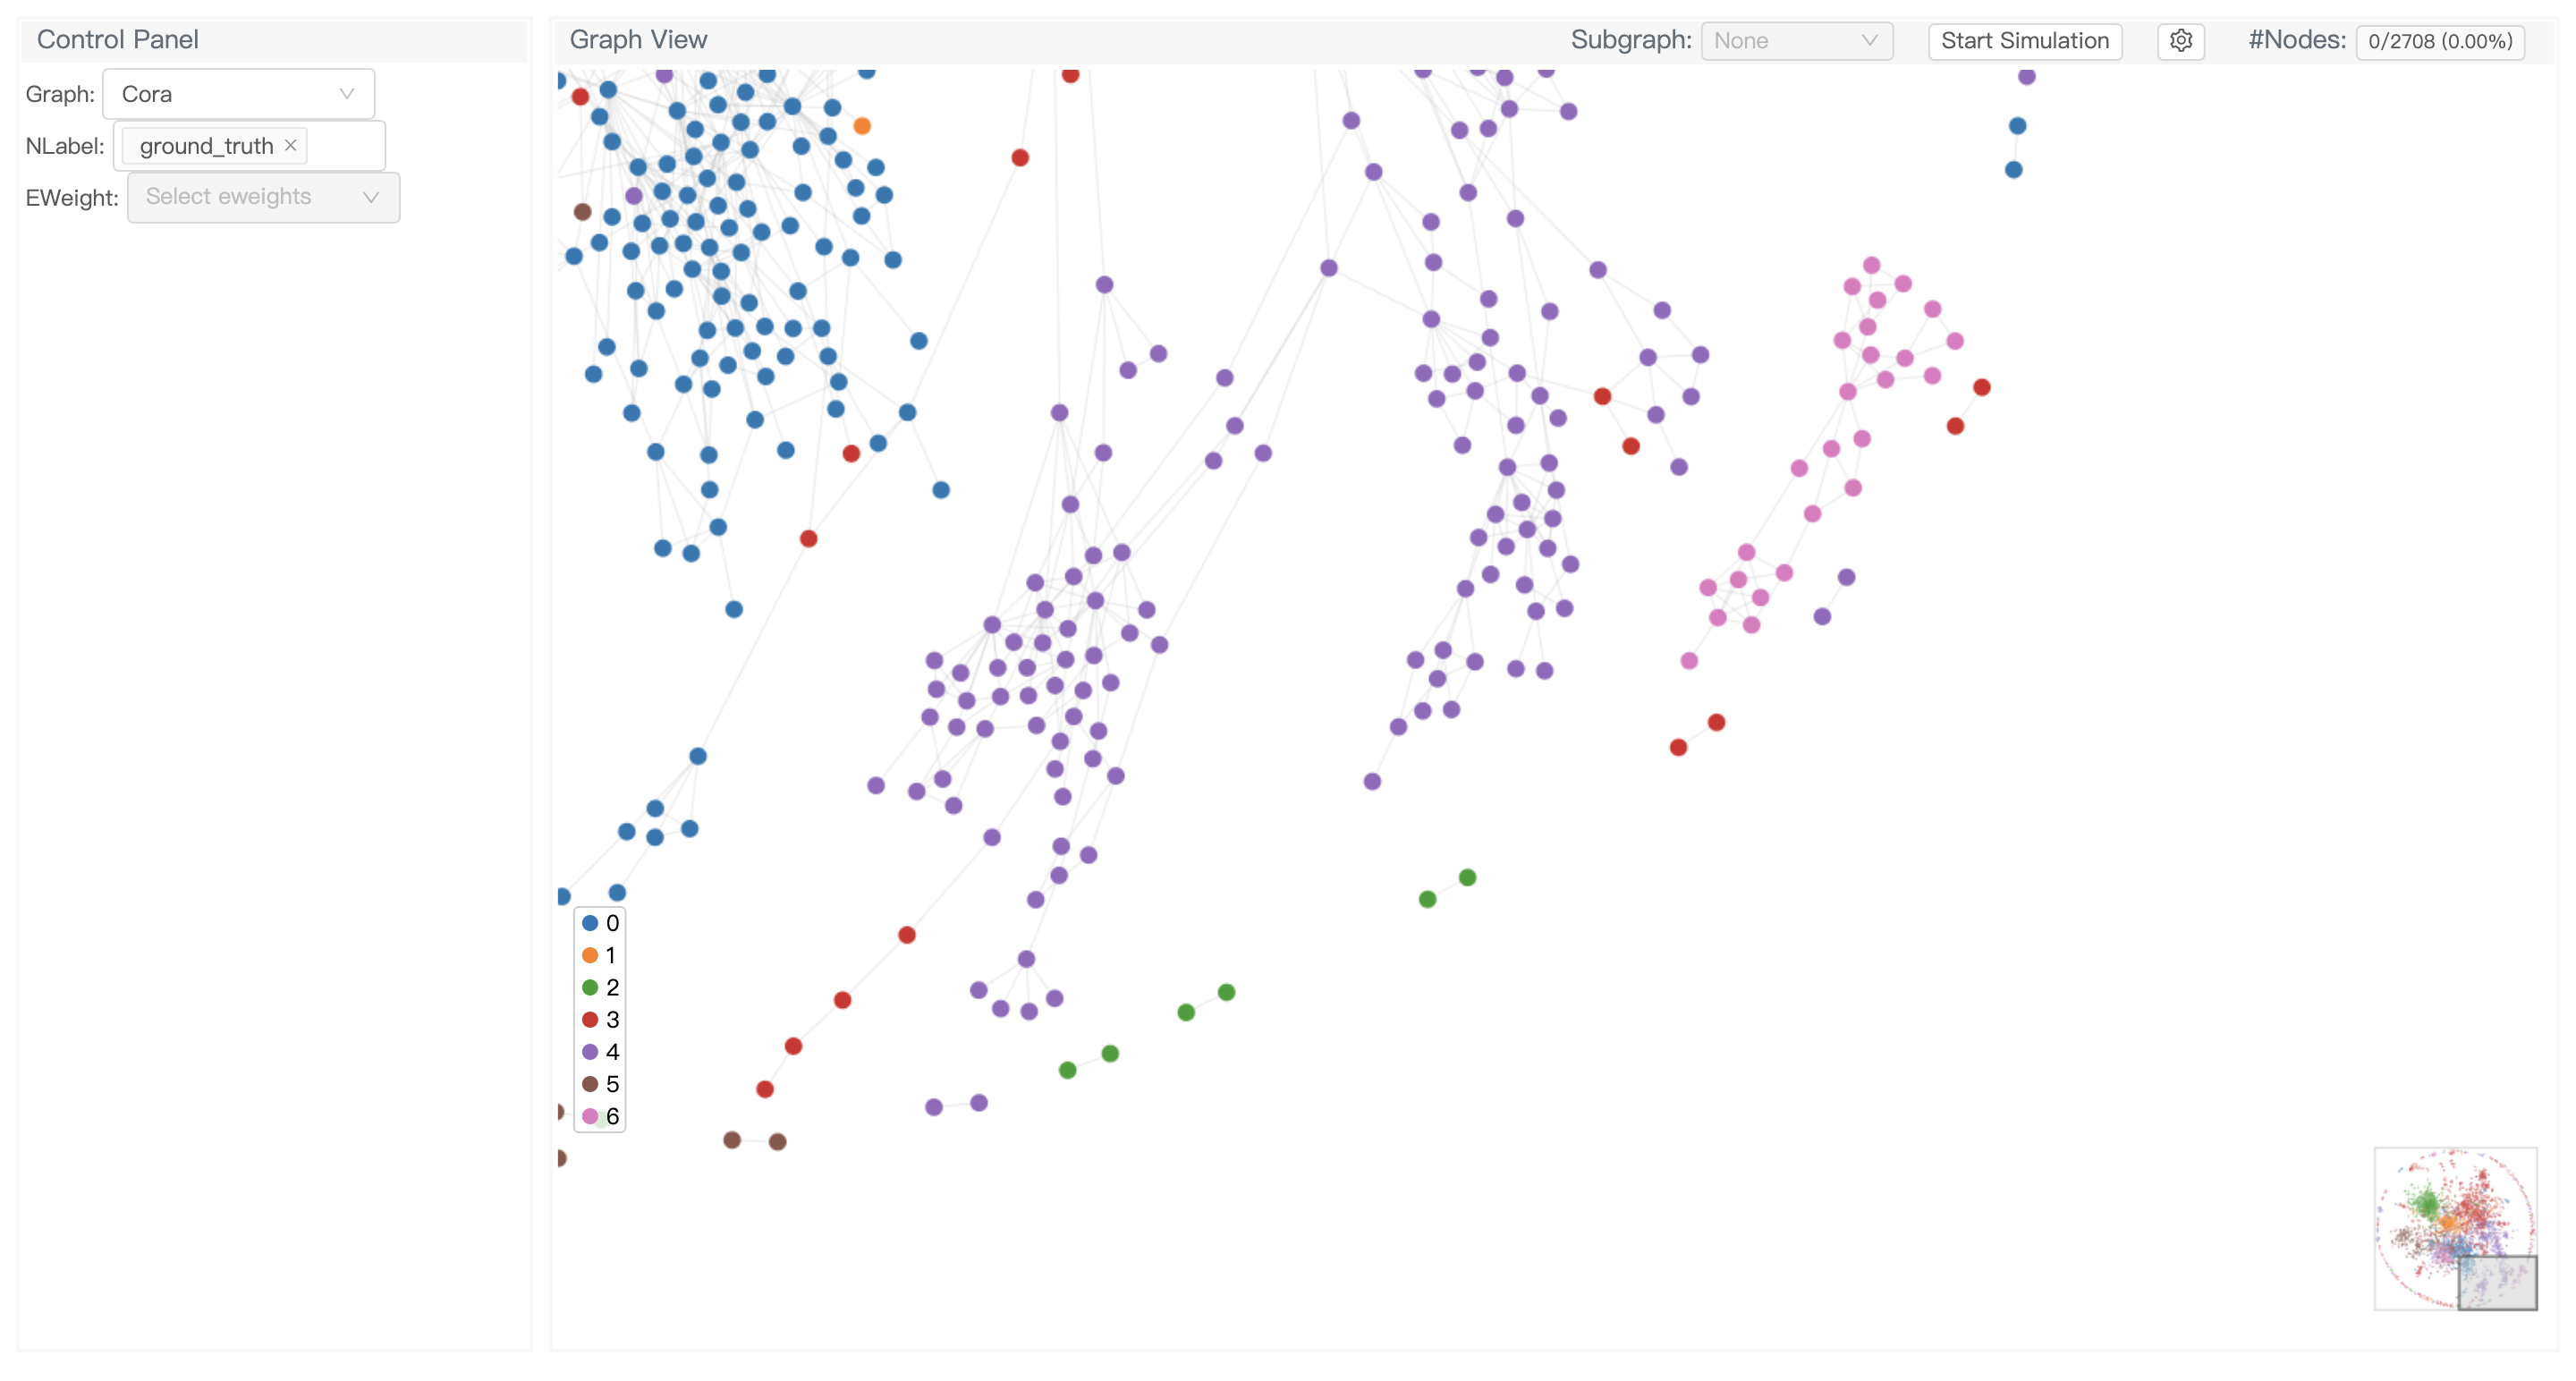
GNNLens2 is an interactive visualization tool for graph neural networks (GNN).
GNNLens2 is an interactive visualization tool for graph neural networks (GNN).
Geospatial Data Visualization using PyGMT
Example script to visualize topographic data, earthquake data, and tomographic data on a map

Detecting silent model failure. NannyML estimates performance with an algorithm called Confidence-based Performance estimation (CBPE), developed by core contributors. It is the only open-source algorithm capable of fully capturing the impact of data drift on performance.
Website • Docs • Community Slack 💡 What is NannyML? NannyML is an open-source python library that allows you to estimate post-deployment model perfor

VizTracer is a low-overhead logging/debugging/profiling tool that can trace and visualize your python code execution.
VizTracer is a low-overhead logging/debugging/profiling tool that can trace and visualize your python code execution.
OSMnx: Python for street networks. Retrieve, model, analyze, and visualize street networks and other spatial data from OpenStreetMap.
OSMnx OSMnx is a Python package that lets you download geospatial data from OpenStreetMap and model, project, visualize, and analyze real-world street