80 Repositories
Latest Python Libraries
Backtest 1000s of minute-by-minute trading algorithms for training AI with automated pricing data from: IEX, Tradier and FinViz. Datasets and trading performance automatically published to S3 for building AI training datasets for teaching DNNs how to trade. Runs on Kubernetes and docker-compose. >150 million trading history rows generated from +5000 algorithms. Heads up: Yahoo's Finance API was disabled on 2019-01-03 https://developer.yahoo.com/yql/
Stock Analysis Engine Build and tune investment algorithms for use with artificial intelligence (deep neural networks) with a distributed stack for ru
Text and code for the forthcoming second edition of Think Bayes, by Allen Downey.
Think Bayes 2 by Allen B. Downey The HTML version of this book is here. Think Bayes is an introduction to Bayesian statistics using computational meth
A modular dynamical-systems model of Ethereum's validator economics.
CADLabs Ethereum Economic Model A modular dynamical-systems model of Ethereum's validator economics, based on the open-source Python library radCAD, a

Jupyter Notebook extension leveraging pandas DataFrames by integrating DataTables and ChartJS.
Jupyter DataTables Jupyter Notebook extension to leverage pandas DataFrames by integrating DataTables JS. About Data scientists and in fact many devel

🌌 Economics Observatory Visualisation Repository
Economics Observatory Visualisation Repository Website | Visualisations | Data | Here you will find all the data visualisations and infographics attac
Documentation and samples for ArcGIS API for Python
ArcGIS API for Python ArcGIS API for Python is a Python library for working with maps and geospatial data, powered by web GIS. It provides simple and

List of Data Science Cheatsheets to rule the world
Data Science Cheatsheets List of Data Science Cheatsheets to rule the world. Table of Contents Business Science Business Science Problem Framework Dat

Use Jupyter Notebooks to demonstrate how to build a Recommender with Apache Spark & Elasticsearch
Recommendation engines are one of the most well known, widely used and highest value use cases for applying machine learning. Despite this, while there are many resources available for the basics of
Run your jupyter notebooks as a REST API endpoint. This isn't a jupyter server but rather just a way to run your notebooks as a REST API Endpoint.
Jupter Notebook REST API Run your jupyter notebooks as a REST API endpoint. This isn't a jupyter server but rather just a way to run your notebooks as

An open-source plotting library for statistical data.
Lets-Plot Lets-Plot is an open-source plotting library for statistical data. It is implemented using the Kotlin programming language. The design of Le

Customer Service Requests Analysis is one of the practical life problems that an analyst may face. This Project is one such take. The project is a beginner to intermediate level project. This repository has a Source Code, README file, Dataset, Image and License file.
Customer Service Requests Analysis Project 1 DESCRIPTION Background of Problem Statement : NYC 311's mission is to provide the public with quick and e
MLSpace: Hassle-free machine learning & deep learning development
MLSpace: Hassle-free machine learning & deep learning development
PyAF is an Open Source Python library for Automatic Time Series Forecasting built on top of popular pydata modules.
PyAF (Python Automatic Forecasting) PyAF is an Open Source Python library for Automatic Forecasting built on top of popular data science python module

Library extending Jupyter notebooks to integrate with Apache TinkerPop and RDF SPARQL.
Graph Notebook: easily query and visualize graphs The graph notebook provides an easy way to interact with graph databases using Jupyter notebooks. Us

🌐 Local tile server for viewing geospatial raster files with ipyleaflet or folium
🌐 Local Tile Server for Geospatial Rasters Need to visualize a rather large (gigabytes) raster you have locally? This is for you. A Flask application

Plotting library for IPython/Jupyter notebooks
bqplot 2-D plotting library for Project Jupyter Introduction bqplot is a 2-D visualization system for Jupyter, based on the constructs of the Grammar
Interactive Data Visualization in the browser, from Python
Bokeh is an interactive visualization library for modern web browsers. It provides elegant, concise construction of versatile graphics, and affords hi

Plotting library for IPython/Jupyter notebooks
bqplot 2-D plotting library for Project Jupyter Introduction bqplot is a 2-D visualization system for Jupyter, based on the constructs of the Grammar
Repository to store sample python programs for python learning
py Repository to store sample Python programs. This repository is meant for beginners to assist them in their learning of Python. The repository cover

In-memory Graph Database and Knowledge Graph with Natural Language Interface, compatible with Pandas
CogniPy for Pandas - In-memory Graph Database and Knowledge Graph with Natural Language Interface Whats in the box Reasoning, exploration of RDF/OWL,
Exploratory Data Analysis of the 2019 Indian General Elections using a dataset from Kaggle.
2019-indian-election-eda Exploratory Data Analysis of the 2019 Indian General Elections using a dataset from Kaggle. This project is a part of the Cou

A mindmap summarising Machine Learning concepts, from Data Analysis to Deep Learning.
A mindmap summarising Machine Learning concepts, from Data Analysis to Deep Learning.

Practical Machine Learning with Python
Master the essential skills needed to recognize and solve complex real-world problems with Machine Learning and Deep Learning by leveraging the highly popular Python Machine Learning Eco-system.
The quick and easy way to add versatile graphical interfaces with networking capabilities to your Python programs.
The quick and easy way to add versatile graphical interfaces with networking capabilities to your Python programs. Give instant access to your application to whoever you want on the Internet, without
geemap - A Python package for interactive mapping with Google Earth Engine, ipyleaflet, and ipywidgets.
A Python package for interactive mapping with Google Earth Engine, ipyleaflet, and folium
leafmap - A Python package for geospatial analysis and interactive mapping in a Jupyter environment.
A Python package for geospatial analysis and interactive mapping with minimal coding in a Jupyter environment
A site that displays up to date COVID-19 stats, powered by fastpages.
https://covid19dashboards.com This project was built with fastpages Background This project showcases how you can use fastpages to create a static das

Machine Learning with JAX Tutorials
The purpose of this repo is to make it easy to get started with JAX. It contains my "Machine Learning with JAX" series of tutorials (YouTube videos and Jupyter Notebooks) as well as the content I fou
GAT - Graph Attention Network (PyTorch) 💻 + graphs + 📣 = ❤️
GAT - Graph Attention Network (PyTorch) 💻 + graphs + 📣 = ❤️ This repo contains a PyTorch implementation of the original GAT paper ( 🔗 Veličković et

A collection of various RL algorithms like policy gradients, DQN and PPO. The goal of this repo will be to make it a go-to resource for learning about RL. How to visualize, debug and solve RL problems. I've additionally included playground.py for learning more about OpenAI gym, etc.
Reinforcement Learning (PyTorch) 🤖 + 🍰 = ❤️ This repo will contain PyTorch implementation of various fundamental RL algorithms. It's aimed at making

JupyterHub extension for ContainDS Dashboards
ContainDS Dashboards for JupyterHub A Dashboard publishing solution for Data Science teams to share results with decision makers. Run a private on-pre

Monitor the stability of a pandas or spark dataframe ⚙︎
Population Shift Monitoring popmon is a package that allows one to check the stability of a dataset. popmon works with both pandas and spark datasets.
IPython: Productive Interactive Computing
IPython: Productive Interactive Computing Overview Welcome to IPython. Our full documentation is available on ipython.readthedocs.io and contains info

High performance, editable, stylable datagrids in jupyter and jupyterlab
An ipywidgets wrapper of regular-table for Jupyter. Examples Two Billion Rows Notebook Click Events Notebook Edit Events Notebook Styling Notebook Pan

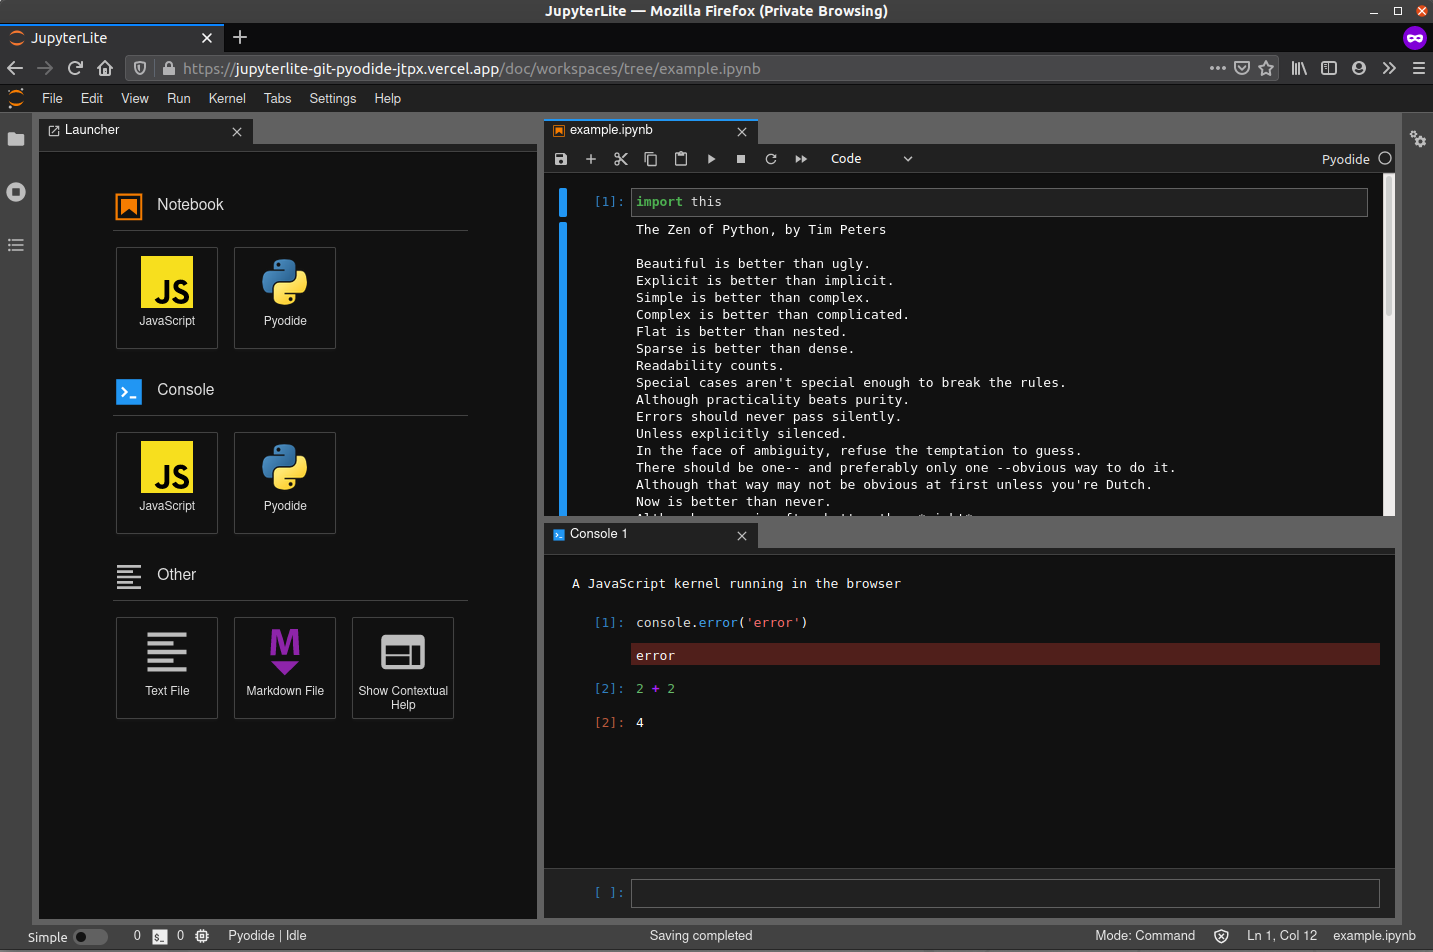
JupyterLite is a JupyterLab distribution that runs entirely in the browser power by wasm
JupyterLite is a JupyterLab distribution that runs entirely in the browser built from the ground-up using JupyterLab components and extensions.
Ready-to-run Docker images containing Jupyter applications
Jupyter Docker Stacks are a set of ready-to-run Docker images containing Jupyter applications and interactive computing tools.

Tools for diffing and merging of Jupyter notebooks.
nbdime provides tools for diffing and merging of Jupyter Notebooks.

A system for assigning and grading notebooks
nbgrader Linux: Windows: Forum: Coverage: Cite: A system for assigning and grading Jupyter notebooks. Documentation can be found on Read the Docs. Hig

A Jupyter - Leaflet.js bridge
ipyleaflet A Jupyter / Leaflet bridge enabling interactive maps in the Jupyter notebook. Usage Selecting a basemap for a leaflet map: Loading a geojso

A Jupyter - Leaflet.js bridge
ipyleaflet A Jupyter / Leaflet bridge enabling interactive maps in the Jupyter notebook. Usage Selecting a basemap for a leaflet map: Loading a geojso

Wasm powered Jupyter running in the browser 💡
JupyterLite JupyterLite is a JupyterLab distribution that runs entirely in the browser built from the ground-up using JupyterLab components and extens

:bowtie: Create a dashboard with python!
Installation | Documentation | Gitter Chat | Google Group Bowtie Introduction Bowtie is a library for writing dashboards in Python. No need to know we

Draw datasets from within Jupyter.
drawdata This small python app allows you to draw a dataset in a jupyter notebook. This should be very useful when teaching machine learning algorithm
Machine Learning Toolkit for Kubernetes
Kubeflow the cloud-native platform for machine learning operations - pipelines, training and deployment. Documentation Please refer to the official do

Cours d'Algorithmique Appliquée avec Python pour BTS SIO SISR
Course: Introduction to Applied Algorithms with Python (in French) This is the source code of the website for the Applied Algorithms with Python cours

Automatically visualize your pandas dataframe via a single print! 📊 💡
A Python API for Intelligent Visual Discovery Lux is a Python library that facilitate fast and easy data exploration by automating the visualization a

A curated list of awesome Jupyter projects, libraries and resources
Awesome Jupyter A curated list of awesome Jupyter projects, libraries and resources. Jupyter is an open-source web application that allows you to crea

A platform to display the carbon neutralization information for researchers, decision-makers, and other participants in the community.
Welcome to Carbon Insight Carbon Insight is a platform aiming to display the carbon neutralization roadmap for researchers, decision-makers, and other

Debugging, monitoring and visualization for Python Machine Learning and Data Science
Welcome to TensorWatch TensorWatch is a debugging and visualization tool designed for data science, deep learning and reinforcement learning from Micr

🛠 All-in-one web-based IDE specialized for machine learning and data science.
All-in-one web-based development environment for machine learning Getting Started • Features & Screenshots • Support • Report a Bug • FAQ • Known Issu

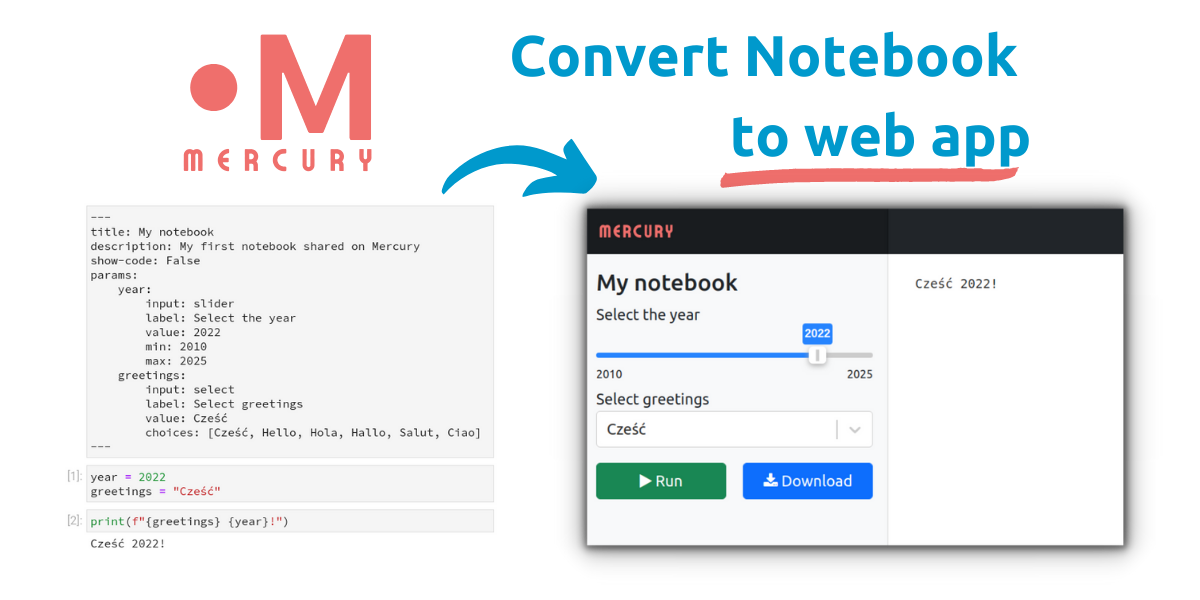
Mercury: easily convert Python notebook to web app and share with others
Mercury Share your Python notebooks with others Easily convert your Python notebooks into interactive web apps by adding parameters in YAML. Simply ad

nbsafety adds a layer of protection to computational notebooks by solving the stale dependency problem when executing cells out-of-order
nbsafety adds a layer of protection to computational notebooks by solving the stale dependency problem when executing cells out-of-order

Create charts with Python in a very similar way to creating charts using Chart.js
Create charts with Python in a very similar way to creating charts using Chart.js. The charts created are fully configurable, interactive and modular and are displayed directly in the output of the t

📚 Papermill is a tool for parameterizing, executing, and analyzing Jupyter Notebooks.
papermill is a tool for parameterizing, executing, and analyzing Jupyter Notebooks. Papermill lets you: parameterize notebooks execute notebooks This

📚 A collection of Jupyter notebooks for learning and experimenting with OpenVINO 👓
A collection of ready-to-run Python* notebooks for learning and experimenting with OpenVINO developer tools. The notebooks are meant to provide an introduction to OpenVINO basics and teach developers

Orchest is a browser based IDE for Data Science.
Orchest is a browser based IDE for Data Science. It integrates your favorite Data Science tools out of the box, so you don’t have to. The application is easy to use and can run on your laptop as well
🦩 A Python tool to create comment-free Jupyter notebooks.
Pelikan Pelikan lets you convert notebooks to comment-free notebooks. In other words, It removes Python block and inline comments from source cells in
Toci is a markdown tool to generate an outline from a given Jupyter notebook.
Toci is a markdown tool to generate an outline from a given Jupyter notebook. It traverses the markdown cells of a given ipynb file to form a toc for you.
Create HTML profiling reports from pandas DataFrame objects
Pandas Profiling Documentation | Slack | Stack Overflow Generates profile reports from a pandas DataFrame. The pandas df.describe() function is great
Create HTML profiling reports from pandas DataFrame objects
Pandas Profiling Documentation | Slack | Stack Overflow Generates profile reports from a pandas DataFrame. The pandas df.describe() function is great