Jupyter Notebook extension leveraging pandas DataFrames by integrating DataTables and ChartJS.

Overview

Jupyter DataTables

Jupyter Notebook extension to leverage pandas DataFrames by integrating DataTables JS.


About

Data scientists and in fact many developers work with pd.DataFrame on daily basis to interpret data to process them. In my typical workflow. The common workflow is to display the dataframe, take a look at the data schema and then produce multiple plots to check the distribution of the data to have a clearer picture, perhaps search some data in the table, etc...

What if those distribution plots were part of the standard DataFrame and we had the ability to quickly search through the table with minimal effort? What if it was the default representation?

The jupyter-datatables uses jupyter-require to draw the table.


Installation

pip install jupyter-datatables

Usage

import numpy as np
import pandas as pd

from jupyter_datatables import init_datatables_mode

init_datatables_mode()

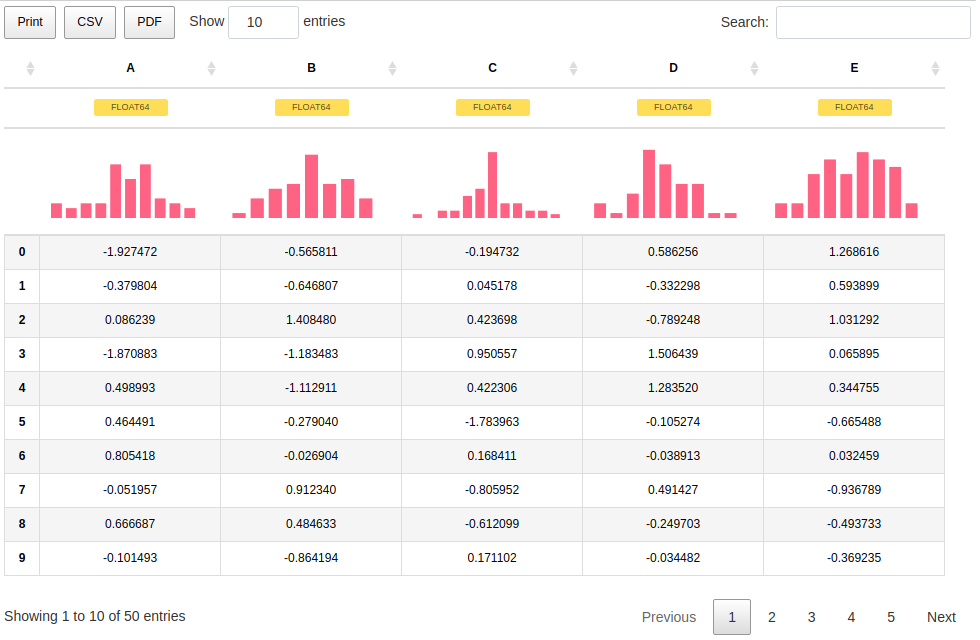
That's it, your default pandas representation will now use Jupyter DataTables!

df = pd.DataFrame(np.abs(np.random.randn(50, 5)), columns=list(string.ascii_uppercase[:5]))

Jupyter Datatables table representation


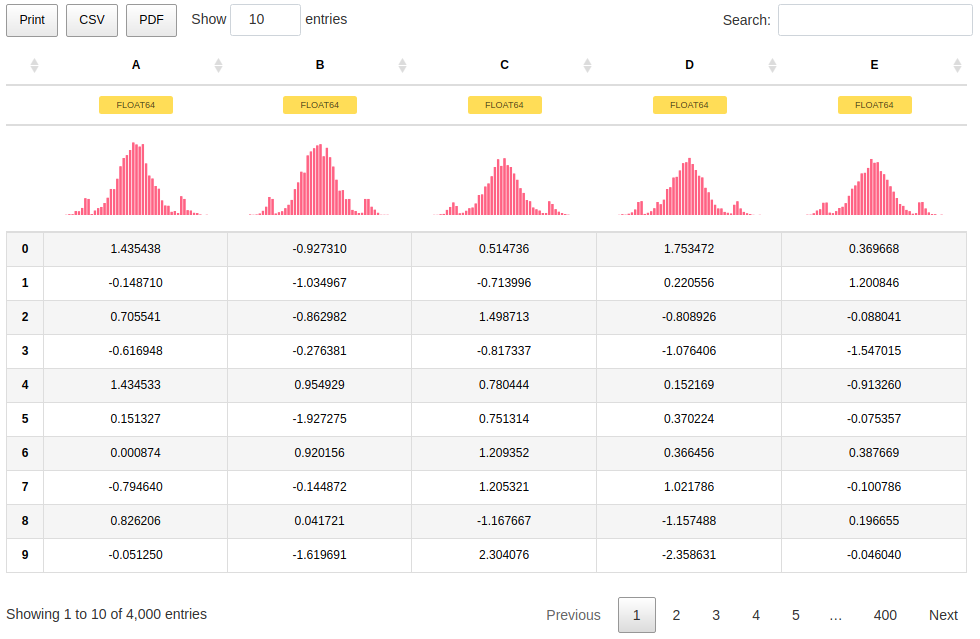
In most cases, you don't need to worry too much about the size of your data. Jupyter DataTables calculates required sample size based on a confidence interval (by default this would be 0.95) and margin of error and ceils it to the highest 'smart' value.

For example, for a data containing 100,000 samples, given 0.975 confidence interval and 0.02 margin of error, the Jupyter DataTables would calculate that 3044 samples are required and it would round it up to 4000.

Jupyter Datatables long table sample size

With additional note:

Sample size: 4,000 out of 100,000


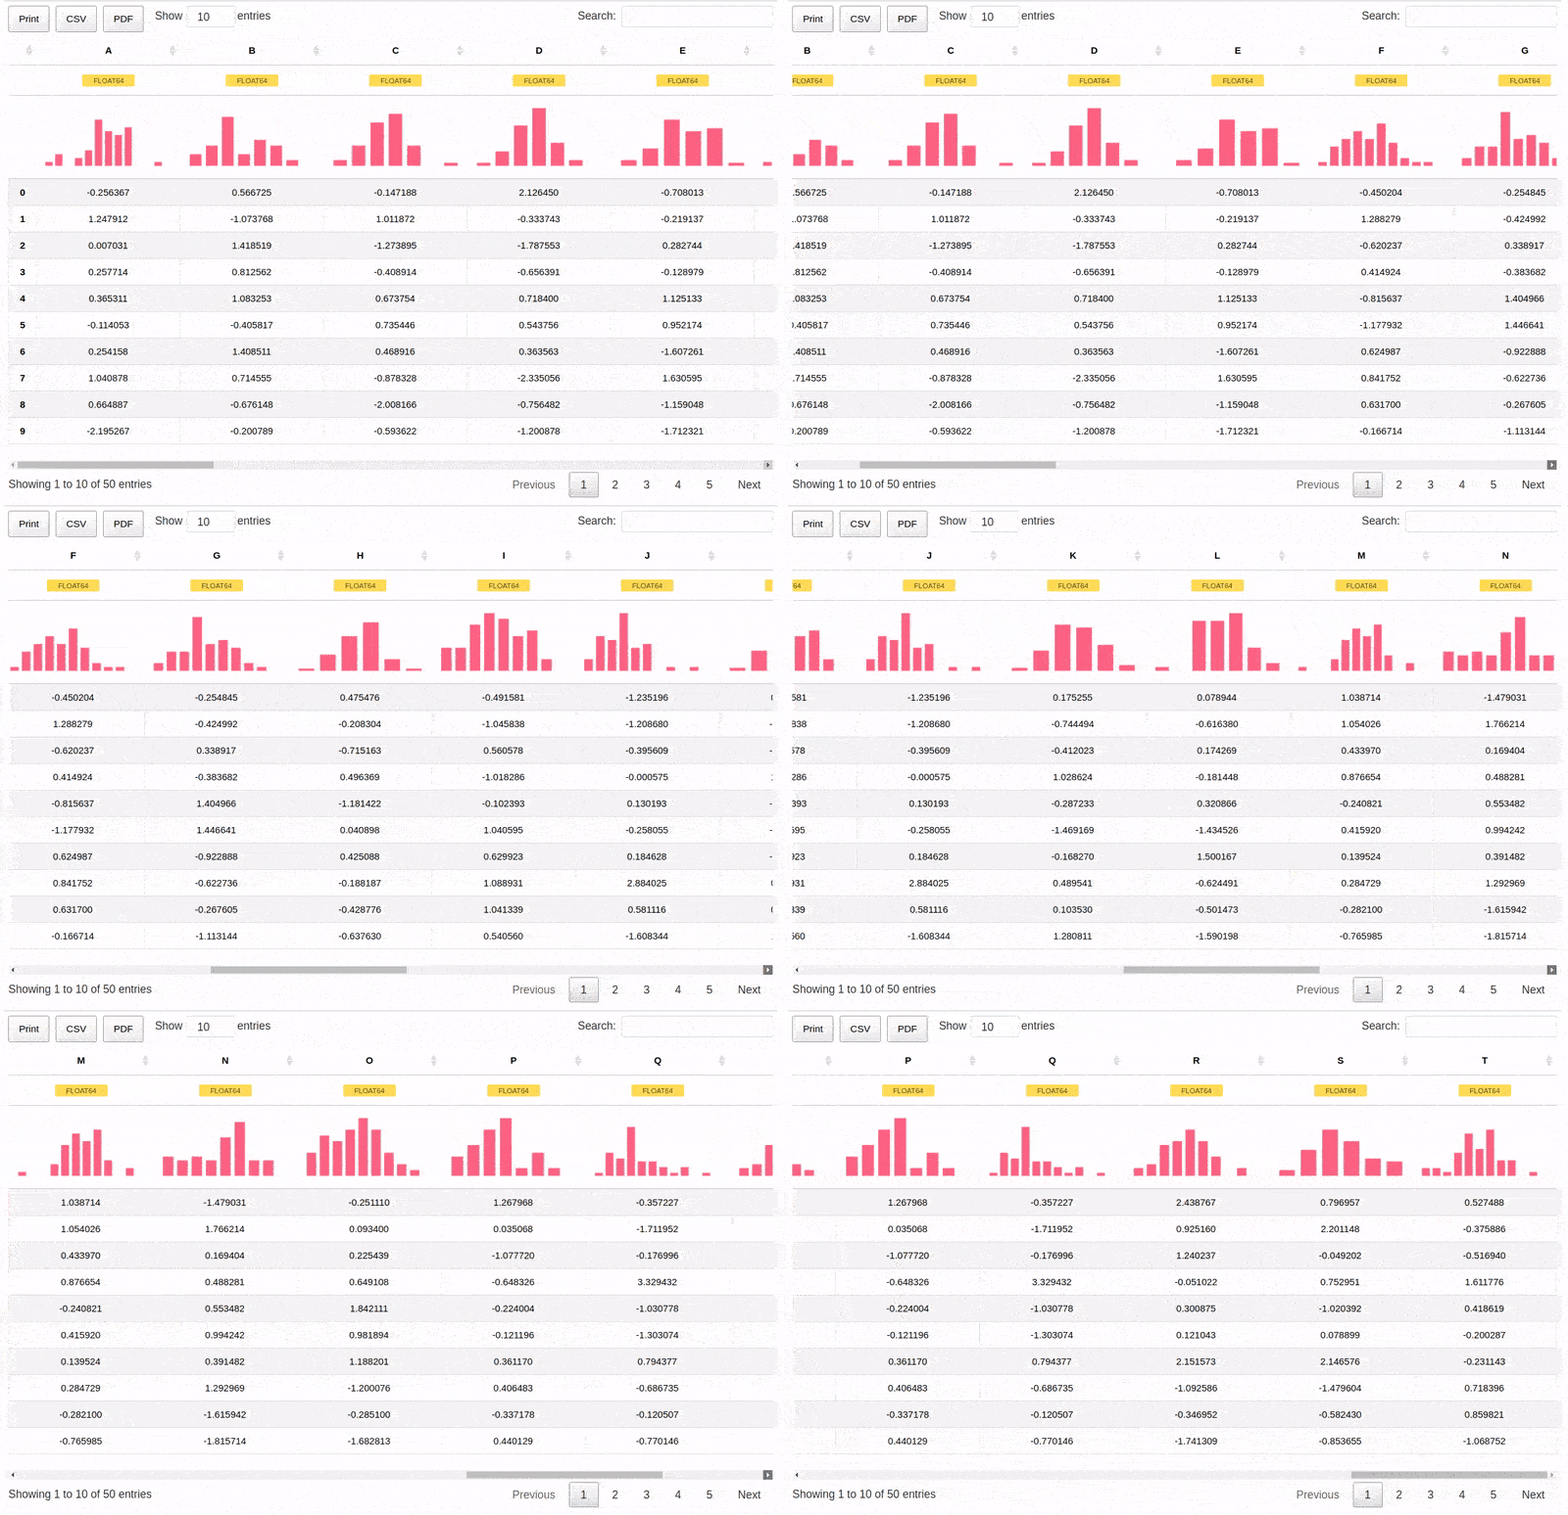
We can also handle wide tables with ease.

df = pd.DataFrame(np.abs(np.random.randn(50, 20)), columns=list(string.ascii_uppercase[:20]))

Jupyter Datatables wide table representation


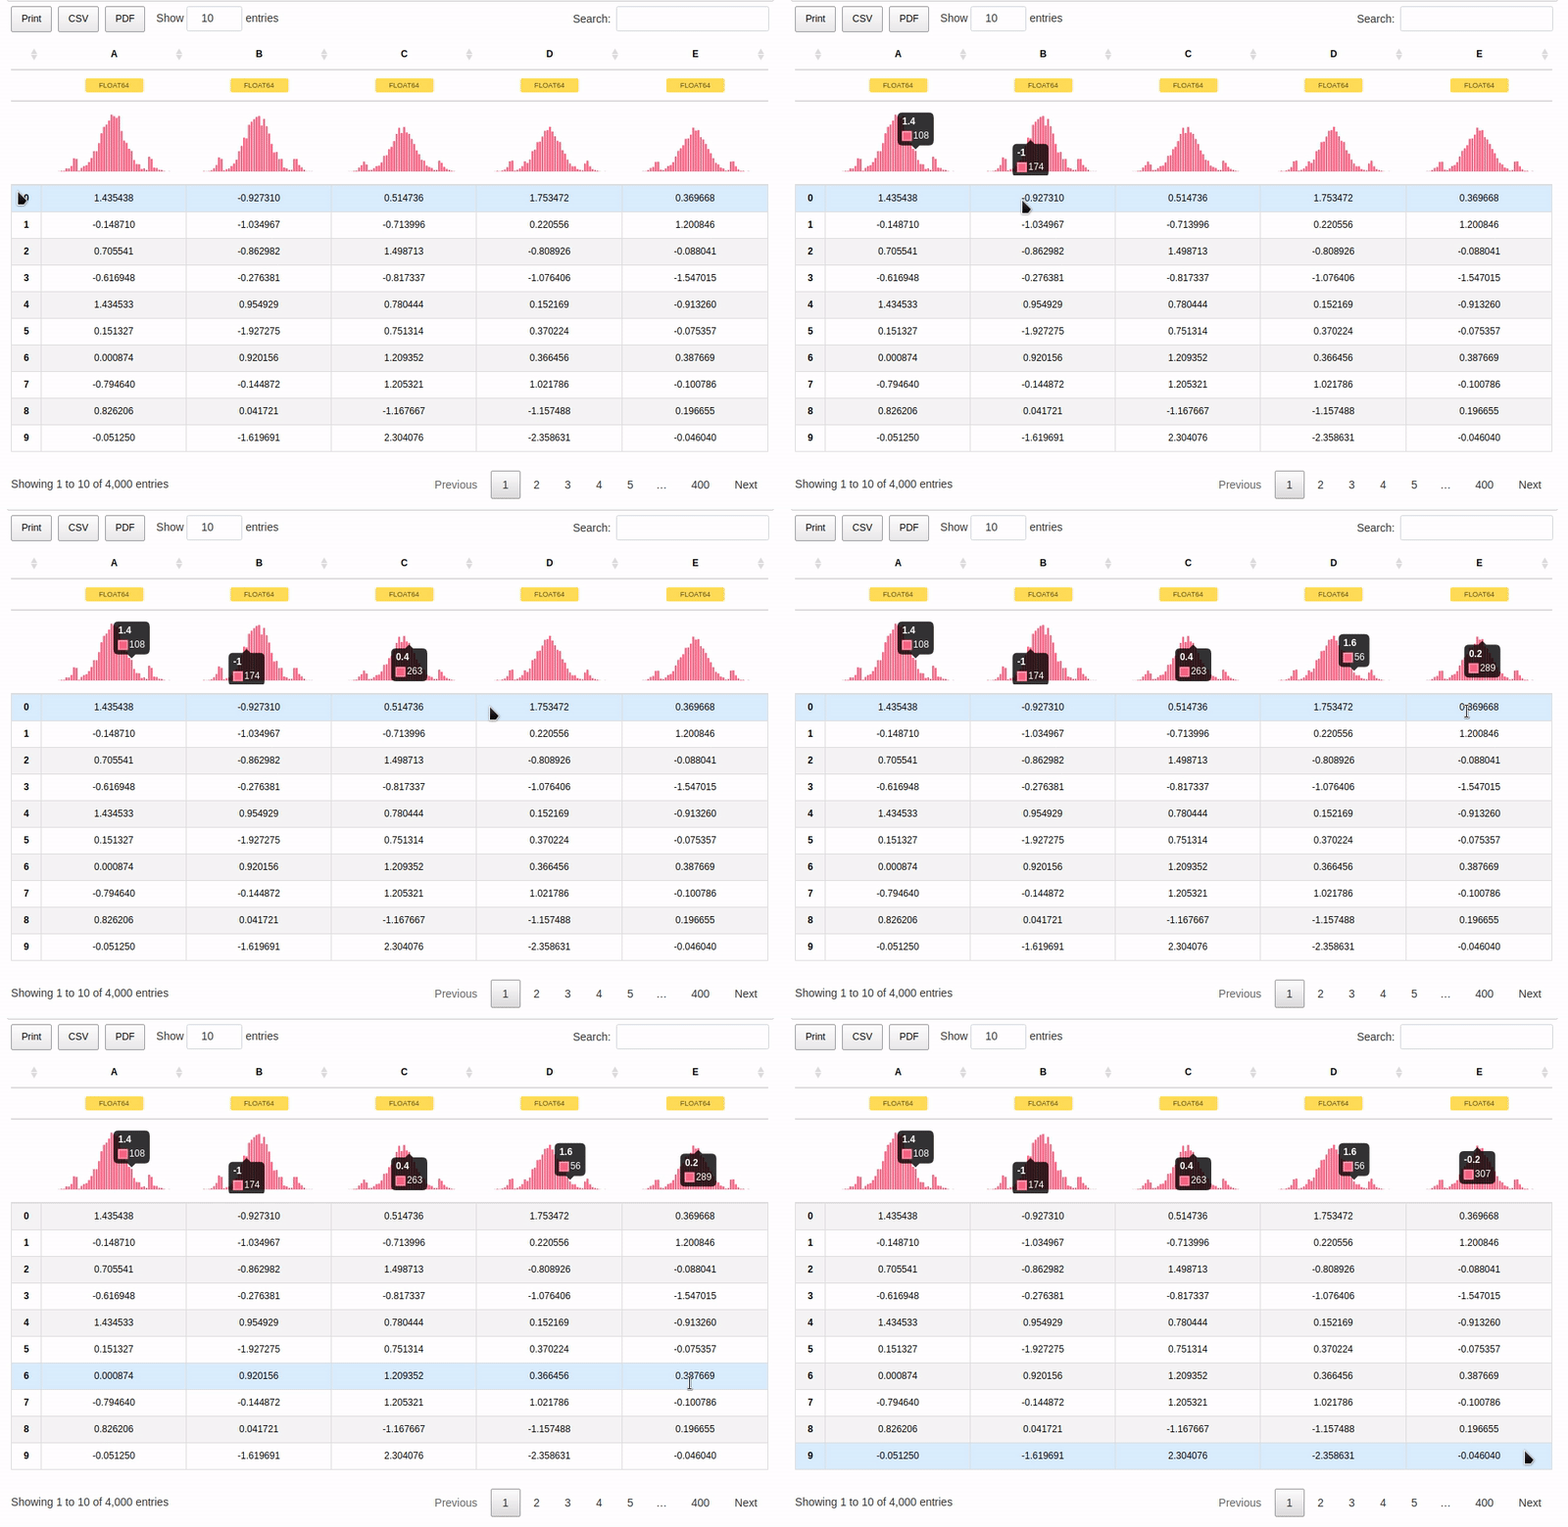
As per 0.3.0, there is a support for interactive tooltips:

Jupyter Datatables wide table representation

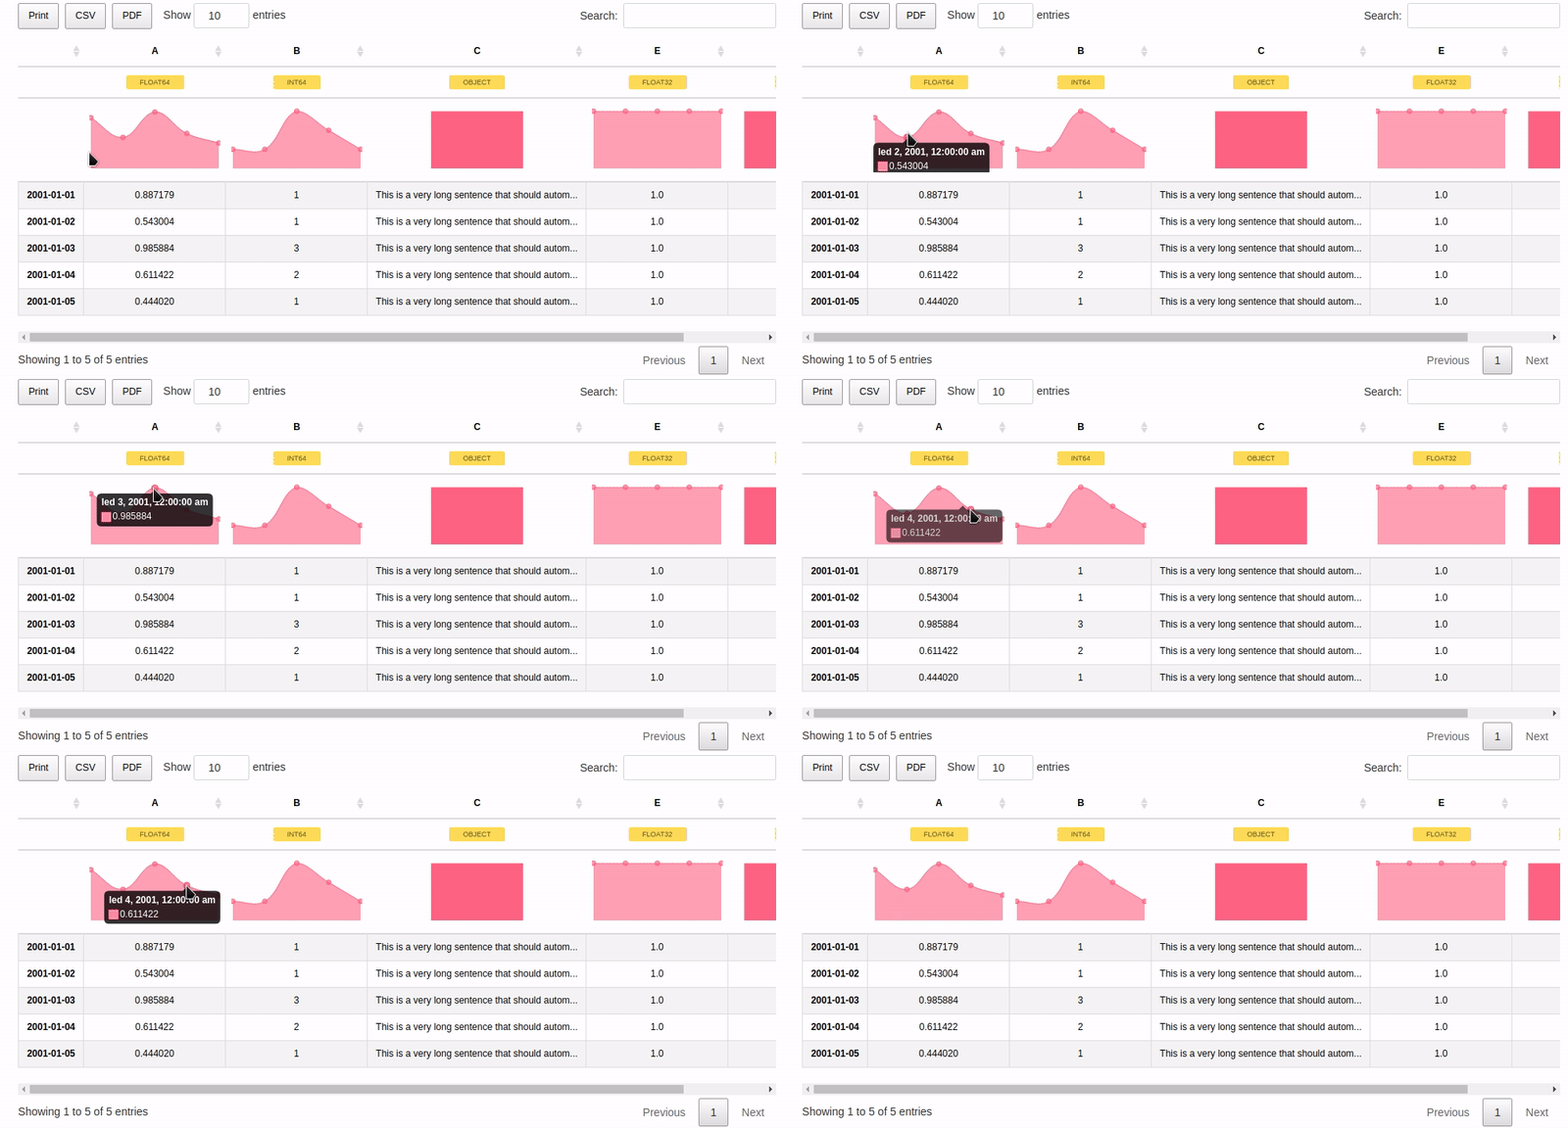
And also support for custom indices including Date type:

dft = pd.DataFrame({'A': np.random.rand(5),
                    'B': [1, 1, 3, 2, 1],
                    'C': 'This is a very long sentence that should automatically be trimmed',
                    'D': [pd.Timestamp('20010101'), pd.Timestamp('20010102'), pd.Timestamp('20010103'), pd.Timestamp('20010104'), pd.Timestamp('20010105')],
                    'E': pd.Series([1.0] * 5).astype('float32'),
                    'F': [False, True, False, False, True],
                   })

dft.D = dft.D.apply(pd.to_datetime)
dft.set_index('D', inplace=True)

Jupyter Datatables wide table representation


Current status and future plans:

Check out the Project Board where we track issues and TODOs for our Jupyter tooling!


Author: Marek Cermak [email protected], @AICoE
Owner
Marek Čermák
DevOps Engineer @ LivesportTV
Marek Čermák
Flipper Zero documentation repo

Flipper Zero Docs Participation To fix a bug or add something new to this repository, you need to open a pull-request. Also, on every page of the site

Flipper Zero (All Repositories will be public soon) 114 Dec 30, 2022
Bokeh Plotting Backend for Pandas and GeoPandas

Pandas-Bokeh provides a Bokeh plotting backend for Pandas, GeoPandas and Pyspark DataFrames, similar to the already existing Visualization feature of

Patrik Hlobil 822 Jan 07, 2023
ecoglib: visualization and statistics for high density microecog signals

ecoglib: visualization and statistics for high density microecog signals This library contains high-level analysis tools for "topos" and "chronos" asp

1 Nov 17, 2021
coordinate to draw the nimbus logo on the graffitiwall

This is a community effort to draw the nimbus logo on beaconcha.in's graffitiwall. get started clone repo with git clone https://github.com/tennisbowl

4 Apr 04, 2022
This is a super simple visualization toolbox (script) for transformer attention visualization ✌

Trans_attention_vis This is a super simple visualization toolbox (script) for transformer attention visualization ✌ 1. How to prepare your attention m

Mingyu Wang 3 Jul 09, 2022
1900-2016 Olympic Data Analysis in Python by plotting different graphs

🔥 Olympics Data Analysis 🔥 In Data Science field, there is a big topic before creating a model for future prediction is Data Analysis. We can find o

Sayan Roy 1 Feb 06, 2022
A small collection of tools made by me, that you can use to visualize atomic orbitals in both 2D and 3D in different aspects.

Orbitals in Python A small collection of tools made by me, that you can use to visualize atomic orbitals in both 2D and 3D in different aspects, and o

Prakrisht Dahiya 1 Nov 25, 2021
nvitop, an interactive NVIDIA-GPU process viewer, the one-stop solution for GPU process management

An interactive NVIDIA-GPU process viewer, the one-stop solution for GPU process management.

Xuehai Pan 1.3k Jan 02, 2023
A python script and steps to display locations of peers connected to qbittorrent

A python script (along with instructions) to display the locations of all the peers your qBittorrent client is connected to in a Grafana worldmap dash

62 Dec 07, 2022
High performance, editable, stylable datagrids in jupyter and jupyterlab

An ipywidgets wrapper of regular-table for Jupyter. Examples Two Billion Rows Notebook Click Events Notebook Edit Events Notebook Styling Notebook Pan

J.P. Morgan Chase 75 Dec 15, 2022
Generate a 3D Skyline in STL format and a OpenSCAD file from Gitlab contributions

Your Gitlab's contributions in a 3D Skyline gitlab-skyline is a Python command to generate a skyline figure from Gitlab contributions as Github did at

Félix Gómez 70 Dec 22, 2022
CONTRIBUTIONS ONLY: Voluptuous, despite the name, is a Python data validation library.

CONTRIBUTIONS ONLY What does this mean? I do not have time to fix issues myself. The only way fixes or new features will be added is by people submitt

Alec Thomas 1.8k Dec 31, 2022
Editor and Presenter for Manim Generated Content.

Editor and Presenter for Manim Generated Content. Take a look at the Working Example. More information can be found on the documentation. These Browse

Manim Community 149 Dec 29, 2022
Handout for the tutorial "Creating publication-quality figures with matplotlib"

Handout for the tutorial "Creating publication-quality figures with matplotlib"

JB Mouret 1.9k Jan 02, 2023
Data Visualizer for Super Mario Kart (SNES)

Data Visualizer for Super Mario Kart (SNES)

MrL314 21 Nov 20, 2022
A way of looking at COVID-19 data that I haven't seen before.

Visualizing Omicron: COVID-19 Deaths vs. Cases Click here for other countries. Data is from Our World in Data/Johns Hopkins University. About this pro

1 Jan 10, 2022
demir.ai Dataset Operations

demir.ai Dataset Operations With this application, you can have the empty values (nan/null) deleted or filled before giving your dataset to machine le

Ahmet Furkan DEMIR 8 Nov 01, 2022
3D Vision functions with end-to-end support for deep learning developers, written in Ivy.

Ivy vision focuses predominantly on 3D vision, with functions for camera geometry, image projections, co-ordinate frame transformations, forward warping, inverse warping, optical flow, depth triangul

Ivy 61 Dec 29, 2022
A Python function that makes flower plots.

Flower plot A Python 3.9+ function that makes flower plots. Installation This package requires at least Python 3.9. pip install

Thomas Roder 4 Jun 12, 2022
Implementation of SOMs (Self-Organizing Maps) with neighborhood-based map topologies.

py-self-organizing-maps Simple implementation of self-organizing maps (SOMs) A SOM is an unsupervised method for learning a mapping from a discrete ne

Jonas Grebe 6 Nov 22, 2022