leafmap - A Python package for geospatial analysis and interactive mapping in a Jupyter environment.

Overview

Welcome to leafmap

image image image image image image image image image image

A Python package for geospatial analysis and interactive mapping in a Jupyter environment.

Introduction

leafmap is a Python package for geospatial analysis and interactive mapping in a Jupyter environment. It is a spin-off project of the geemap Python package, which was designed specifically to work with Google Earth Engine (GEE). However, not everyone in the geospatial community has a GEE account. leafmap is designed to fill this gap for non-GEE users. It enables users to perform advanced geospatial analysis and interactive mapping with minimal coding in a Jupyter environment (e.g., Google Colab, JupyterLab, Jupyter notebook). It is built upon a number of open-source packages, such as folium and ipyleaflet (for creating interactive maps), WhiteboxTools and whiteboxgui (for analyzing geospatial data), and ipywidgets (for designing interactive graphical user interface).

The WhiteboxTools library currently contains 447 tools, which are each grouped based on their main function into one of the following categories. For a list of available tools with comprehensive documentation and usage details, please see the WhiteboxTools User Manual.

Launch the interactive notebook tutorial for the leafmap Python package with Google Colab or Binder now:

image image

Key Features

Below is a partial list of features available for the leafmap package. Please check the examples page for notebook examples, GIF animations, and video tutorials.

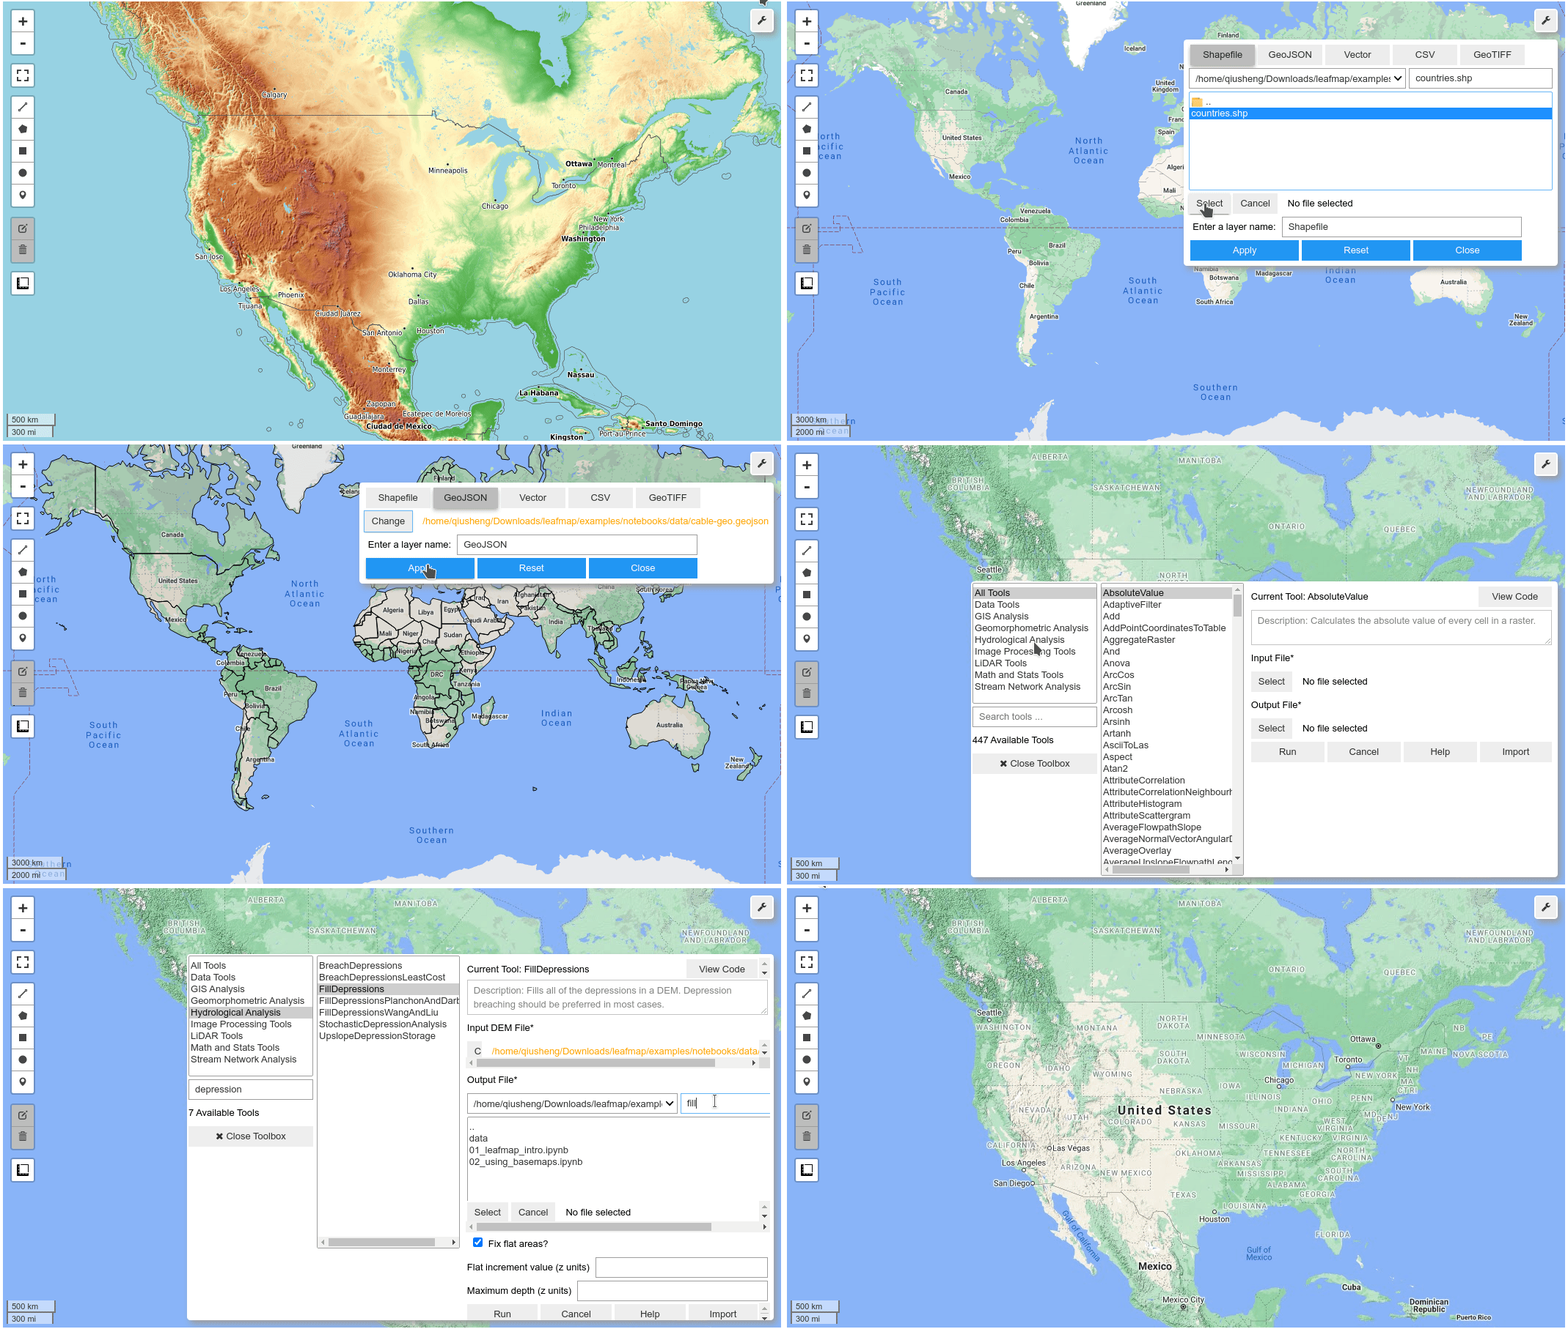
  • Create an interactive map with only one-line of code.
  • Select from a variety of basemaps interactively without coding.
  • Add XYZ and WMS tile services to the map.
  • Convert CSV to points and display points as a marker cluster.
  • Add local vector data (e.g., shapefile, GeoJSON, KML) to the map without coding.
  • Add local raster data (e.g., GeoTIFF) to the map without coding.
  • Add Cloud Optimized GeoTIFF (COG) and SpatialTemporal Asset Catalog (STAC) to the map.
  • Add custom legends and colorbars to the map.
  • Perform geospatial analysis using WhiteboxTools and whiteboxgui.
  • Publish interactive maps with only one line of code.

Demo

YouTube Channel

I have created a YouTube Channel for sharing geospatial tutorials. You can subscribe to my channel for regular updates. If there is any specific tutorial you would like to see, please submit a feature request here.

Earth Engine Tutorials on YouTube

Comments
  • Install on Pyodide/JupyterLite

    Install on Pyodide/JupyterLite

    It would be really cool to run leafmap on Pyodide and hence JupyterLite using micropip.

    I gave it a try and found basically two issues with non-existing Python 3 source wheels (needed by micropip) for pycrs and pyshp on PyPI for which I've created these tickets (but there might be wheels for them hosted somewhere else): https://github.com/karimbahgat/PyCRS/issues/56 and https://github.com/GeospatialPython/pyshp/issues/217. And here-map-widget-for-jupyter can be installed, too, but still has some issue with the JupyterLab extension, as described on https://github.com/heremaps/here-map-widget-for-jupyter/issues/25. Folium can be installed in a somewhat complicated manner, see the notebook pyolite folium.ipynb on JupyterLite.

    Not sure if anything else is needed... ;)

    help wanted Feature Request 
    opened by deeplook 20
  • QGIS Layer export TIF on leafmap

    QGIS Layer export TIF on leafmap

    Hi I am able to get the 03 COG STAC tutorial working using your provided tif files, but when I use the QGIS exported file, I am unable to see any bound values and when trying to run the leafmap it gives me this error

    image

    bug 
    opened by Niko-La 14
  • Generalize the titiler_endpoint parameter

    Generalize the titiler_endpoint parameter

    Currently, the default titiler_endpoint is https://api.cogeo.xyz/. It would be useful to generalize the titiler_endpointso that users can provide a custom endpoint. @TomAugspurger

    For example, Microsoft Planetary Computer has its own titiler endpoint at https://planetarycomputer.microsoft.com/api/data/v1/docs#/. Ideally, the add_cog_layer() function should be able to automatically detect if the notebook is running within Planetary Computer (e.g., import planetary-computer is successful) and use the custom endpoint.

    https://leafmap.org/leafmap/#leafmap.leafmap.Map.add_cog_layer https://leafmap.org/leafmap/#leafmap.leafmap.Map.add_cog_mosaic

    https://planetarycomputer.microsoft.com/api/data/v1

    Feature Request 
    opened by giswqs 14
  • Add support for visualizing LiDAR data

    Add support for visualizing LiDAR data

    References:

    • https://github.com/laspy/laspy
    • https://github.com/isl-org/Open3D
    • https://medium.com/spatial-data-science/an-easy-way-to-work-and-visualize-lidar-data-in-python-eed0e028996c
    Feature Request 
    opened by giswqs 11
  • plotly colab import error

    plotly colab import error

    image

    looks like colab is giving issue.

    Environment Information

    • leafmap version:
    • Python version:
    • Operating System:

    Description

    Describe what you were trying to get done. Tell us what happened, what went wrong, and what you expected to happen.

    What I Did

    Paste the command(s) you ran and the output.
    If there was a crash, please include the traceback here.
    
    bug 
    opened by Niko-La 10
  • ImageOverlay from local files

    ImageOverlay from local files

    Add a new ImageOverlay class that extends ipyleaflet.ImageOverlay for supporting local files.

    Reference: https://github.com/banesullivan/localtileserver/issues/25 @deeplook

    Feature Request 
    opened by giswqs 10
  • Added support for bokeh #298

    Added support for bokeh #298

    This PR adds bokeh as a new plotting backend. Currently, it supports adding basemaps, loading COG and local raster datasets. Supporting for loading vector data is in progress.

    import leafmap.bokehmap as leafmap
    m = leafmap.Map()
    m.add_basemap('ROADMAP')
    url = 'https://opendata.digitalglobe.com/events/california-fire-2020/pre-event/2018-02-16/pine-gulch-fire20/1030010076004E00.tif'
    m.add_cog_layer(url)
    m
    

    Peek 2022-11-07 16-06

    Feature Request 
    opened by giswqs 9
  • Added two functions to add and check styles for different type of geo…

    Added two functions to add and check styles for different type of geo…

    …metries

    Please inform me if any further changes are required. e.g:

    • m.add_geojson_layer('local_geojson_url','layer1','red')
    • m.add_geojson_layer('https://raw.githubusercontent.com/plotly/datasets/master/geojson-counties-fips.json','layer2')
    opened by rowheat02 9
  • Can't add a Geotiff raster layer to the map

    Can't add a Geotiff raster layer to the map

    Environment Information

    • leafmap version: 0.1.0
    • Python version: 3.7.10
    • Operating System: Windows

    Description

    After installing xarray-leaflet, I tried to add a Geotiff raster layer to the map.

    Once the file is chosen, I press the apply button and the map zooms to the right coordinates, a layer is created but nothing is displayed.

    I'm attaching the file I'm trying to display so you can try on your own.

    file.zip

    bug 
    opened by mamoev 9
  • style_callback param for add_geojson() not working?

    style_callback param for add_geojson() not working?

    Environment Information

    • leafmap version: 0.5.0
    • Python version: 3.9
    • Operating System: Linux/macOS

    Description

    I want to use the style_callback parameter for map.add_geojson(), but the chosen style which sets only the color seems not to be respected. I think the style dicts are the same for ipyleaflet and leafmap, at least I could not find any contradictory information. See below.

    import requests
    data = requests.get((
        "https://raw.githubusercontent.com/telegeography/www.submarinecablemap.com"
        "/master/web/public/api/v3/cable/cable-geo.json"
    )).json()
    callback = lambda feat: {"color": feat["properties"]["color"]}
    
    import leafmap
    m = leafmap.Map(center=[0, 0], zoom=2)
    m.add_geojson(data, style_callback=callback)
    m.layout.height = "100px"
    m
    
    Screen Shot 2021-10-03 at 11 12 53
    import ipyleaflet
    m = ipyleaflet.Map(center=[0, 0], zoom=2)
    m += ipyleaflet.GeoJSON(data=data, style_callback=callback)
    m.layout.height = "100px"
    m
    
    Screen Shot 2021-10-03 at 11 14 14 bug 
    opened by deeplook 8
  • get the coordinates of a user-drawn polygon

    get the coordinates of a user-drawn polygon

    First of all, congratulations Dr. Qiusheng for your fantastic work !

    I became a 100% geemap user and one of the very useful functions when working with feature exploration (1) is to manually draw a polygon in an area of interest, (2) extract the coordinates with Map.draw_last_feature and then (3) export this polygon as a shapefile or even a featureCollection in the case of ee.

    I looked for something similar in the leafmap but I couldn't find it, although it is possible to easily draw the polygon and see its individual points, but it seems to me that there is a lack of a similar routine to manipulate the coordinates extracted from the map.

    That would be of great value. Best wishes Andre

    Feature Request 
    opened by andrebelem 8
  • Input data from OGCAPI endpoints

    Input data from OGCAPI endpoints

    Description

    Allow simple connection to be vector data served from OGCAPI-Features endpoints. Potentially also OGCAPI-Tiles similar to WMS function.

    Imagined functionality: User provides endpoint and collection or juster endpoint to the collection - https://ogcapi.bgs.ac.uk/collections/bgsgeology625kbedrock

    Source code

    Potentially use OWSLib package to pull data?

    Feature Request 
    opened by KoalaGeo 1
  • Panoply netCDF, HDF and GRIB Data Viewer

    Panoply netCDF, HDF and GRIB Data Viewer

    The Panoply app is quite interesting. It would be great to have some similar functionality in leafmap.

    • https://www.giss.nasa.gov/tools/panoply/
    • http://soliton.vm.bytemark.co.uk/pub/cpt-city/
    • https://www.ventusky.com/

    image

    Feature Request 
    opened by giswqs 0
  • Making interactive hillshade maps

    Making interactive hillshade maps

    • https://github.com/banesullivan/localtileserver-demo/blob/main/hillshade.ipynb
    • https://www.neonscience.org/resources/learning-hub/tutorials/create-hillshade-py
    • https://www.whiteboxgeo.com/manual/wbt_book/available_tools/geomorphometric_analysis.html?highlight=shaded#multidirectionalhillshade
    • https://earthpy.readthedocs.io/en/latest/gallery_vignettes/plot_dem_hillshade.html
    Feature Request 
    opened by giswqs 0
  • Add support for ipybertin

    Add support for ipybertin

    ipybertin is a new mapping library. It would be great to add it as a new plotting backend.

    • https://github.com/davidbrochart/ipybertin
    • https://github.com/neocarto/bertin

    Peek 2022-06-28 11-29

    Feature Request 
    opened by giswqs 0
Releases(v0.15.0)
Owner
Qiusheng Wu
Assistant Professor of Geography at the University of Tennessee, Knoxville
Qiusheng Wu
Advanced raster and geometry manipulations

buzzard In a nutshell, the buzzard library provides powerful abstractions to manipulate together images and geometries that come from different kind o

Earthcube Lab 30 Jun 20, 2022
Focal Statistics

Focal-Statistics The Focal statistics tool in many GIS applications like ArcGIS, QGIS and GRASS GIS is a standard method to gain a local overview of r

Ifeanyi Nwasolu 1 Oct 21, 2021
geemap - A Python package for interactive mapping with Google Earth Engine, ipyleaflet, and ipywidgets.

A Python package for interactive mapping with Google Earth Engine, ipyleaflet, and folium

Qiusheng Wu 2.4k Dec 30, 2022
Python module and script to interact with the Tractive GPS tracker.

pyTractive GPS Python module and script to interact with the Tractive GPS tracker. Requirements Python 3 geopy folium pandas pillow usage: main.py [-h

Dr. Usman Kayani 3 Nov 16, 2022
prettymaps - A minimal Python library to draw customized maps from OpenStreetMap data.

A small set of Python functions to draw pretty maps from OpenStreetMap data. Based on osmnx, matplotlib and shapely libraries.

Marcelo de Oliveira Rosa Prates 9k Jan 08, 2023
Logging the position of the car on an sdcard

audi-mmi-3g-gps-logging Logging the position of the car on an sdcard, startup script origin not clear to me, logging setup and time change is what I d

2 May 31, 2022
Python renderer for OpenStreetMap with custom icons intended to display as many map features as possible

Map Machine project consists of Python OpenStreetMap renderer: SVG map generation, SVG and PNG tile generation, Röntgen icon set: unique CC-BY 4.0 map

Sergey Vartanov 0 Dec 18, 2022
Map Ookla server locations as a Kernel Density Estimation (KDE) geographic map plot.

Ookla Server KDE Plotting This notebook was created to map Ookla server locations as a Kernel Density Estimation (KDE) geographic map plot. Currently,

Jonathan Lo 1 Feb 12, 2022
Introduction to Geospatial Analysis in Python

Introduction to Geospatial Analysis in Python This repository is in support of a talk on geospatial data. Data To recreate all of the examples, the da

Dillon Gardner 6 Oct 19, 2022
Google Maps keeps old satellite imagery around for a while – this tool collects what's available for a user-specified region in the form of a GIF.

google-maps-at-88-mph The folks maintaining Google Maps regularly update the satellite imagery it serves its users, but outdated versions of the image

Noah Doersing 111 Sep 27, 2022
pure-Python (Numpy optional) 3D coordinate conversions for geospace ecef enu eci

Python 3-D coordinate conversions Pure Python (no prerequistes beyond Python itself) 3-D geographic coordinate conversions and geodesy. API similar to

Geospace code 292 Dec 29, 2022
:earth_asia: Python Geocoder

Python Geocoder Simple and consistent geocoding library written in Python. Table of content Overview A glimpse at the API Forward Multiple results Rev

Denis 1.5k Jan 02, 2023
List of Land Cover datasets in the GEE Catalog

List of Land Cover datasets in the GEE Catalog A list of all the Land Cover (or discrete) datasets in Google Earth Engine. Values, Colors and Descript

David Montero Loaiza 5 Aug 24, 2022
Raster processing benchmarks for Python and R packages

Raster processing benchmarks This repository contains a collection of raster processing benchmarks for Python and R packages. The tests cover the most

Krzysztof Dyba 13 Oct 24, 2022
A simple reverse geocoder that resolves a location to a country

Reverse Geocoder This repository holds a small web service that performs reverse geocoding to determine whether a user specified location is within th

4 Dec 25, 2021
Helping data scientists better understand their datasets and models in text classification. With love from ServiceNow.

Azimuth, an open-source dataset and error analysis tool for text classification, with love from ServiceNow. Overview Azimuth is an open source applica

ServiceNow 145 Dec 23, 2022
Automated download of LANDSAT data from USGS website

LANDSAT-Download It seems USGS has changed the structure of its data, and so far, I have not been able to find the direct links to the products? Help

Olivier Hagolle 197 Dec 30, 2022
Tile Map Service and OGC Tiles API for QGIS Server

Tiles API Add tiles API to QGIS Server Tiles Map Service API OGC Tiles API Tile Map Service API - TMS The TMS API provides these URLs: /tms/? to get i

3Liz 6 Dec 01, 2021
Python bindings and utilities for GeoJSON

geojson This Python library contains: Functions for encoding and decoding GeoJSON formatted data Classes for all GeoJSON Objects An implementation of

Jazzband 765 Jan 06, 2023
Mmdb-server - An open source fast API server to lookup IP addresses for their geographic location

mmdb-server mmdb-server is an open source fast API server to lookup IP addresses

Alexandre Dulaunoy 67 Nov 25, 2022