The Metabolomics Integrator (MINT) is a post-processing tool for liquid chromatography-mass spectrometry (LCMS) based metabolomics.

Overview

CII Best Practices Github All Releases

MINT (Metabolomics Integrator)

The Metabolomics Integrator (MINT) is a post-processing tool for liquid chromatography-mass spectrometry (LCMS) based metabolomics. Metabolomics is the study of all metabolites (small chemical compounds) in a biological sample e.g. from bacteria or a human blood sample. The metabolites can be used to define biomarkers used in medicine to find treatments for diseases or for the development of diagnostic tests or for the identification of pathogens such as methicillin resistant Staphylococcus aureus (MRSA). More information on how to install and run the program can be found in the Documentation or check out the Quickstart to jump right into it.

Browser based as standalone application or server based

A demo server is available here. Be mindful, you share the server with others.

Metabolomics with Python

MINT originally started as Python project. The core of MINT is a Python class for targeted metabolomics that can be used independent of the graphical application.

from ms_mint.notebook import Mint
mint.ms_files = glob('/path/to/files/*mzML')
mint.peaklist_files = '/path/to/peaklist/file/peaklist.csv'
mint.run()
mint.results

Mint Jupyter Results

Contributions are welcome

MINT integrates open-source software and packages into a Python library for metabolomics with a browser based GUI. It is programmed by scientists for scientists to contribute to better and faster science integrating best practices of data management and computer science. Contributions are welcome that improve the efficiency of the code, bug fixes, feature implementations, security enhancements among others. If you want to contribute to MINT please send me a notification.

How to contribute

Errors, Feedback, Feature Requests

If you encounter an error, if you have a request for a new feature, or for general feedback, please open a new ticket at the issue tracker.

Code contributions

If your are up to enhance the codebase yourself, we ask you to followowing steps:

  1. fork the repository
  2. implement the new feature or bug-fix
  3. add corresponding tests
  4. run flake8
  5. submit a pull request

Code standards

Before submitting a pull request please run flake8.

Get in touch

Open an issue or join the slack channel.

Acknowledgements

This project would not be possible without the help of the open-source community. The tools and resources provided by GitHub, Docker-Hub, the Python Package Index, as well the answers from dedicated users on Stackoverflow and the Plotly community, as well as the free open-source packages used are the foundation of this project. Several people have made direct contributions to the codebase and we are extremely grateful for that.

  • @rokm refactored the specfile for Pyinstaller to create a windows package.
  • @bucknerns helped with the configuration of the versioneer file.

Last but not least, we want to thank all the users and early adopters that drive the development with feature requests and bug reports.

You might also like...
Simple spectra visualization tool for astronomers

SpecViewer A simple visualization tool for astronomers. Dependencies Python = 3.7.4 PyQt5 = 5.15.4 pyqtgraph == 0.10.0 numpy = 1.19.4 How to use py

A visualization tool made in Pygame for various pathfinding algorithms.

Pathfinding-Visualizer 🚀 A visualization tool made in Pygame for various pathfinding algorithms. Pathfinding is closely related to the shortest path

A command line tool for visualizing CSV/spreadsheet-like data

PerfPlotter Read data from CSV files using pandas and generate interactive plots using bokeh, which can then be embedded into HTML pages and served by

simple tool to paint axis x and y

simple tool to paint axis x and y

A System Metrics Monitoring Tool Built using Python3 , rabbitmq,Grafana and InfluxDB. Setup using docker compose. Use to monitor system performance with graphical interface of grafana , storage of influxdb and message queuing of rabbitmq Bioinformatics tool for exploring RNA-Protein interactions
Bioinformatics tool for exploring RNA-Protein interactions

Explore RNA-Protein interactions. RNPFind is a bioinformatics tool. It takes an RNA transcript as input and gives a list of RNA binding protein (RBP)

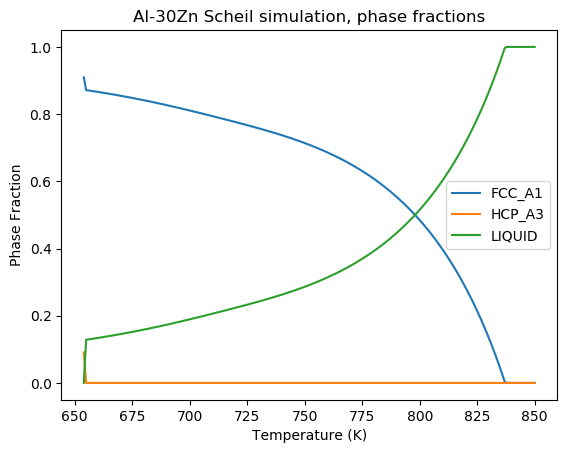
A Scheil-Gulliver simulation tool using pycalphad.

scheil A Scheil-Gulliver simulation tool using pycalphad. import matplotlib.pyplot as plt from pycalphad import Database, variables as v from scheil i

A tool for automatically generating 3D printable STLs from freely available lidar scan data.

mini-map-maker A tool for automatically generating 3D printable STLs from freely available lidar scan data. Screenshots Tutorial To use this script, g

The Spectral Diagram (SD) is a new tool for the comparison of time series in the frequency domain

The Spectral Diagram (SD) is a new tool for the comparison of time series in the frequency domain. The SD provides a novel way to display the coherence function, power, amplitude, phase, and skill score of discrete frequencies of two time series. Each SD summarises these quantities in a single plot for multiple targeted frequencies.

Comments
  • error

    error

    Hello, first of all congratulations for the application. I tried to run the application but got an error. First of all, the application is constantly updating itself in the part with dash. Secondly, when it comes to the upload data part, the following calback error appears.

    Callback error updating {"index": "ms-uploader-output", "type": "output"}, "children" TypeError: expected str, bytes or os.PathLike object, not list fn_new = P(ms_dir) / P(fn).name I couldn't run it, it seems to load the data, but it doesn't, giving these errors.

    (I guess P(fn).name doesn't see it as path.)

    opened by hilaluzunoglu 0
Releases(0.0.56)
Owner
Sören Wacker
Research Associate in the Lewis Research Group at the University of Calgary.
Sören Wacker
Blender addon that creates a temporary window of any type from the 3D View.

CreateTempWindow2.8 Blender addon that creates a temporary window of any type from the 3D View. Features Can the following window types: 3D View Graph

3 Nov 27, 2022
Simple implementation of Self Organizing Maps (SOMs) with rectangular and hexagonal grid topologies

py-self-organizing-map Simple implementation of Self Organizing Maps (SOMs) with rectangular and hexagonal grid topologies. A SOM is a simple unsuperv

Jonas Grebe 1 Feb 10, 2022
Jupyter Notebook extension leveraging pandas DataFrames by integrating DataTables and ChartJS.

Jupyter DataTables Jupyter Notebook extension to leverage pandas DataFrames by integrating DataTables JS. About Data scientists and in fact many devel

Marek Čermák 142 Dec 28, 2022
Sci palettes for matplotlib/seaborn

sci palettes for matplotlib/seaborn Installation python3 -m pip install sci-palettes Usage import seaborn as sns import matplotlib.pyplot as plt impor

Qingdong Su 2 Jun 07, 2022
WhatsApp Chat Analyzer is a WebApp and it can be used by anyone to analyze their chat. 😄

WhatsApp-Chat-Analyzer You can view the working project here. WhatsApp chat Analyzer is a WebApp where anyone either tech or non-tech person can analy

Prem Chandra Singh 26 Nov 02, 2022
A shimmer pre-load component for Plotly Dash

dash-loading-shimmer A shimmer pre-load component for Plotly Dash Installation Get it with pip: pip install dash-loading-extras Or maybe you prefer Pi

Lucas Durand 4 Oct 12, 2022
Joyplots in Python with matplotlib & pandas :chart_with_upwards_trend:

JoyPy JoyPy is a one-function Python package based on matplotlib + pandas with a single purpose: drawing joyplots (a.k.a. ridgeline plots). The code f

Leonardo Taccari 462 Jan 02, 2023
Material for dataviz course at university of Bordeaux

Material for dataviz course at university of Bordeaux

Nicolas P. Rougier 50 Jul 17, 2022
An intuitive library to add plotting functionality to scikit-learn objects.

Welcome to Scikit-plot Single line functions for detailed visualizations The quickest and easiest way to go from analysis... ...to this. Scikit-plot i

Reiichiro Nakano 2.3k Dec 31, 2022
Open-source demos hosted on Dash Gallery

Dash Sample Apps This repository hosts the code for over 100 open-source Dash apps written in Python or R. They can serve as a starting point for your

Plotly 2.7k Jan 07, 2023
A Python library created to assist programmers with complex mathematical functions

libmaths was created not only as a learning experience for me, but as a way to make mathematical models in seconds for Python users using mat

Simple 73 Oct 02, 2022
Lightweight, extensible data validation library for Python

Cerberus Cerberus is a lightweight and extensible data validation library for Python. v = Validator({'name': {'type': 'string'}}) v.validate({

eve 2.9k Dec 27, 2022
Bcc2telegraf: An integration that sends ebpf-based bcc histogram metrics to telegraf daemon

bcc2telegraf bcc2telegraf is an integration that sends ebpf-based bcc histogram

Peter Bobrov 2 Feb 17, 2022
JSNAPY example: Validate NAT policies

JSNAPY example: Validate NAT policies Overview This example will show how to use JSNAPy to make sure the expected NAT policy matches are taking place.

Calvin Remsburg 1 Jan 07, 2022
Here I plotted data for the average test scores across schools and class sizes across school districts.

HW_02 Here I plotted data for the average test scores across schools and class sizes across school districts. Average Test Score by Race This graph re

7 Oct 27, 2021
PolytopeSampler is a Matlab implementation of constrained Riemannian Hamiltonian Monte Carlo for sampling from high dimensional disributions on polytopes

PolytopeSampler PolytopeSampler is a Matlab implementation of constrained Riemannian Hamiltonian Monte Carlo for sampling from high dimensional disrib

9 Sep 26, 2022
Generate graphs with NetworkX, natively visualize with D3.js and pywebview

webview_d3 This is some PoC code to render graphs created with NetworkX natively using D3.js and pywebview. The main benifit of this approac

byt3bl33d3r 68 Aug 18, 2022
A small timeseries transformation API built on Flask and Pandas

#Mcflyin ###A timeseries transformation API built on Pandas and Flask This is a small demo of an API to do timeseries transformations built on Flask a

Rob Story 84 Mar 25, 2022
A programming language built on top of Python to easily allow Swahili speakers to get started with programming without ever knowing English

pyswahili A programming language built over Python to easily allow swahili speakers to get started with programming without ever knowing english pyswa

Jordan Kalebu 72 Dec 15, 2022
It's an application to calculate I from v and r. It can also plot a graph between V vs I.

Ohm-s-Law-Visualizer It's an application to calculate I from v and r using Ohm's Law. It can also plot a graph between V vs I. Story I'm doing my Unde

Sihab Sahariar 1 Nov 20, 2021