A tool for automatically generating 3D printable STLs from freely available lidar scan data.

Overview

mini-map-maker

A tool for automatically generating 3D printable STLs from freely available lidar scan data.

Screenshots

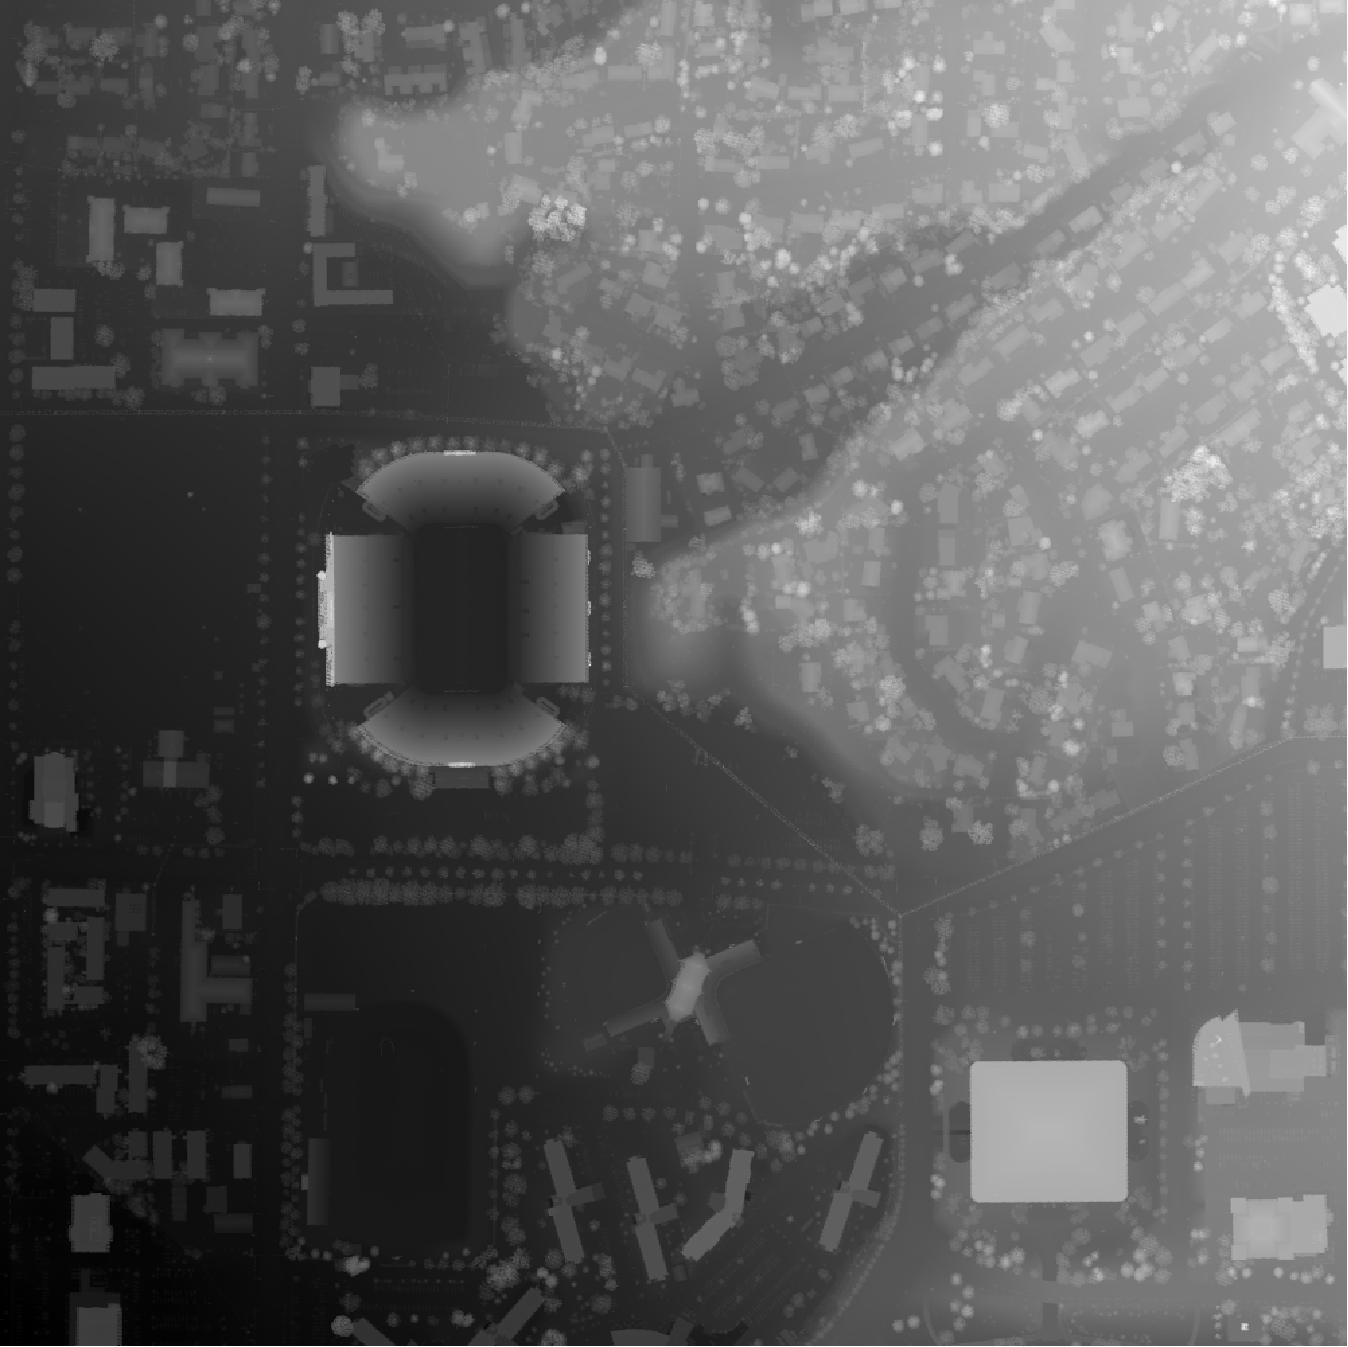
image image

Tutorial

To use this script, go to the USGS LidarExplorer

https://prd-tnm.s3.amazonaws.com/LidarExplorer/index.html#/

Select an area, and then click the "Download list" button under "Lidar within AOI" image This should give you a file called downloadlist.txt. Simply place this text file in the same directory as the script, and then run the script (convert.py, or convert.exe if you don't want to deal with Python). By default, mini-map-maker will generate an STL file for each tile in the lidar data. However, there are quite a few command line arguments that you can use to customize the output.

>convert.py -h

usage: convert [-h] [--input INPUT] [--reduce REDUCE] [--vscale VSCALE]
               [--base BASE] [--merge] [--no_stl] [--cleanup] [--filter FILTER] [--prj]

A utility for automatically generating 3D printable STLs from USGS lidar scans.

optional arguments:
  -h, --help            show this help message and exit
  
  --input INPUT, -i INPUT
                        The name of the file containing the URLs of all of the lidar scan data.
                        
  --reduce REDUCE, -r REDUCE
                        A decimal value that will decrease the output file size as it increases.
                        The default value is 1.0
                        
  --vscale VSCALE, -v VSCALE
                        A decimal value that will make artificially make things taller as it increases.
                        The default value is 1.0
                        
  --base BASE, -b BASE  A decimal value that sets the base height of the model. The default value is 0.0
  
  --merge, -m           Using this flag will merge all of the point clouds into one file before converting into a DEM.
  
  --no_stl, -s          Using this flag will disable STL generation.
  
  --cleanup, -c         Using this flag will cause the program to automatically delete the unzipped point cloud files
                        after running.
                        
  --filter FILTER, -f FILTER
                        A percent value (0-100, for the slope of the points being smoothed) that will enable the spike
                        smoothing option. This is good if you have points that are floating way up above the model and
                        causing spikes in your final model.
                        
  --prj, -p             Using this flag will cause the program to automatically download and use lastools to generate
                        projection files for the elevation models. This is important if you want to generate the STLs
                        yourself in QGIS, but it means you'll have to be mindful of lastool's license limitations.
                        More info on lastool's website (https://rapidlasso.com/lastools/).
                        
  --external_files, -e  Using this flag will grab las/laz files from the LAS directory instead of downloading them from
                        an input list.

Additional Examples:

External Files

Let's say you already have some las files you want to use. Simply place them into a directory called LAS, and then call the script from from the directory containing the LAS folder, using the --external_files flag, like so:

convert.py --external_files

This trick also works with LAZ files, or even a mix of LAZ and LAS files.

Adding a Base and Manipulating the Output

For one project, I had a LAZ file that had a section of ocean. This caused the output to be super flat, and too thin in several places to print well. Additionally, it was a pretty high resolution file, so the output STL was very large, and I wasn't happy with the vertical scale of the file either. So, after placing my LAZ file into a directory labeled LAS like mentioned above, I used the following command:

convert.py --external_files --filter 50 --base 10 --vscale 0.5 --reduce 2

Filtering got rid of some weird spikes in the output STL, and the base command increased the total height of the output. The vscale command made the model shorter, and reduce significantly decreased the size of the STL.

Support This Project

Like this project? Feel free to make a donation.

ko-fi

Licensing

With the default options, this program is completely open source, and the output is usable in a commercial environment. This code itself is MIT License, as is r-barnes' DEMto3D library that this program makes use of.

https://github.com/r-barnes/DEMto3D

If you want to use the output in QGIS or another GIS program, and enable .prj file generation, then the sript will automatically download lastools. The .prj files generated are free to use if it's not for commercial purposes. If you plan on using the .prj files for commercial purposes, you will need to purchase a lastools license in accordance with the information on lastool's website:

https://rapidlasso.com/lastools/

Additionally, this script makes use of some public domain utilities from FUSION by the US Forest Service

http://forsys.sefs.uw.edu/FUSION/fusion_overview.html

With the addition of LAZ processing, this project now utilizes LASzip, an LGPL-2.1 tool. It is included as a precompiled binary (laszip-cli.exe), and no modifications have been made.
https://github.com/LASzip/LASzip

Owner
Mike Abbott
Mike Abbott
Create a table with row explanations, column headers, using matplotlib

Create a table with row explanations, column headers, using matplotlib. Intended usage was a small table containing a custom heatmap.

4 Aug 14, 2022
Visualizing weather changes across the world using third party APIs and Python.

WEATHER FORECASTING ACROSS THE WORLD Overview Python scripts were created to visualize the weather for over 500 cities across the world at varying di

G Johnson 0 Jun 12, 2021
Generate visualizations of GitHub user and repository statistics using GitHub Actions.

GitHub Stats Visualization Generate visualizations of GitHub user and repository statistics using GitHub Actions. This project is currently a work-in-

JoelImgu 3 Dec 14, 2022
Script to create an animated data visualisation for categorical timeseries data - GIF choropleth map with annotations.

choropleth_ldn Simple script to create a chloropleth map of London with categorical timeseries data. The script in main.py creates a gif of the most f

1 Oct 07, 2021
A python script editor for napari based on PyQode.

napari-script-editor A python script editor for napari based on PyQode. This napari plugin was generated with Cookiecutter using with @napari's cookie

Robert Haase 9 Sep 20, 2022
Python package for hypergraph analysis and visualization.

The HyperNetX library provides classes and methods for the analysis and visualization of complex network data. HyperNetX uses data structures designed to represent set systems containing nested data

Pacific Northwest National Laboratory 304 Dec 27, 2022
A tool for automatically generating 3D printable STLs from freely available lidar scan data.

mini-map-maker A tool for automatically generating 3D printable STLs from freely available lidar scan data. Screenshots Tutorial To use this script, g

Mike Abbott 51 Nov 06, 2022
Mapomatic - Automatic mapping of compiled circuits to low-noise sub-graphs

mapomatic Automatic mapping of compiled circuits to low-noise sub-graphs Overvie

Qiskit Partners 27 Nov 06, 2022
Sprint planner considering JIRA issues and google calendar meetings schedule.

Sprint planner Sprint planner is a Python script for planning your Jira tasks based on your calendar availability. Installation Use the package manage

Apptension 2 Dec 05, 2021
A simple script that displays pixel-based animation on GitHub Activity

GitHub Activity Animator This project contains a simple Javascript snippet that produces an animation on your GitHub activity tracker. The project als

16 Nov 15, 2021
Yata is a fast, simple and easy Data Visulaization tool, running on python dash

Yata is a fast, simple and easy Data Visulaization tool, running on python dash. The main goal of Yata is to provide a easy way for persons with little programming knowledge to visualize their data e

Cybercreek 3 Jun 28, 2021
eoplatform is a Python package that aims to simplify Remote Sensing Earth Observation by providing actionable information on a wide swath of RS platforms and provide a simple API for downloading and visualizing RS imagery

An Earth Observation Platform Earth Observation made easy. Report Bug | Request Feature About eoplatform is a Python package that aims to simplify Rem

Matthew Tralka 4 Aug 11, 2022
a robust room presence solution for home automation with nearly no false negatives

Argos Room Presence This project builds a room presence solution on top of Argos. Using just a cheap raspberry pi zero w (plus an attached pi camera,

Angad Singh 46 Sep 18, 2022
Make your BSC transaction simple.

bsc_trade_history Make your BSC transaction simple. 中文ReadMe Background: inspired by debank ,Practice my hands on this small project Blog:Crypto-BscTr

foolisheddy 7 Jul 06, 2022
A dashboard built using Plotly-Dash for interactive visualization of Dex-connected individuals across the country.

Dashboard For The DexConnect Platform of Dexterity Global Working prototype submission for internship at Dexterity Global Group. Dashboard for real ti

Yashasvi Misra 2 Jun 15, 2021
Farhad Davaripour, Ph.D. 1 Jan 05, 2022
Insert SVGs into matplotlib

Insert SVGs into matplotlib

Andrew White 35 Dec 29, 2022
Plot toolbox based on Matplotlib, simple and elegant.

Elegant-Plot Plot toolbox based on Matplotlib, simple and elegant. 绘制效果 绘制过程 数据准备 每种图标类型的目录下有data.csv文件,依据样例数据填入自己的数据。

3 Jul 15, 2022
Visualization of hidden layer activations of small multilayer perceptrons (MLPs)

MLP Hidden Layer Activation Visualization To gain some intuition about the internal representation of simple multi-layer perceptrons (MLPs) I trained

Andreas Köpf 7 Dec 30, 2022
BrowZen correlates your emotional states with the web sites you visit to give you actionable insights about how you spend your time browsing the web.

BrowZen BrowZen correlates your emotional states with the web sites you visit to give you actionable insights about how you spend your time browsing t

Nick Bild 36 Sep 28, 2022