cqMore is a CadQuery plugin based on CadQuery 2.1.

Overview

cqMore (under construction)

cqMore is a CadQuery plugin based on CadQuery 2.1.

cqMore

Installation

Please use conda to install CadQuery and its dependencies (see Getting started of CadQuery). Then, use conda to install git if you don't have it:

conda install git

To install cqMore directly from GitHub, run the following pip command:

pip install git+git://github.com/JustinSDK/cqMore.git

Introduction

You may simply use cqMore.Workplane to replace cadquery.Workplane. For example:

from cqMore import Workplane

result = (Workplane()
            .rect(10, 10)
            .makePolygon(((-2, -2), (2, -2), (2, 2), (-2, 2)))
            .extrude(1)
         )

You may also attach methods of cqMore.Workplane to cadquery.Workplane, such as:

from cadquery import Workplane
import cqMore
cqMore.extend(Workplane)

result = (Workplane()
            .rect(10, 10)
            .makePolygon(((-2, -2), (2, -2), (2, 2), (-2, 2)))
            .extrude(1)
        )

API Reference

You might also like...
The Metabolomics Integrator (MINT) is a post-processing tool for liquid chromatography-mass spectrometry (LCMS) based metabolomics.

MINT (Metabolomics Integrator) The Metabolomics Integrator (MINT) is a post-processing tool for liquid chromatography-mass spectrometry (LCMS) based m

MPL Plotter is a Matplotlib based Python plotting library built with the goal of delivering publication-quality plots concisely.

MPL Plotter is a Matplotlib based Python plotting library built with the goal of delivering publication-quality plots concisely.

A python script editor for napari based on PyQode.

napari-script-editor A python script editor for napari based on PyQode. This napari plugin was generated with Cookiecutter using with @napari's cookie

Custom Plotly Dash components based on Mantine React Components library

Dash Mantine Components Dash Mantine Components is a Dash component library based on Mantine React Components Library. It makes it easier to create go

A Python-based non-fungible token (NFT) generator built using Samilla and Matplotlib

PyNFT A Pythonic NF (non-fungible token) generator built using Samilla and Matplotlib Use python pynft.py [amount] The intention behind this generato

Fast visualization of radar_scenes based on oleschum/radar_scenes

RadarScenes Tools About This python package provides fast visualization for the RadarScenes dataset. The Open GL based visualizer is smoother than ole

Plot-configurations for scientific publications, purely based on matplotlib

TUEplots Plot-configurations for scientific publications, purely based on matplotlib. Usage Please have a look at the examples in the example/ directo

A simple agent-based model used to teach the basics of OOP in my lectures

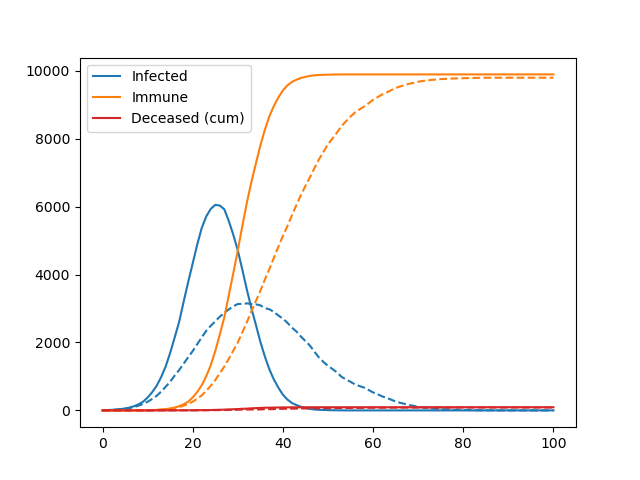
Pydemic A simple agent-based model of a pandemic. This is used to teach basic principles of object-oriented programming to master students. It is not

Streamlit-template - A streamlit app template based on streamlit-option-menu

streamlit-template A streamlit app template for geospatial applications based on

Releases(v1.0)
Owner
Justin Lin
"It's all a game of construction — some with a brush, some with a shovel, some choose a pen." - Jackson Pollock …and some, including myself, choose code.
Justin Lin
Keir&'s Visualizing Data on Life Expectancy

Keir's Visualizing Data on Life Expectancy Below is information on life expectancy in the United States from 1900-2017. You will also find information

9 Jun 06, 2022
A high-level plotting API for pandas, dask, xarray, and networkx built on HoloViews

hvPlot A high-level plotting API for the PyData ecosystem built on HoloViews. Build Status Coverage Latest dev release Latest release Docs What is it?

HoloViz 697 Jan 06, 2023
Data aggregated from the reports found at the MCPS COVID Dashboard into a set of visualizations.

Montgomery County Public Schools COVID-19 Visualizer Contents About this project Data Support this project About this project Data All data we use can

James 3 Jan 19, 2022
A napari plugin for visualising and interacting with electron cryotomograms.

napari-tomoslice A napari plugin for visualising and interacting with electron cryotomograms. Installation You can install napari-tomoslice via pip: p

3 Jan 03, 2023
High-level geospatial data visualization library for Python.

geoplot: geospatial data visualization geoplot is a high-level Python geospatial plotting library. It's an extension to cartopy and matplotlib which m

Aleksey Bilogur 1k Jan 01, 2023
Browse Dash docsets inside emacs

Helm Dash What's it This package uses Dash docsets inside emacs to browse documentation. Here's an article explaining the basic usage of it. It doesn'

504 Dec 15, 2022
A high-level plotting API for pandas, dask, xarray, and networkx built on HoloViews

hvPlot A high-level plotting API for the PyData ecosystem built on HoloViews. Build Status Coverage Latest dev release Latest release Docs What is it?

HoloViz 694 Jan 04, 2023
A curated list of awesome Dash (plotly) resources

Awesome Dash A curated list of awesome Dash (plotly) resources Dash is a productive Python framework for building web applications. Written on top of

Luke Singham 1.7k Jan 07, 2023
Peloton Stats to Google Sheets with Data Visualization through Seaborn and Plotly

Peloton Stats to Google Sheets with Data Visualization through Seaborn and Plotly Problem: 2 peloton users were looking for a way to track their metri

9 Jul 22, 2022
Visualization ideas for data science

Nuance I use Nuance to curate varied visualization thoughts during my data scientist career. It is not yet a package but a list of small ideas. Welcom

Li Jiangchun 16 Nov 03, 2022
Sprint planner considering JIRA issues and google calendar meetings schedule.

Sprint planner Sprint planner is a Python script for planning your Jira tasks based on your calendar availability. Installation Use the package manage

Apptension 2 Dec 05, 2021
Plot-configurations for scientific publications, purely based on matplotlib

TUEplots Plot-configurations for scientific publications, purely based on matplotlib. Usage Please have a look at the examples in the example/ directo

Nicholas Krämer 487 Jan 08, 2023
Fast scatter density plots for Matplotlib

About Plotting millions of points can be slow. Real slow... 😴 So why not use density maps? ⚡ The mpl-scatter-density mini-package provides functional

Thomas Robitaille 473 Dec 12, 2022
nvitop, an interactive NVIDIA-GPU process viewer, the one-stop solution for GPU process management

An interactive NVIDIA-GPU process viewer, the one-stop solution for GPU process management.

Xuehai Pan 1.3k Jan 02, 2023
Visualization Library

CamViz Overview // Installation // Demos // License Overview CamViz is a visualization library developed by the TRI-ML team with the goal of providing

Toyota Research Institute - Machine Learning 67 Nov 24, 2022
:small_red_triangle: Ternary plotting library for python with matplotlib

python-ternary This is a plotting library for use with matplotlib to make ternary plots plots in the two dimensional simplex projected onto a two dime

Marc 611 Dec 29, 2022
A toolkit to generate MR sequence diagrams

mrsd: a toolkit to generate MR sequence diagrams mrsd is a Python toolkit to generate MR sequence diagrams, as shown below for the basic FLASH sequenc

Julien Lamy 3 Dec 25, 2021
Colormaps for astronomers

cmastro: colormaps for astronomers 🔭 This package contains custom colormaps that have been used in various astronomical applications, similar to cmoc

Adrian Price-Whelan 12 Oct 11, 2022
Data Visualization Guide for Presentations, Reports, and Dashboards

This is a highly practical and example-based guide on visually representing data in reports and dashboards.

Anton Zhiyanov 395 Dec 29, 2022
A tool to plot and execute Rossmos's Formula, that helps to catch serial criminals using mathematics

Rossmo Plotter A tool to plot and execute Rossmos's Formula using python, that helps to catch serial criminals using mathematics Author: Amlan Saha Ku

Amlan Saha Kundu 3 Aug 29, 2022