Create 3d loss surface visualizations, with optimizer path. Issues welcome!

Overview

MLVTK PyPI - Python Version PyPI

A loss surface visualization tool

Png

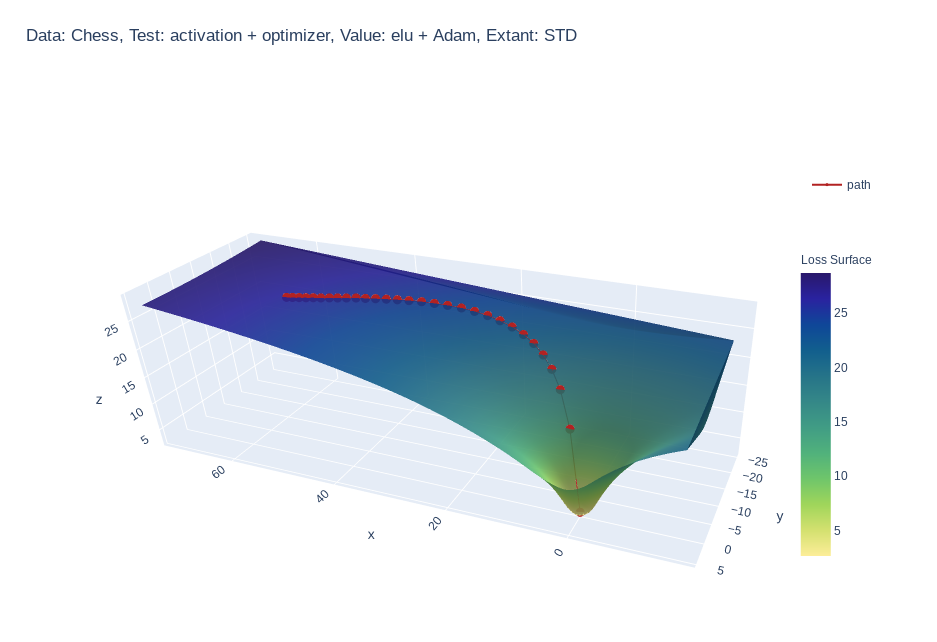
Simple feed-forward network trained on chess data, using elu activation and Adam optimizer


Gif

Simple feed-forward network trained on chess data, using tanh activation and SGD optimizer


Gif

3 layer feed-forward network trained on hand written letters data, using relu activation, SGD optimizer and learning rate of 2.0. Example of what happens to path when learning rate is too high


Gif

Simple feed-forward network trained on chess data, using hard-sigmoid activation and RMSprop optimizer

Why?

  • :shipit: Simple: A single line addition is all that is needed.
  • Informative: Gain insight into what your model is seeing.
  • 📓 Educational: See how your hyper parameters and architecture impact your models perception.

Quick Start

Requires version
python >= 3.6.1
tensorflow >= 2.3.1
plotly >=4.9.0

Install locally (Also works in google Colab!):

pip install mlvtk

Optionally for use with jupyter notebook/lab:

Notebook

=5.3" "ipywidgets==7.5"">
pip install "notebook>=5.3" "ipywidgets==7.5"

Lab

pip install jupyterlab "ipywidgets==7.5"

# Basic JupyterLab renderer support
jupyter labextension install [email protected]

# OPTIONAL: Jupyter widgets extension for FigureWidget support
jupyter labextension install @jupyter-widgets/jupyterlab-manager [email protected]

Basic Example

from mlvtk.base import Vmodel
import tensorflow as tf
import numpy as np

# NN with 1 hidden layer
inputs = tf.keras.layers.Input(shape=(None,100))
dense_1 = tf.keras.layers.Dense(50, activation='relu')(inputs)
outputs = tf.keras.layers.Dense(10, activation='softmax')(dense_1)
_model = tf.keras.Model(inputs, outputs)

# Wrap with Vmodel
model = Vmodel(_model)
model.compile(optimizer=tf.keras.optimizers.SGD(),
loss=tf.keras.losses.CategoricalCrossentropy(), metrics=['accuracy'])

# All tf.keras.(Model/Sequential/Functional) methods/properties are accessible
# from Vmodel

model.summary()
model.get_config()
model.get_weights()
model.layers

# Create random example data
x = np.random.rand(3, 10, 100)
y = np.random.randint(9, size=(3, 10, 10))
xval = np.random.rand(1, 10, 100)
yval = np.random.randint(9, size=(1,10,10))

# Only difference, model.fit requires validation_data (tf.data.Dataset, or
# other container
history = model.fit(x, y, validation_data=(xval, yval), epochs=10, verbose=0)

# Calling model.surface_plot() returns a plotly.graph_objs.Figure
# model.surface_plot() will attempt to display the figure inline

fig = model.surface_plot()

# fig can save an interactive plot to an html file,
fig.write_html("surface_plot.html")

# or display the plot in jupyter notebook/lab or other compatible tool.
fig.show()
Owner
Research analyst
Here are my graphs for hw_02

Let's Have A Look At Some Graphs! Graph 1: State Mentions in Congressperson's Tweets on 10/01/2017 The graph below uses this data set to demonstrate h

7 Sep 02, 2022
python partial dependence plot toolbox

PDPbox python partial dependence plot toolbox Motivation This repository is inspired by ICEbox. The goal is to visualize the impact of certain feature

Li Jiangchun 723 Jan 07, 2023
Flipper Zero documentation repo

Flipper Zero Docs Participation To fix a bug or add something new to this repository, you need to open a pull-request. Also, on every page of the site

Flipper Zero (All Repositories will be public soon) 114 Dec 30, 2022
A minimalistic wrapper around PyOpenGL to save development time

glpy glpy is pyOpenGl wrapper which lets you work with pyOpenGl easily.It is not meant to be a replacement for pyOpenGl but runs on top of pyOpenGl to

Abhinav 9 Apr 02, 2022
📊📈 Serves up Pandas dataframes via the Django REST Framework for use in client-side (i.e. d3.js) visualizations and offline analysis (e.g. Excel)

📊📈 Serves up Pandas dataframes via the Django REST Framework for use in client-side (i.e. d3.js) visualizations and offline analysis (e.g. Excel)

wq framework 1.2k Jan 01, 2023
Draw datasets from within Jupyter.

drawdata This small python app allows you to draw a dataset in a jupyter notebook. This should be very useful when teaching machine learning algorithm

vincent d warmerdam 505 Nov 27, 2022
An open-source plotting library for statistical data.

Lets-Plot Lets-Plot is an open-source plotting library for statistical data. It is implemented using the Kotlin programming language. The design of Le

JetBrains 820 Jan 06, 2023
Lumen provides a framework for visual analytics, which allows users to build data-driven dashboards from a simple yaml specification

Lumen project provides a framework for visual analytics, which allows users to build data-driven dashboards from a simple yaml specification

HoloViz 120 Jan 04, 2023
Plotting data from the landroid and a raspberry pi zero to a influx-db

landroid-pi-influx Plotting data from the landroid and a raspberry pi zero to a influx-db Dependancies Hardware: Landroid WR130E Raspberry Pi Zero Wif

2 Oct 22, 2021
The plottify package is makes matplotlib plots more legible

plottify The plottify package is makes matplotlib plots more legible. It's a thin wrapper around matplotlib that automatically adjusts font sizes, sca

Andy Jones 97 Nov 04, 2022
基于python爬虫爬取COVID-19爆发开始至今全球疫情数据并利用Echarts对数据进行分析与多样化展示。

COVID-19-Epidemic-Map 基于python爬虫爬取COVID-19爆发开始至今全球疫情数据并利用Echarts对数据进行分析与多样化展示。 觉得项目还不错的话欢迎给一个star! 项目的源码可以正常运行,各个库的版本、数据库的建表语句、运行过程中遇到的坑以及解决方式在笔记.md中都

31 Dec 15, 2022
A simple agent-based model used to teach the basics of OOP in my lectures

Pydemic A simple agent-based model of a pandemic. This is used to teach basic principles of object-oriented programming to master students. It is not

Fabien Maussion 2 Jun 08, 2022
Visual Python is a GUI-based Python code generator, developed on the Jupyter Notebook environment as an extension.

Visual Python is a GUI-based Python code generator, developed on the Jupyter Notebook environment as an extension.

Visual Python 564 Jan 03, 2023
An interactive GUI for WhiteboxTools in a Jupyter-based environment

whiteboxgui An interactive GUI for WhiteboxTools in a Jupyter-based environment GitHub repo: https://github.com/giswqs/whiteboxgui Documentation: http

Qiusheng Wu 105 Dec 15, 2022
Make scripted visualizations in blender

Scripted visualizations in blender The goal of this project is to script 3D scientific visualizations using blender. To achieve this, we aim to bring

Praneeth Namburi 10 Jun 01, 2022
An automatic prover for tautologies in Metamath

completeness An automatic prover for tautologies in Metamath This program implements the constructive proof of the Completeness Theorem for propositio

Scott Fenton 2 Dec 15, 2021
Domain Connectivity Analysis Tools to analyze aggregate connectivity patterns across a set of domains during security investigations

DomainCAT (Domain Connectivity Analysis Tool) Domain Connectivity Analysis Tool is used to analyze aggregate connectivity patterns across a set of dom

DomainTools 34 Dec 09, 2022
Visualization Website by using Dash and Heroku

Visualization Website by using Dash and Heroku You can visit the website https://payroll-expense-analysis.herokuapp.com/ In this project, I am interes

YF Liu 1 Jan 14, 2022
Curvipy - The Python package for visualizing curves and linear transformations in a super simple way

Curvipy - The Python package for visualizing curves and linear transformations in a super simple way

Dylan Tintenfich 55 Dec 28, 2022
ipyvizzu - Jupyter notebook integration of Vizzu

ipyvizzu - Jupyter notebook integration of Vizzu. Tutorial · Examples · Repository About The Project ipyvizzu is the Jupyter Notebook integration of V

Vizzu 729 Jan 08, 2023