Declarative statistical visualization library for Python

Overview

Altair

build status github actions code style black JOSS Paper PyPI - Downloads Binder Colab

http://altair-viz.github.io

Altair is a declarative statistical visualization library for Python. With Altair, you can spend more time understanding your data and its meaning. Altair's API is simple, friendly and consistent and built on top of the powerful Vega-Lite JSON specification. This elegant simplicity produces beautiful and effective visualizations with a minimal amount of code. Altair is developed by Jake Vanderplas and Brian Granger in close collaboration with the UW Interactive Data Lab.

Altair Documentation

See Altair's Documentation Site, as well as Altair's Tutorial Notebooks.

Example

Here is an example using Altair to quickly visualize and display a dataset with the native Vega-Lite renderer in the JupyterLab:

import altair as alt

# load a simple dataset as a pandas DataFrame
from vega_datasets import data
cars = data.cars()

alt.Chart(cars).mark_point().encode(
    x='Horsepower',
    y='Miles_per_Gallon',
    color='Origin',
)

Altair Visualization

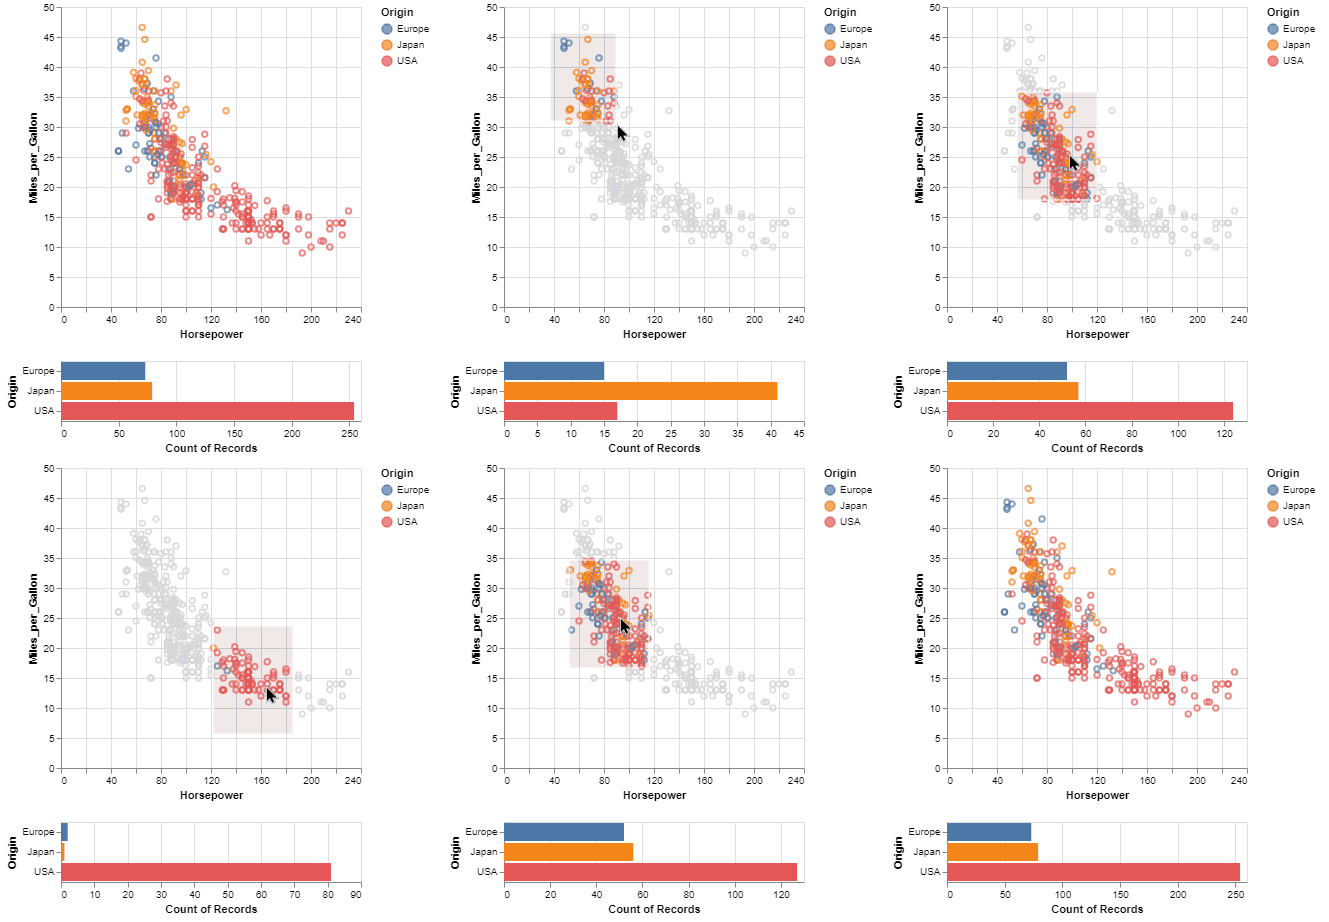
One of the unique features of Altair, inherited from Vega-Lite, is a declarative grammar of not just visualization, but interaction. With a few modifications to the example above we can create a linked histogram that is filtered based on a selection of the scatter plot.

import altair as alt
from vega_datasets import data

source = data.cars()

brush = alt.selection(type='interval')

points = alt.Chart(source).mark_point().encode(
    x='Horsepower',
    y='Miles_per_Gallon',
    color=alt.condition(brush, 'Origin', alt.value('lightgray'))
).add_selection(
    brush
)

bars = alt.Chart(source).mark_bar().encode(
    y='Origin',
    color='Origin',
    x='count(Origin)'
).transform_filter(
    brush
)

points & bars

Altair Visualization Gif

Getting your Questions Answered

If you have a question that is not addressed in the documentation, there are several ways to ask:

We'll do our best to get your question answered

A Python API for statistical visualizations

Altair provides a Python API for building statistical visualizations in a declarative manner. By statistical visualization we mean:

  • The data source is a DataFrame that consists of columns of different data types (quantitative, ordinal, nominal and date/time).
  • The DataFrame is in a tidy format where the rows correspond to samples and the columns correspond to the observed variables.
  • The data is mapped to the visual properties (position, color, size, shape, faceting, etc.) using the group-by data transformation.

The Altair API contains no actual visualization rendering code but instead emits JSON data structures following the Vega-Lite specification. The resulting Vega-Lite JSON data can be rendered in the following user-interfaces:

Features

  • Carefully-designed, declarative Python API based on traitlets.
  • Auto-generated internal Python API that guarantees visualizations are type-checked and in full conformance with the Vega-Lite specification.
  • Auto-generate Altair Python code from a Vega-Lite JSON spec.
  • Display visualizations in the live Jupyter Notebook, JupyterLab, nteract, on GitHub and nbviewer.
  • Export visualizations to PNG/SVG images, stand-alone HTML pages and the Online Vega-Lite Editor.
  • Serialize visualizations as JSON files.
  • Explore Altair with dozens of examples in the Example Gallery

Installation

To use Altair for visualization, you need to install two sets of tools

  1. The core Altair Package and its dependencies

  2. The renderer for the frontend you wish to use (i.e. Jupyter Notebook, JupyterLab, or nteract)

Altair can be installed with either pip or with conda. For full installation instructions, please see https://altair-viz.github.io/getting_started/installation.html

Example and tutorial notebooks

We maintain a separate Github repository of Jupyter Notebooks that contain an interactive tutorial and examples:

https://github.com/altair-viz/altair_notebooks

To launch a live notebook server with those notebook using binder or Colab, click on one of the following badges:

Binder Colab

Project philosophy

Many excellent plotting libraries exist in Python, including the main ones:

Each library does a particular set of things well.

User challenges

However, such a proliferation of options creates great difficulty for users as they have to wade through all of these APIs to find which of them is the best for the task at hand. None of these libraries are optimized for high-level statistical visualization, so users have to assemble their own using a mishmash of APIs. For individuals just learning data science, this forces them to focus on learning APIs rather than exploring their data.

Another challenge is current plotting APIs require the user to write code, even for incidental details of a visualization. This results in an unfortunate and unnecessary cognitive burden as the visualization type (histogram, scatterplot, etc.) can often be inferred using basic information such as the columns of interest and the data types of those columns.

For example, if you are interested in the visualization of two numerical columns, a scatterplot is almost certainly a good starting point. If you add a categorical column to that, you probably want to encode that column using colors or facets. If inferring the visualization proves difficult at times, a simple user interface can construct a visualization without any coding. Tableau and the Interactive Data Lab's Polestar and Voyager are excellent examples of such UIs.

Design approach and solution

We believe that these challenges can be addressed without the creation of yet another visualization library that has a programmatic API and built-in rendering. Altair's approach to building visualizations uses a layered design that leverages the full capabilities of existing visualization libraries:

  1. Create a constrained, simple Python API (Altair) that is purely declarative
  2. Use the API (Altair) to emit JSON output that follows the Vega-Lite spec
  3. Render that spec using existing visualization libraries

This approach enables users to perform exploratory visualizations with a much simpler API initially, pick an appropriate renderer for their usage case, and then leverage the full capabilities of that renderer for more advanced plot customization.

We realize that a declarative API will necessarily be limited compared to the full programmatic APIs of Matplotlib, Bokeh, etc. That is a deliberate design choice we feel is needed to simplify the user experience of exploratory visualization.

Development install

Altair requires the following dependencies:

If you have cloned the repository, run the following command from the root of the repository:

pip install -e .[dev]

If you do not wish to clone the repository, you can install using:

pip install git+https://github.com/altair-viz/altair

Testing

To run the test suite you must have py.test installed. To run the tests, use

py.test --pyargs altair

(you can omit the --pyargs flag if you are running the tests from a source checkout).

Feedback and Contribution

See CONTRIBUTING.md

Citing Altair

JOSS Paper

If you use Altair in academic work, please consider citing http://joss.theoj.org/papers/10.21105/joss.01057 as

@article{VanderPlas2018,
    doi = {10.21105/joss.01057},
    url = {https://doi.org/10.21105/joss.01057},
    year = {2018},
    publisher = {The Open Journal},
    volume = {3},
    number = {32},
    pages = {1057},
    author = {Jacob VanderPlas and Brian Granger and Jeffrey Heer and Dominik Moritz and Kanit Wongsuphasawat and Arvind Satyanarayan and Eitan Lees and Ilia Timofeev and Ben Welsh and Scott Sievert},
    title = {Altair: Interactive Statistical Visualizations for Python},
    journal = {Journal of Open Source Software}
}

Please additionally consider citing the vega-lite project, which Altair is based on: https://dl.acm.org/doi/10.1109/TVCG.2016.2599030

@article{Satyanarayan2017,
    author={Satyanarayan, Arvind and Moritz, Dominik and Wongsuphasawat, Kanit and Heer, Jeffrey},
    title={Vega-Lite: A Grammar of Interactive Graphics},
    journal={IEEE transactions on visualization and computer graphics},
    year={2017},
    volume={23},
    number={1},
    pages={341-350},
    publisher={IEEE}
} 

Whence Altair?

Altair is the brightest star in the constellation Aquila, and along with Deneb and Vega forms the northern-hemisphere asterism known as the Summer Triangle.

Comments
  • WIP: update to Vega-Lite 5.2

    WIP: update to Vega-Lite 5.2

    The code here is pretty similar to #2517, but I wanted to redo some things and it seemed easiest to start with a new pull request. Also the conversation on the other one was getting pretty long.

    Main changes from #2517:

    • In the previous version, an expression like size_var + 3 created an Expression, but now it creates a Parameter. That is the only major change.
    • As briefly discussed in the other PR, selection_point etc now create the entire Parameter.

    Main changes overall (from the master branch):

    • Include a vegalite/v5 folder with schema 5.2.0. The first commit is just a duplication of the vegalite/v4 folder. I hope that makes it easier to tell what changes were made.
    • Move height/width/view from inner charts to the parent chart for LayerChart.
    • Introduce parameters. Here are some examples (please ignore the course notes!).
    • Moved most code out of Expression and into a new class called OperatorMixin. The goal is to use the same code for both something like expr + 3 (which should produce an Expression) and something like size_var + 3 (which should produce a Parameter). I'm really not sure if the way I accomplished this is natural or not.
    • Added a fair amount of ad hoc code to keep the old selection syntax mostly working. I added many warnings.warn(message, DeprecationWarning), but they seem to all be hidden by default, so I have never successfully seen one of these messages displayed. The code would be a little cleaner if we didn't try to keep this old syntax.

    If you see something that could be improved, please let me know, because I'm happy to learn about more efficient ways of doing things.

    To do:

    • When we are happy with the general syntax, I can write some documentation for parameters and add some examples. I also think it would be good to see if some old examples can be simplified. For example, this US population over time I think is more naturally made with a variable parameter as opposed to a selection parameter.
    • Decide how forcefully we want to stop users from using the old selection syntax. My warnings.warn approach seems worthless at the moment since the messages don't get displayed by default.
    • The only example that is raising an error is scatter plot with minimap. It is failing because it provides an explicit dictionary using the keyword selection, which in the new schema should be param. I think it's not worth the effort of writing code to try to make this example compile, and we should rewrite that example (only two words need to be changed).
    • The other tests that I know of which are failing are some render examples (I haven't looked at those at all, nor have I updated Altair Saver) and test_spec_to_vegalite_mimebundle.

    Thanks for any comments/requests!

    opened by ChristopherDavisUCI 66
  • WIP: update to Vega-Lite 5

    WIP: update to Vega-Lite 5

    (Draft version only!)

    Surprisingly the biggest obstacle so far hasn't been params but a change to layer. I think in the newest Vega-Lite schema, charts in a layer are not allowed to specify height or width, which seems to break many Altair examples. Here is a minimal example that doesn't work:

    no_data = pd.DataFrame()
    
    c = alt.Chart(no_data).mark_circle().properties(
        width=100
    )
    
    c+c
    

    I don't see a good way to deal with that. Do you have a suggestion?

    I've read the list of "breaking changes" for the Vega-Lite 5.0.0 release and don't see anything that seems related to this, so it does make me wonder if maybe I misunderstand the cause of the problem.

    Other things:

    • I usually try some tests by running things in Jupyter notebook, but since making the change to Vega-Lite 5 that hasn't worked for me. Instead I get the following message in red the first time I try to display a chart, and then subsequent times I just get a blank response: Error loading script: Script error for "vega-util", needed by: vega-lite http://requirejs.org/docs/errors.html#scripterror It does work in Jupyter Lab.
    • Some of the code changes have been experiments trying to learn how the old selection fits with the new parameter. It might be best to redo this code later now that I see more of the big picture.
    opened by ChristopherDavisUCI 65
  • Update to Vega-Lite 4.17.0

    Update to Vega-Lite 4.17.0

    Hi again,

    @mattijn and I have tried to update the Pull Request from last week, taking into account your suggestions and trying to get all the tests (that I know about) to work.

    Here are some of the main changes from the current Altair release:

    • Changed the Vega-Lite schema version to 4.17.0.
    • Added definitions of DatumSchemaGenerator and DatumChannelMixin in generate_schema_wrapper.py.
    • Updated the loop in generate_vegalite_channel_wrappers here to allow for the possibility of a datum.
    • Updated infer_encoding_types from altair/utils/core.py here to recognize Datum class names.
    • Changed get_valid_identifier in tools/schemapi/utils.py to deal with some symbols like [] appearing in certain names in the Vega-Lite schema. (Removing those symbols led to some duplicated class names.)
    • Updated TopLevelMixin from altair/vegalite/v4/api.py to allow for layer to be repeated, in addition to row and column.
    • Updated the Encoding Channel Options part of the docs here. (I wasn't sure if there was a way to auto-generate these groupings of for example Row with Column with Facet.)
    • Added some examples to the example gallery here and some additional documentation about mark_arc and layering in repeat here.
    • Applied a temporary fix and linked Vega-Lite issue to get test_vegalite_to_vega_mimebundle to work here.

    Main outstanding issue that we know of:

    • Starting with v4.9, the format of TopLevelRepeatSpec changed in the Vega-Lite schema. We have some code to deal with this by editing the definition of TopLevelRepeatSpec in the downloaded JSON file. We've tried asking on the Vega-Lite Slack channel and as a Vega-Lite GitHub issue, but it seems like the issue is on the Altair side, not the Vega-Lite side. If the rest of the changes seem mostly in good shape, I can focus on finding a more adequate solution.

    This is not part of the current Pull Request, but to get some of the tests to work, we made the following changes to altair_viewer:

    • Save https://unpkg.com/[email protected]/build/vega-lite.min.js as vega-lite-4.17.0.js in altair_viewer\altair_viewer\scripts
    • Add "4.17.0" in listing.json in altair_viewer\scripts

    Thank you for any feedback!

    opened by ChristopherDavisUCI 62
  • Altair Hackathon?

    Altair Hackathon?

    New to Altair, but enthusiastic. I'd like to propose the idea of an Altair Hackathon. I don't know the community well enough to organize it. But I imagine a day or weekend spending a large portion of the time developing more examples, and blog posts, along with the usual code base development and issue queue resolution. The API documentation is very concise, and more examples would help grow the user base.

    A Google search for:

    how to put on a hackathon
    

    yields some promising guides.

    opened by mroswell 54
  • Version 4.2 release candidate?

    Version 4.2 release candidate?

    Let's get a version 4.2 release candidate together!

    In the past, I always just directly created new releases, but it seems Altair has become pretty popular – https://pypistats.org/packages/altair shows nearly 150,000 daily downloads (yikes!) so doing the release candidate route is probably warranted now.

    I think we're in pretty good shape right now on the master branch, but I wanted to check to see if there's anything I'm not thinking of. cc/ folks who have been most active recently: @joelostblom @mattijn @ChristopherDavisUCI

    Have you had a chance to kick the tires with the VL 4.17 features landed this week? Anything you think we should address before a new release?

    enhancement 
    opened by jakevdp 42
  • Improve mark type sections

    Improve mark type sections

    This PR addresses the points raised by @joelostblom in #2607 and #2578 (the later can be closed after this PR). In addition, I went through all mark pages to fix any bugs or vega-lite specific parts I could find. I think the pages are now in pretty good shape but it would certainly be nice if someone else can take a thorough look as well. CC @mattijn in case you want to take a look as well.

    I have not yet included the sections with the interactive sliders from the vega-lite documentation. Still need to figure out how to best accomplish this. I'll try the suggestions from comment 4 in #2578 and add it to this PR later on or then in a new one.

    You can view the updated documentation at https://binste.github.io/altair-docs/ with the exception of the charts in the geoshape section as I did not have geopandas installed. As a sidenote, where would be a good place to add a note that this is now necessary to build the documentation? Maybe we should add it in requirements_dev.txt so it is also included in the docbuild workflow?

    opened by binste 40
  • WIP: Lifting parameters to the top level

    WIP: Lifting parameters to the top level

    Updated version of https://github.com/altair-viz/altair/pull/2671. I believe the functionality is the same, but the code is a little cleaner. @mattijn As always I am happy for any comments!

    Here was the description of https://github.com/altair-viz/altair/pull/2671:

    This is a draft version (some tests are currently failing) of the strategy suggested by @arvind and @mattijn here for dealing with parameters in multi-view Altair charts. We lift all parameters to the top level. In the case of selection parameters, we give the parameter a "views" property to indicate where the selections should be happening.

    opened by ChristopherDavisUCI 40
  • MaxRowsError for pandas.df with > 5000 rows

    MaxRowsError for pandas.df with > 5000 rows

    Hey,

    Thanks for the package, I'm very keen to try it out on my own data. When trying to create a simple histogram with my own data, VegaLite fails on dataframes with more than 5000 rows. Here's a minimal reproducible example:

    import altair as alt
    import os
    import pandas as pd
    import numpy as np
    
    lengths = np.random.randint(0,2000,6000)
    lengths_list = lengths.tolist()
    labels = [str(i) for i in lengths_list]
    peak_lengths = pd.DataFrame.from_dict({'coords': labels, 'length': lengths_list},orient='columns')
    alt.Chart(peak_lengths).mark_bar().encode(alt.X('lengths:Q', bin=True),y='count(*):Q')
    

    Here's the error:

    ---------------------------------------------------------------------------
    MaxRowsError                              Traceback (most recent call last)
    ~/anaconda/envs/py3/lib/python3.5/site-packages/altair/vegalite/v2/api.py in to_dict(self, *args, **kwargs)
        259         copy = self.copy()
        260         original_data = getattr(copy, 'data', Undefined)
    --> 261         copy._prepare_data()
        262 
        263         # We make use of two context markers:
    
    ~/anaconda/envs/py3/lib/python3.5/site-packages/altair/vegalite/v2/api.py in _prepare_data(self)
        251             pass
        252         elif isinstance(self.data, pd.DataFrame):
    --> 253             self.data = pipe(self.data, data_transformers.get())
        254         elif isinstance(self.data, six.string_types):
        255             self.data = core.UrlData(self.data)
    
    ~/anaconda/envs/py3/lib/python3.5/site-packages/toolz/functoolz.py in pipe(data, *funcs)
        550     """
        551     for func in funcs:
    --> 552         data = func(data)
        553     return data
        554 
    
    ~/anaconda/envs/py3/lib/python3.5/site-packages/toolz/functoolz.py in __call__(self, *args, **kwargs)
        281     def __call__(self, *args, **kwargs):
        282         try:
    --> 283             return self._partial(*args, **kwargs)
        284         except TypeError as exc:
        285             if self._should_curry(args, kwargs, exc):
    
    ~/anaconda/envs/py3/lib/python3.5/site-packages/altair/vegalite/data.py in default_data_transformer(data)
        122 @curry
        123 def default_data_transformer(data):
    --> 124     return pipe(data, limit_rows, to_values)
        125 
        126 
    
    ~/anaconda/envs/py3/lib/python3.5/site-packages/toolz/functoolz.py in pipe(data, *funcs)
        550     """
        551     for func in funcs:
    --> 552         data = func(data)
        553     return data
        554 
    
    ~/anaconda/envs/py3/lib/python3.5/site-packages/toolz/functoolz.py in __call__(self, *args, **kwargs)
        281     def __call__(self, *args, **kwargs):
        282         try:
    --> 283             return self._partial(*args, **kwargs)
        284         except TypeError as exc:
        285             if self._should_curry(args, kwargs, exc):
    
    ~/anaconda/envs/py3/lib/python3.5/site-packages/altair/vegalite/data.py in limit_rows(data, max_rows)
         47             return data
         48     if len(values) > max_rows:
    ---> 49         raise MaxRowsError('The number of rows in your dataset is greater than the max of {}'.format(max_rows))
         50     return data
         51 
    
    MaxRowsError: The number of rows in your dataset is greater than the max of 5000
    

    A quick issues search didn't turn up any hits for MaxRowsError. There is a related issue (#287), but this was a data set with > 300k rows, and I have a measly 35k. Also, the FAQ link referenced in that issue now turns up a 404. For the meantime, does the advice in #249 still apply?

    Package info: Running on Altair 2.0.0rc1, JupyterLab 0.31.12-py35_1 conda-forge

    bug 
    opened by lzamparo 39
  • Example Visualizations

    Example Visualizations

    In preparation for the Altair 2.0 release, we need some good example visualizations for the documentation! These could be everything from simple one-panel scatter and line plots, to more complicated layered or stacked plots, to more advanced interactive features.

    Note that the v2 API is not finalized yet, and so another purpose of creating these is to find bugs in the current package as we prepare for release. If you find anything, please report it on the issues tracker!

    I've started a folder for these examples in altair/vegalite/v2/examples/. You can treat simple_scatter.py as a template.

    Every example should:

    • have a descriptive docstring, which will eventually be extracted for the documentation website.
    • define a chart variable with the main chart object (This will be used both in the unit tests to confirm that the example executes properly, and also eventually used to display the visualization on the documentation website).
    • not make any external calls to download data within the script (i.e. don't use urllib). You can define your data directly within the example file, generate your data using pandas and numpy.random, or you can use data available in the vega_datasets package.

    The easiest way to get started would be to adapt examples from the Vega-Lite example gallery. Or you can feel free to be creative and build your own visualizations.

    Note that the new display architecture is still being built; for display troubleshooting please see the wiki page: https://github.com/altair-viz/altair/wiki/Display-Troubleshooting

    We'll look forward to your pull requests!

    help wanted 
    opened by jakevdp 36
  • Jupyter Notebook file size

    Jupyter Notebook file size

    Hi, first of all I really enjoy using altair. I find it really helpful for creating charts of aggregated statistics over different periods of a time-series. However, using it in Jupyter notebooks results in very large files (about 47MB in a notebook rendering only a single chart).

    I wonder if the cause of the issue is the size of the data frame I'm using as input - around 67,000 rows. (Note that the aggregation results in a simple bar chart with about 10 bars)

    Is there a way to limit the file size of a chart?

    Thanks!

    enhancement 
    opened by dyuval 34
  • API: should ``Layer()`` not derive from ``BaseObject``?

    API: should ``Layer()`` not derive from ``BaseObject``?

    Since Layer is the main interface, it would be nice if tab completion on the object only listed relevant pieces of the API so that you can quickly find what plot types are available (e.g. point(), bar(), text(), etc.)

    Currently, since it derives from BaseObject the namespace is polluted with all sorts of traitlet stuff that the user probably doesn't care about.

    I'd propose something like this:

    class LayerObject(BaseObject):
        # traitlet-related stuff goes here
        def __init__(self, *args, **kwargs):
            super(LayerObject, self).__init__(**kwargs)
    
        # etc.
    
    class Layer(object):
        # non-traitlet-related Layer methods here
        def __init__(self, *args, **kwargs):
            if len(args)==1:
                self.data = args[0]
            self._layerobject = LayerObject(**kwargs)
    
        def point(self):
            self.mark = 'point'
            return self
    
        # etc.
    

    The only problem would be if we ever want to pass Layer to some other class this would complicate things. What do you think?

    question 
    opened by jakevdp 34
  • Vega-lite JSON schema validation fails with uri-reference errors

    Vega-lite JSON schema validation fails with uri-reference errors

    Steps to reproduce:

    virtualenv venv &&
    cd venv &&
    bin/pip install altair rfc3986-validator &&
    bin/python <<EOF
    import altair as alt
    print(alt.Chart().mark_line().properties(usermeta={}).to_json())
    EOF
    

    With altair-4.2.0, the above fails with:

    Traceback (most recent call last):
      File "<stdin>", line 2, in <module>
      File "…/venv/lib/python3.10/site-packages/altair/vegalite/v4/api.py", line 588, in properties
        self.validate_property(key, val)
      File "…/venv/lib/python3.10/site-packages/altair/utils/schemapi.py", line 464, in validate_property
        return jsonschema.validate(value, props.get(name, {}), resolver=resolver)
      File "…/venv/lib/python3.10/site-packages/jsonschema/validators.py", line 1117, in validate
        cls.check_schema(schema)
      File "…/venv/lib/python3.10/site-packages/jsonschema/validators.py", line 231, in check_schema
        raise exceptions.SchemaError.create_from(error)
    jsonschema.exceptions.SchemaError: '#/definitions/Dict<unknown>' is not a 'uri-reference'
    
    Failed validating 'format' in metaschema['allOf'][0]['properties']['$ref']:
        {'format': 'uri-reference', 'type': 'string'}
    
    On schema['$ref']:
        '#/definitions/Dict<unknown>'
    

    But here's the twist: if you remove rfc3986-validator from the pip install command in the above repro, it works!

    As you can imagine this is a bit of an head-scratcher. Here's what's going on:

    jsonschema fails to validate the Vega-lite schema. To be clear, the problem is not the vega-lite output - it's the schema itself that's invalid, because it contains $ref values that are not valid uri-references. In the example above, the $ref is #/definitions/Dict<unknown> which is invalid because the < and > characters are not allowed in a RFC 3986 URI reference.

    Even though the schema is invalid, that goes unnoticed most of the time because jsonschema only validates uri-references if the rfc3986-validator or rfc3987 package is installed! This explains why Altair seems to work fine if these packages are missing.

    You may wonder how I ended up in this situation. Well this is where things gets a bit worrying, because I ended up triggering this latent bug simply by installing jupyter! This is because, a few months ago, jupyter_events (which jupyter depends on) added a dependency on jsonschema[format-nongpl] (see jupyter/[email protected]), which in turns pulls rfc3986-validator (figuring out that dependency chain was surprisingly hard - see pypa/pip#11683). Hilarity ensues, with the somewhat mind-blowing outcome that Altair is broken when a recent jupyter is also installed.

    One workaround is to uninstall rfc3986-validator right after installing the package that pulled it (e.g. jupyter):

    pip uninstall rfc3986-validator
    
    bug 
    opened by dechamps 3
  • Build and publish package and documentation with GitHub Actions

    Build and publish package and documentation with GitHub Actions

    This builds on the discussion which started in #2774.

    Currently, building and publishing a new Altair version is a manual process as outlined in RELEASING.md. It involves making sure that various version numbers are properly updated, that you have all dependencies installed locally, building and uploading source and wheel distributions, building and uploading the documentation, adjusting the changelog etc. I'd see the following advantages in using GitHub Action workflows for building and uploading the source and wheel distributions as welll as the documentation:

    • More reliable build process as it happens in a fresh environment ensuring that the relevant dependencies are installed
    • More secure as a local build environment might contain malware
    • Credentials can be shared among maintainers, reducing single-person dependency risk
    • Automation reduces risk of errors in general and speeds up the process. This would be helpful if we want to have more frequent releases, e.g. for inevitable bug fixes after the first 5.0 release

    After implementing it in the Altair repo, I'd suggest to also use similar workflows for the altair companion packages (altair_saver, altair_viewer, etc.) for the same reasons.

    Proposal for discussion

    To publish a new release, one would still update the version numbers as described in RELEASING.md and add a git tag, e.g. "v5.0.0". As soon as this is pushed to main, the following two new workflows would be executed. So the trigger is "any commit with a git tag starting with "v". As an alternative, these workflows could also be kicked off manually.

    The relevant credentials could be stored as GitHub Secrets and would be only available to Altair maintainers.

    The above process can of course be further automated such as automatically updating version numbers - some packages have much fancier workflows - but maybe it's good to start out simple.

    What do you think? Is this helpful? I'm happy to take this on and start a PR but I first wanted to get some input. Also, it requires that the credentials for Pypi are available and access credentials for the docs repo.

    enhancement 
    opened by binste 0
  • extract the test-files from the Altair folder into a specific test folder

    extract the test-files from the Altair folder into a specific test folder

    Currently all tests are within the Altair package. So once you install the package Altair you also will get all the test files since the test-suite is inclusive.

    It is good practice to store your tests outside the application code as is mentioned here: https://docs.pytest.org/en/7.1.x/explanation/goodpractices.html#tests-outside-application-code

    enhancement 
    opened by mattijn 0
  • Improve MaxRowsError

    Improve MaxRowsError

    Stack created with [Sapling]

    • -> #2783

    Improve MaxRowsError

    Summary:

    I've modified the error message to give a link to the docs and the command listed there. Most of the time I run into this, I can safely disable it, but its a little inconvenient to search for the command

    opened by EntilZha 5
  • Update and simplify README

    Update and simplify README

    I updated the README.md. Furthermore, I really like READMEs which are concise, similar to https://github.com/pandas-dev/pandas, i.e. a README which summarizes what the library does, a fully contained example that can be copy-pasted, simple installation instructions, and a reference to the documentation. This is where users can then go to learn more. Afterwards, some additional content for developers. In my opinion, all the rest should be in the documentation so it's easier to find.

    Reasoning for the changes is usually in the commit messages but let me know if anything is unclear!

    Included content from #1122 in CONTRIBUTING.md

    Is the Google Altair Group still something that should be actively recommended for asking questions or only StackOverflow? I think ideally there is one preferred place to ask questions (StackOverflow) and one place to report feature requests and bugs (GH issues). But as the Google Group already has quite some content, maybe we want to keep the reference to it and I could also add it in the Getting Help page in the documentation?

    opened by binste 9
Releases(v4.2.0)
  • v4.2.0(Dec 29, 2021)

    Enhancements

    • Pie charts are now supported through the use of mark_arc. (Examples: eg. Pie Chart and Radial Chart)
    • Support for the datum encoding specifications from Vega-Lite; see Vega-Lite Datum Definition. (Examples: Line Chart with datum and Line Chart with datum for color.)
    • angle encoding can now be used to control point styles (Example: Wind Vector Map)
    • Support for serialising pandas nullable data types for float data (#2399).
    • Automatically create an empty data object when Chart is called without a data parameter (#2515).
    • Allow the use of pathlib Paths when saving charts (#2355).
    • Support deepcopy for charts (#2403).

    Bug Fixes

    • Fix to_dict() for nested selections (#2120).
    • Fix item access for expressions (#2099).
    Source code(tar.gz)
    Source code(zip)
  • v4.1.0(Apr 1, 2020)

    • Minimum Python version is now 3.6
    • Update Vega-Lite to version 4.8.1; many new features and bug fixes from Vega-Lite versions 4.1 through 4.8; see Vega-Lite Release Notes.

    Enhancements

    • strokeDash encoding can now be used to control line styles (Example: Multi Series Line Chart
    • chart.save() now relies on altair_saver for more flexibility (#1943).
    • New chart.show() method replaces chart.serve(), and relies on altair_viewer to allow offline viewing of charts (#1988).

    Bug Fixes

    • Support Python 3.8 (#1958)
    • Support multiple views in JupyterLab (#1986)
    • Support numpy types within specifications (#1914)
    • Support pandas nullable ints and string types (#1924)

    ##Maintenance

    • Altair now uses black and flake8 for maintaining code quality & consistency.
    Source code(tar.gz)
    Source code(zip)
  • v4.0.0(Dec 11, 2019)

    Altair Version 4.0.0 release

    Version 4.0.0 is based on Vega-Lite version 4.0, which you can read about at https://github.com/vega/vega-lite/releases/tag/v4.0.0.

    It is the first version of Altair to drop Python 2 compatibility, and is tested on Python 3.5 and newer.

    Enhancements

    • Support for interactive legends: (Example) interactive legend

    • Responsive chart width and height: (Example) dynamic width

    • Bins responsive to selections: (Example) responsive bin

    • New pivot transform: (Example) pivot

    • New Regression transform: (Example) regression

    • New LOESS transform: (Example) loess

    • New density transform: (Example) density

    • Image mark (Example) image

    • New default html renderer, directly compatible with Jupyter Notebook and JupyterLab without the need for frontend extensions, as well as tools like nbviewer and nbconvert, and related notebook environments such as Zeppelin, Colab, Kaggle Kernels, and DataBricks. To enable the old default renderer, use:

      alt.renderers.enable('mimetype')
      
    • Support per-corner radius for bar marks: (Example) round-bar

    Grammar Changes

    • Sort-by-field can now use the encoding name directly. So instead of

      alt.Y('y:Q', sort=alt.EncodingSortField('x_field', order='descending'))
      

      you can now use::

      alt.Y('y:Q', sort="-x")
      
    • The rangeStep argument to :class:Scale and :meth:Chart.configure_scale is deprecated. instead, use chart.properties(width={"step": rangeStep}) or chart.configure_view(step=rangeStep).

    • align, center, spacing, and columns are no longer valid chart properties, but are moved to the encoding classes to which they refer.

    Source code(tar.gz)
    Source code(zip)
  • v3.3.0(Nov 27, 2019)

    Version 3.3.0

    released Nov 27, 2019

    Last release to support Python 2

    Enhancements

    • Add inheritance structure to low-level schema classes (#1803)
    • Add html renderer which works across frontends (#1793)
    • Support Python 3.8 (#1740, #1781)
    • Add :G shorthand for geojson type (#1714)
    • Add data generator interface: alt.sequence, alt.graticule, alt.sphere() (#1667, #1687)
    • Support geographic data sources via __geo_interface__ (#1664)

    Bug Fixes

    • Support pickle and copy.deepcopy for chart objects (#1805)
    • Fix bug when specifying count() within transform_joinaggregate() (#1751)
    • Fix LayerChart.add_selection (#1794)
    • Fix arguments to project() method (#1717)
    • Fix composition of multiple selections (#1707)
    Source code(tar.gz)
    Source code(zip)
  • v3.2.0(Aug 6, 2019)

    Version 3.2.0 (released August 5, 2019)

    Upgraded to Vega-Lite version 3.4 (See Vega-Lite 3.4 Release Notes).

    Following are changes to Altair in addition to those that came with VL 3.4:

    Enhancements

    • Selector values can be used directly in expressions (#1599)
    • Top-level chart repr is now truncated to improve readability of error messages (#1572)

    Bug Fixes

    • top-level add_selection methods now delegate to sub-charts. Previously they produced invalid charts (#1607)
    • Unsupported mark_*() methods removed from LayerChart (#1607)
    • New encoding channels are properly parsed (#1597)
    • Data context is propagated when encodings are specified as lists (#1587)

    Backward-Incompatible Changes

    • alt.LayerChart no longer has mark_*() methods, because they never produced valid chart specifications) (#1607)
    Source code(tar.gz)
    Source code(zip)
  • v2.2.0(Aug 15, 2018)

    Enhancements

    • better handling of datetimes and timezones (#1053)

    • all inline datasets are now converted to named datasets and stored at the top level of the chart. This behavior can be disabled by setting alt.data_transformers.consolidate_datasets = False (#951 & #1046)

    • more streamlined shorthand syntax for window transforms (#957)

    Maintenance

    Backward-incompatible changes

    • alt.SortField renamed to alt.EncodingSortField and alt.WindowSortField renamed to alt.SortField (#923)

    Bug Fixes

    • Fixed serialization of logical operands on selections within transform_filter(): (#1075)

    • Fixed sphinx issue which embedded chart specs twice (#1088)

    • Avoid Selenium import until it is actually needed (#982)

    Source code(tar.gz)
    Source code(zip)
  • v2.1.0(Jun 6, 2018)

    Enhancements

    • add a scale_factor argument to chart.save() to allow the size/resolution of saved figures to be adjusted. (#918)

    • add an add_selection() method to add selections to charts (#832)

    • add chart.serve() and chart.display() methods for more flexiblity in displaying charts (#831)

    • allow multiple fields to be passed to encodings such as tooltip and detail (#830)

    • make timeUnit specifications more succinct, by parsing them in a manner similar to aggregates (#866)

    • make to_json() and to_csv() have deterministic filenames, so in json mode a single datasets will lead to a single on-disk serialization (#862)

    Breaking Changes

    • make data the first argument for all compound chart types to match the semantics of alt.Chart (this includes alt.FacetChart, alt.LayerChart, alt.RepeatChart, alt.VConcatChart, and alt.HConcatChart) (#895).

    • update vega-lite to version 2.4.3 (#836)

      • Only API change is internal: alt.MarkProperties is now alt.MarkConfig

    Maintenance

    • update vega to v3.3 & vega-embed to v3.11 in html output & colab renderer (#838)
    Source code(tar.gz)
    Source code(zip)
  • v1.2.0(Nov 7, 2016)

    Nov 7, 2016

    Major additions

    • Update to Vega-Lite 1.2 and make all its enhancements available to Altair
    • Add Chart.serve method (#197)
    • Add altair.expr machinery to specify transformations and filterings (#213)
    • Add Chart.savechart method, which can output JSON, HTML, and (if Node is installed) PNG and SVG. See https://altair-viz.github.io/documentation/displaying.html

    Bug Fixes

    • Countless minor bug fixes

    Maintenance:

    • Update to Vega-Lite 1.2.1 and add its supported features
    • Create website: http://altair-viz.github.io/
    • Set up Travis to run conda & pip; and to build documentation
    Source code(tar.gz)
    Source code(zip)
Owner
Altair
Declarative visualization in Python
Altair
A grammar of graphics for Python

plotnine Latest Release License DOI Build Status Coverage Documentation plotnine is an implementation of a grammar of graphics in Python, it is based

Hassan Kibirige 3.3k Jan 01, 2023
GD-UltraHack - A Mod Menu for Geometry Dash. Specifically a MegahackV5 clone in Python. Only for Windows

GD UltraHack: The Mod Menu that Nobody asked for. This is a mod menu for the gam

zeo 1 Jan 05, 2022
A GUI for Pandas DataFrames

PandasGUI A GUI for analyzing Pandas DataFrames. Demo Installation Install latest release from PyPi: pip install pandasgui Install directly from Githu

Adam 2.8k Jan 03, 2023
Python histogram library - histograms as updateable, fully semantic objects with visualization tools. [P]ython [HYST]ograms.

physt P(i/y)thon h(i/y)stograms. Inspired (and based on) numpy.histogram, but designed for humans(TM) on steroids(TM). The goal is to unify different

Jan Pipek 120 Dec 08, 2022
Debugging, monitoring and visualization for Python Machine Learning and Data Science

Welcome to TensorWatch TensorWatch is a debugging and visualization tool designed for data science, deep learning and reinforcement learning from Micr

Microsoft 3.3k Dec 27, 2022
Quickly and accurately render even the largest data.

Turn even the largest data into images, accurately Build Status Coverage Latest dev release Latest release Docs Support What is it? Datashader is a da

HoloViz 2.9k Dec 28, 2022
Flipper Zero documentation repo

Flipper Zero Docs Participation To fix a bug or add something new to this repository, you need to open a pull-request. Also, on every page of the site

Flipper Zero (All Repositories will be public soon) 114 Dec 30, 2022
Define fortify and autoplot functions to allow ggplot2 to handle some popular R packages.

ggfortify This package offers fortify and autoplot functions to allow automatic ggplot2 to visualize statistical result of popular R packages. Check o

Sinhrks 504 Dec 23, 2022
Render tokei's output to interactive sunburst chart.

Render tokei's output to interactive sunburst chart.

134 Dec 15, 2022
Simple, realtime visualization of neural network training performance.

pastalog Simple, realtime visualization server for training neural networks. Use with Lasagne, Keras, Tensorflow, Torch, Theano, and basically everyth

Rewon Child 416 Dec 29, 2022
Extensible, parallel implementations of t-SNE

openTSNE openTSNE is a modular Python implementation of t-Distributed Stochasitc Neighbor Embedding (t-SNE) [1], a popular dimensionality-reduction al

Pavlin Poličar 1.1k Jan 03, 2023
An application that allows you to design and test your own stock trading algorithms in an attempt to beat the market.

StockBot is a Python application for designing and testing your own daily stock trading algorithms. Installation Use the

Ryan Cullen 280 Dec 19, 2022
Streamlit-template - A streamlit app template based on streamlit-option-menu

streamlit-template A streamlit app template for geospatial applications based on

Qiusheng Wu 41 Dec 10, 2022
LinkedIn connections analyzer

LinkedIn Connections Analyzer 🔗 https://linkedin-analzyer.herokuapp.com Hey hey 👋 , welcome to my LinkedIn connections analyzer. I recently found ou

Okkar Min 5 Sep 13, 2022
Create 3d loss surface visualizations, with optimizer path. Issues welcome!

MLVTK A loss surface visualization tool Simple feed-forward network trained on chess data, using elu activation and Adam optimizer Simple feed-forward

7 Dec 21, 2022
Python support for Godot 🐍🐍🐍

Godot Python, because you want Python on Godot ! The goal of this project is to provide Python language support as a scripting module for the Godot ga

Emmanuel Leblond 1.4k Jan 04, 2023
trade bot connected to binance API/ websocket.,, include dashboard in plotly dash to visualize trades and balances

Crypto trade bot 1. What it is Trading bot connected to Binance API. This project made for fun. So ... Do not use to trade live before you have backte

G 3 Oct 07, 2022
Dipto Chakrabarty 7 Sep 06, 2022
A customized interface for single cell track visualisation based on pcnaDeep and napari.

pcnaDeep-napari A customized interface for single cell track visualisation based on pcnaDeep and napari. 👀 Under construction You can get test image

ChanLab 2 Nov 07, 2021
Visualize your pandas data with one-line code

PandasEcharts 简介 基于pandas和pyecharts的可视化工具 安装 pip 安装 $ pip install pandasecharts 源码安装 $ git clone https://github.com/gamersover/pandasecharts $ cd pand

陈华杰 2 Apr 13, 2022