view cool stats related to your discord account.

Overview

DiscoStats

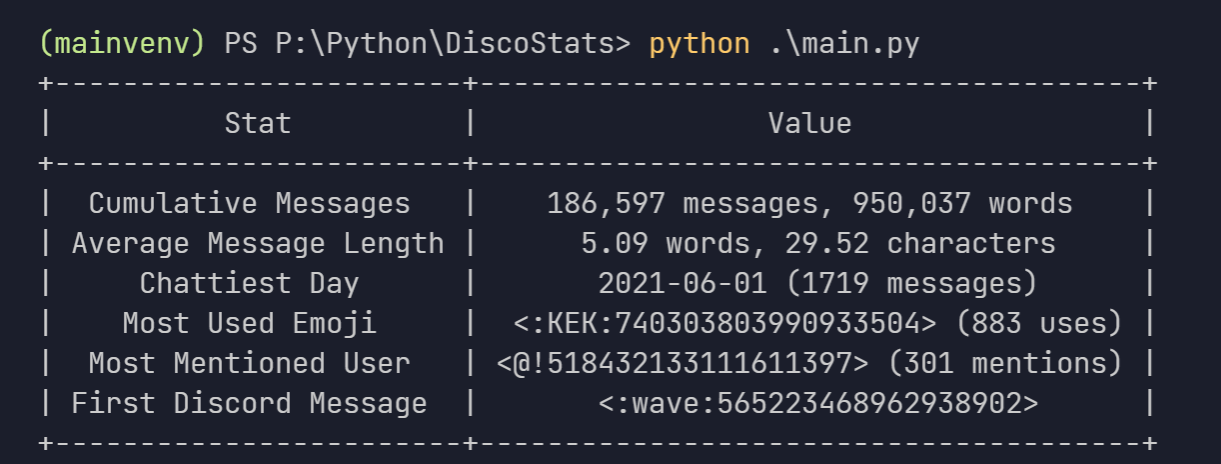
cool statistics generated using your discord data.
image

How?

DiscoStats is not a service that breaks the Discord Terms of Service or Community Guidelines. Discord has an option to request data which is what this entire application is based upon. It just scans through the lines of text of every message you have ever sent and generates statistics based upon that. As a forewarning, you need to request your data to use the application, which could potentially take up to 30 days.

Installation

⚠️ make sure you have python 3.7+ installed.

  • Clone the repository:
git clone https://github.com/ibra/DiscoStats
  • Install the dependencies:
pip install -r requirements.txt
  • Move your discord data inside the project directory, make sure it is all dumped under one "package" folder.
  • run main file:
python main.py  
  • optionally use the --dir flag to pinpoint the package location to a specific directory:
python main.py --dir otherFolder/package

Known Limitations

  • the name of servers, channels, users etc. cannot be displayed as there is no way to do that without having a bot or some sort of authorization within the server itself
  • the names of the emojis alone cannot be used because there could be conflicts between different servers, so its more convenient for them to be displayed in the <:Emoji:12345678910> format.
Owner
ibrahim hisham
student, programmer & hobbyist indie game developer
ibrahim hisham
Define fortify and autoplot functions to allow ggplot2 to handle some popular R packages.

ggfortify This package offers fortify and autoplot functions to allow automatic ggplot2 to visualize statistical result of popular R packages. Check o

Sinhrks 504 Dec 23, 2022
python partial dependence plot toolbox

PDPbox python partial dependence plot toolbox Motivation This repository is inspired by ICEbox. The goal is to visualize the impact of certain feature

Li Jiangchun 723 Jan 07, 2023
This plugin plots the time you spent on a tag as a histogram.

This plugin plots the time you spent on a tag as a histogram.

Tom Dörr 7 Sep 09, 2022
Simple, realtime visualization of neural network training performance.

pastalog Simple, realtime visualization server for training neural networks. Use with Lasagne, Keras, Tensorflow, Torch, Theano, and basically everyth

Rewon Child 416 Dec 29, 2022
Simple function to plot multiple barplots in the same figure.

Simple function to plot multiple barplots in the same figure. Supports padding and custom color.

Matthias Jakobs 2 Feb 21, 2022
Main repository for Vispy

VisPy: interactive scientific visualization in Python Main website: http://vispy.org VisPy is a high-performance interactive 2D/3D data visualization

vispy 3k Jan 03, 2023
A python script to visualise explain plans as a graph using graphviz

README Needs to be improved Prerequisites Need to have graphiz installed on the machine. Refer to https://graphviz.readthedocs.io/en/stable/manual.htm

Edward Mallia 1 Sep 28, 2021
Because trello only have payed options to generate a RunUp chart, this solves that!

Trello Runup Chart Generator The basic concept of the project is that Corello is pay-to-use and want to use Trello To-Do/Doing/Done automation with gi

Rômulo Schiavon 1 Dec 21, 2021
Boltzmann visualization - Visualize the Boltzmann distribution for simple quantum models of molecular motion

Boltzmann visualization - Visualize the Boltzmann distribution for simple quantum models of molecular motion

1 Jan 22, 2022
This project is an Algorithm Visualizer where a user can visualize algorithms like Bubble Sort, Merge Sort, Quick Sort, Selection Sort, Linear Search and Binary Search.

Algo_Visualizer This project is an Algorithm Visualizer where a user can visualize common algorithms like "Bubble Sort", "Merge Sort", "Quick Sort", "

Rahul 4 Feb 07, 2022
A program that analyzes data from inertia measurement units installed in aircraft and generates g-exceedance curves.

A program that analyzes data from inertia measurement units installed in aircraft and generates g-exceedance curves.

Pooya 1 Dec 02, 2021
Data aggregated from the reports found at the MCPS COVID Dashboard into a set of visualizations.

Montgomery County Public Schools COVID-19 Visualizer Contents About this project Data Support this project About this project Data All data we use can

James 3 Jan 19, 2022
Extract and visualize information from Gurobi log files

GRBlogtools Extract information from Gurobi log files and generate pandas DataFrames or Excel worksheets for further processing. Also includes a wrapp

Gurobi Optimization 56 Nov 17, 2022
Data Visualization Guide for Presentations, Reports, and Dashboards

This is a highly practical and example-based guide on visually representing data in reports and dashboards.

Anton Zhiyanov 395 Dec 29, 2022
cqMore is a CadQuery plugin based on CadQuery 2.1.

cqMore (under construction) cqMore is a CadQuery plugin based on CadQuery 2.1. Installation Please use conda to install CadQuery and its dependencies

Justin Lin 36 Dec 21, 2022
Open-source demos hosted on Dash Gallery

Dash Sample Apps This repository hosts the code for over 100 open-source Dash apps written in Python or R. They can serve as a starting point for your

Plotly 2.7k Jan 07, 2023
Altair extension for saving charts in a variety of formats.

Altair Saver This packge provides extensions to Altair for saving charts to a variety of output types. Supported output formats are: .json/.vl.json: V

Altair 85 Dec 09, 2022
Sci palettes for matplotlib/seaborn

sci palettes for matplotlib/seaborn Installation python3 -m pip install sci-palettes Usage import seaborn as sns import matplotlib.pyplot as plt impor

Qingdong Su 2 Jun 07, 2022
Monochromatic colorscheme for matplotlib with opinionated sensible default

Monochromatic colorscheme for matplotlib with opinionated sensible default If you need a simple monochromatic colorscheme for your matplotlib figures,

Aria Ghora Prabono 2 May 06, 2022
Lightweight data validation and adaptation Python library.

Valideer Lightweight data validation and adaptation library for Python. At a Glance: Supports both validation (check if a value is valid) and adaptati

Podio 258 Nov 22, 2022