Visualize the bitcoin blockchain from your local node

Overview

Project Overview

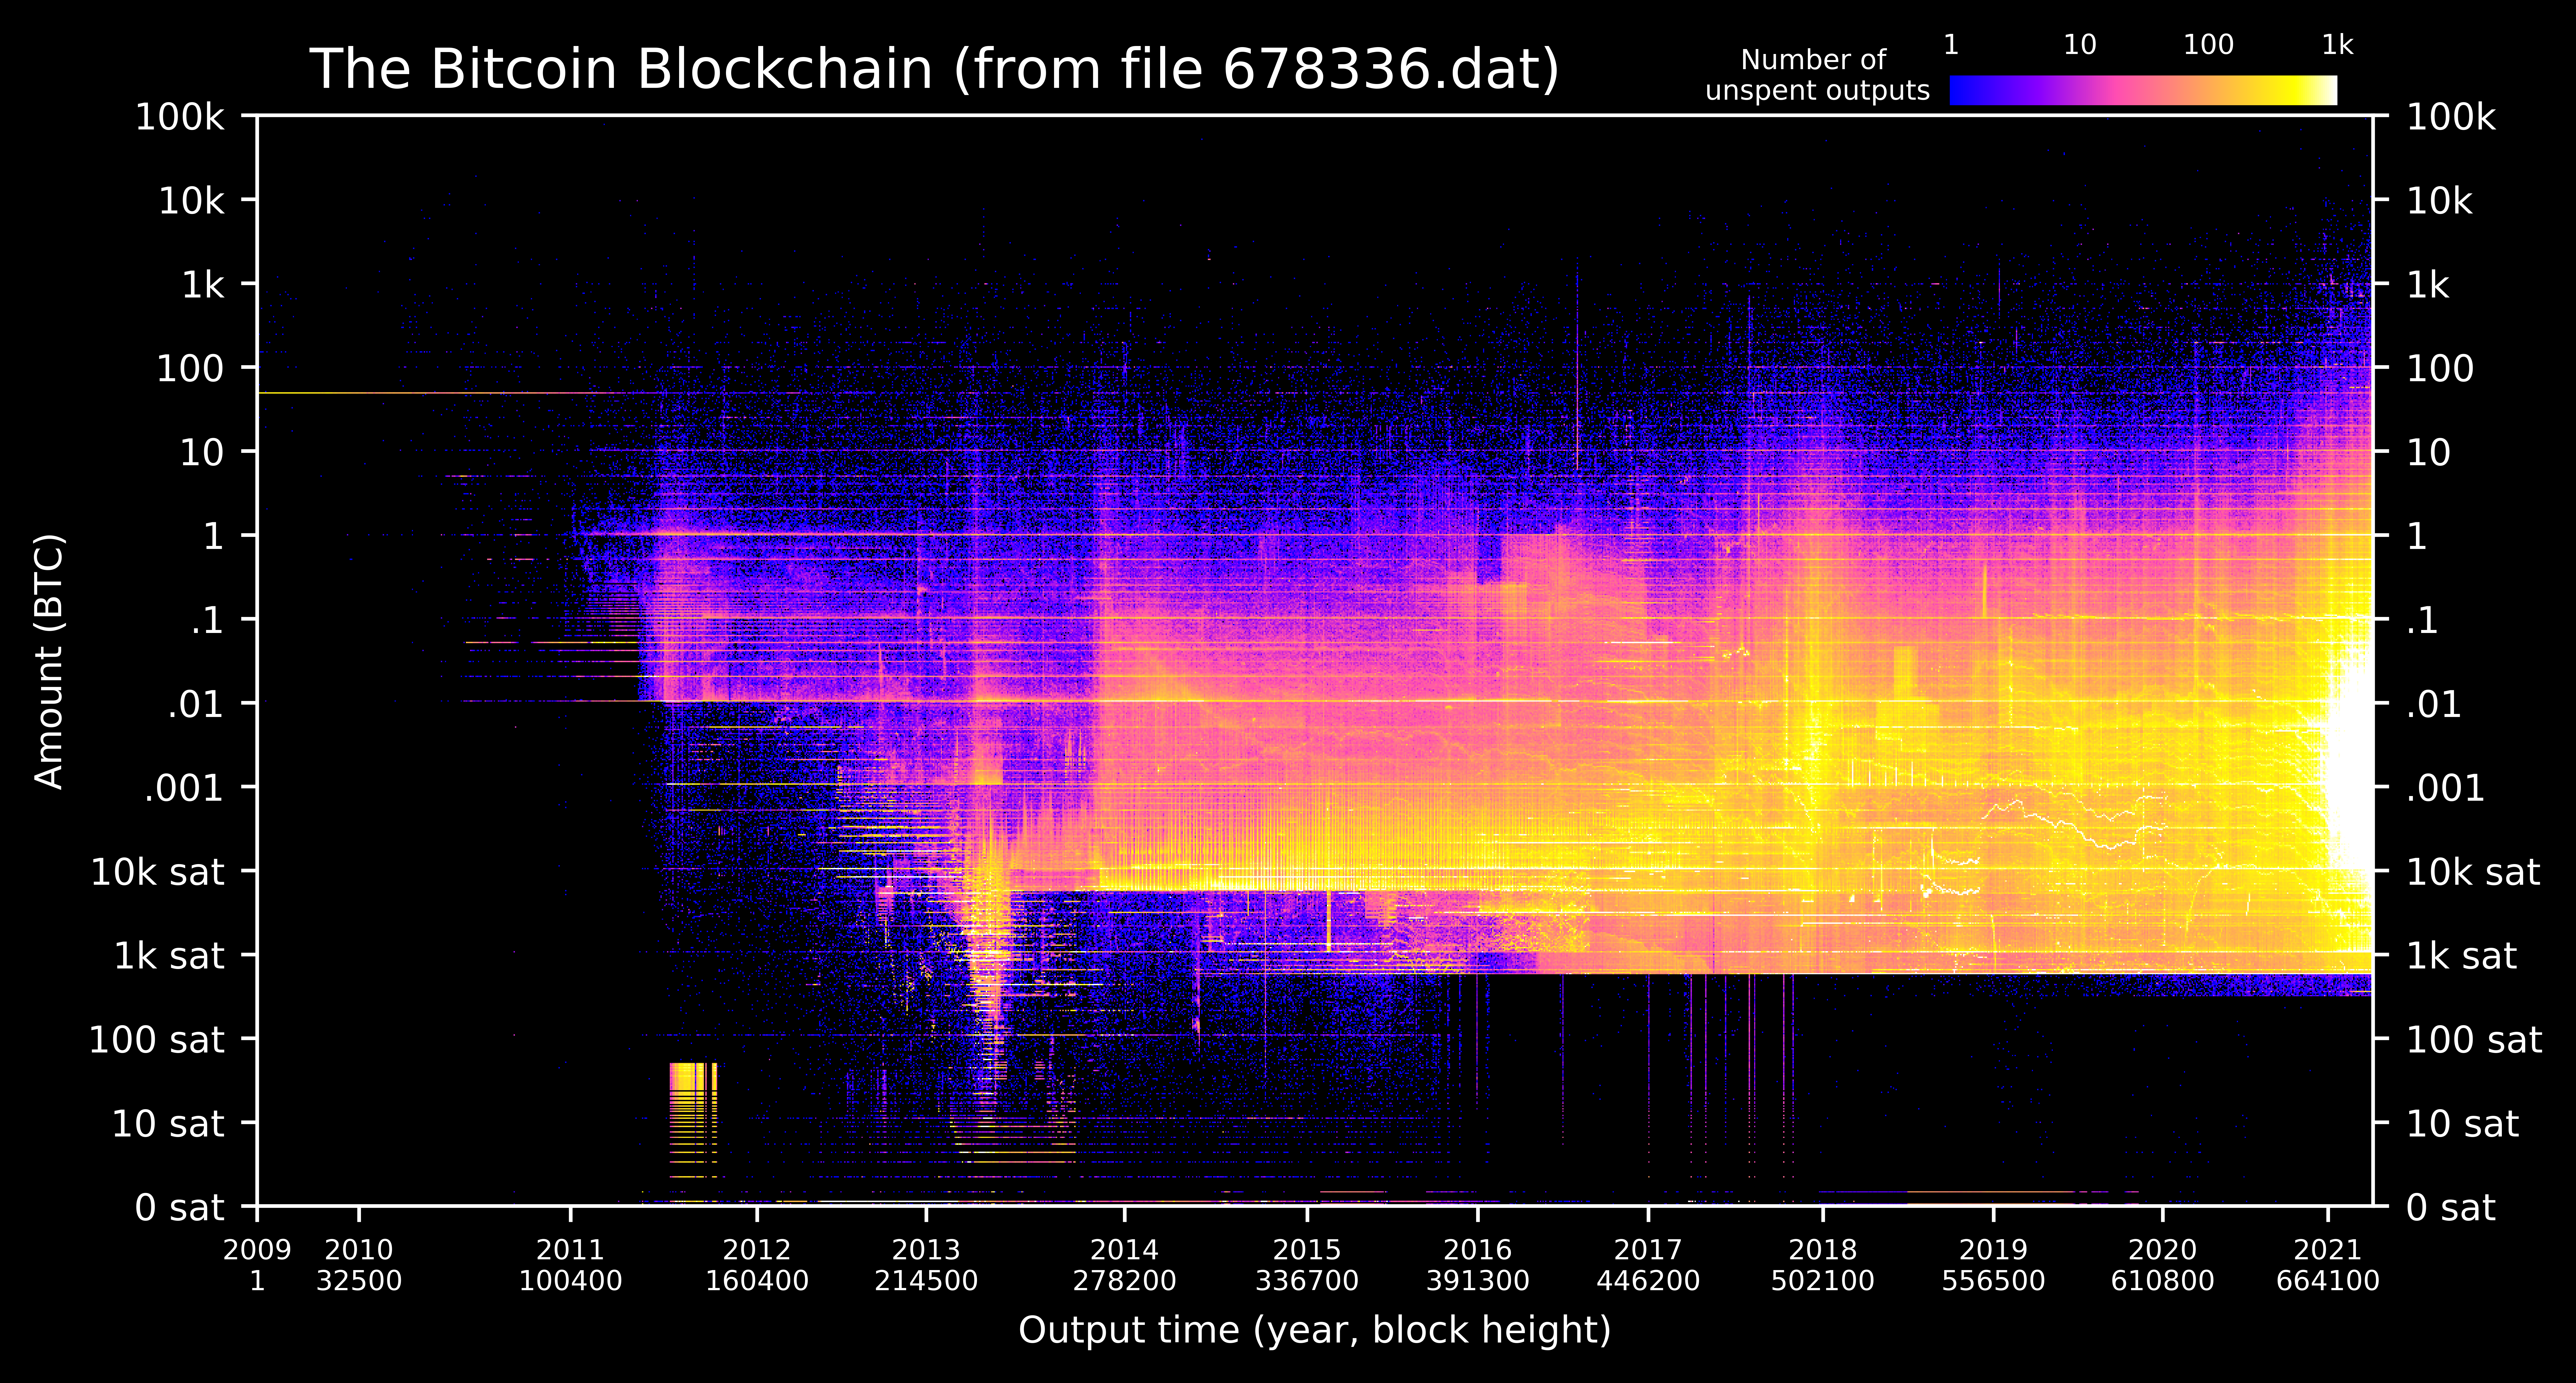
A new feature in Bitcoin Core 0.20 allows users to dump the state of the blockchain (the UTXO set) using the command dumptxoutset. I've written a python script utxo-live.py that takes the ouput of dumptxoutset and generates a heatmap of the blockchain via the UTXO set. Thus all of the active bitcoin in the blockchain is visualized in a single image from your own node.


Logo

Figure description: The heatmap is a two dimensional histogram showing the output date (x-axis), BTC amount (y-axis), and number of unspent outputs (color map) in each histogram bin. The BTC amounts on the y-axis are log scale and there are 100 bins in each log decade (e.g. 100 bins between 1 and 10 BTC). The bin size of output dates is one day. Zooming in to the image usually reveals more detail. A daily updating version of this image is running at utxo.live.

Privacy & Security

With the new dumptxouset command, the python script no longer requires an RPC password to access Core's databases. The script simply reads the dump file without interacting with Core at all. No private keys, passwords, xpubs, or wallet addresses are exchanged between Core and the python script.

Requirements

  • Bitcoin Core version 0.20 or higher
  • Python3 (comes standard on all operating systems)

Instructions for experienced users

  • Create a folder called utxo-live in a familiar location
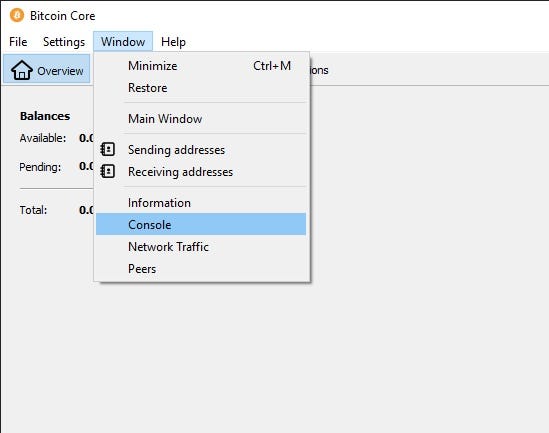
  • Dump the utxo set bitcoin-cli dumptxoutset /xxxxxx.dat where xxxxxxx is the current block height (10-20 min) (Note: bitcoin-cli doesn't ship with Core on Mac OS, use Window->Console instead)
  • Install two python dependencies python3 -m pip install numpy matplotlib
  • Download utxo-live.py to your utxo-live folder and run it python3 utxo-live.py (20 min)

Step by step instructions

  1. Make sure Bitcoin Core (version 0.20 or higher) is running and synchronized.

  2. Create a new folder called utxo-live in a familiar location on your machine (e.g. in your Documents folder).

  3. Open a terminal window and display the current folder path. Do this by:

  • Windows: open a terminal (Start -> Command Prompt) and type:
echo %cd%
  • Mac/Linux: open a terminal (Mac: Applications -> Utilities -> Terminal) and type:
pwd
  1. Navigate to the utxo-live folder using the change directory cd command. For example if you're currently in Users/Steve/ (or on Windows C:\Users\Steve\) and you've created the folder Steve/Documents/bitcoin-tools/utxo-live/ then type:
cd Document/bitcoin-tools/utxo-live/

Note: Windows sometimes requires forward slashes / instead of back slashes \.

  1. Again display the current folder (Step 3) and copy to your clipboard the full path to the utxo-live folder. We will be pasting this path into Bitcoin Core soon.

  2. Leave the terminal window momentarily, and open the Bitcoin Core console window. (Alternatively for bitcoin-cli users, open another terminal window and type the console commands in the next steps as bitcoin-cli commands.)

Open Console Pic

  1. Get the current block count by typing in the console window:
getblockcount

and hitting enter. The output will look like:

  1. Dump the current utxo set by typing in the console window:
  dumptxoutset <PATH to utxo-live>/<xxxxxx.dat>

where is copy-pasted from Step 5, and is the block count. For example if the block count is 678505, the command (for my path) is:

  dumptxoutset /Users/Steve/Documents/bitcoin-tools/utxo-live/678505.dat

If there are no error messages after hitting enter, then it's working. It will take 10-20 minutes. Look in your utxo-live folder and you should see the file being created as xxxxxx.dat.incomplete.

  1. While the utxo file is dumping, download utxo-live.py and install two python dependencies. To do this:
  • Right click on utxo-live.py, choose "Save Link As" and select the utxo-live folder.

  • In the terminal window (not the Bitcoin console), type the following command to install two python dependencies:

  python3 -m pip install numpy matplotlib

Note: you might already have these installed, but running the command won't hurt anything.

  1. If 10-20 minutes have passed, check that the utxo dump is completed. Do this in two ways:
  • Check that the file no longer has .incomplete after xxxxxx.dat
  • Check that the Bitcoin Core console displays the results of the dump as something like:

  1. If the dump file is finished and Step 9 is completed (utxo-live.py is downloaded and python dependencies were installed), then run utxo-live.py by typing in the terminal:
  python3 utxo-live.py
  1. The program will take 20-30 minutes to complete and it will update you on the progress. If there are multiple xxxxxxx.dat files in the folder, it will ask you which one you'd like to process. When finished the image is stored in the folder as utxo_heatmap_xxxxxx.png.

Acknowledgements

I'm indebted to three main projects for the code, understanding, and inspiration for this project. The python functions that parse and decode the utxo dump file were adapted from Bitcoin_Tools. I learned how Core serializes utxos from Bitcoin-UTXO-Dump . An inspiring project that visualizes changes in the UTXO set as a movie is BitcoinUtxoVisualizer .
HW_02 Data visualisation task

HW_02 Data visualisation and Matplotlib practice Instructions for HW_02 Idea for data analysis As I was brainstorming ideas and running through databa

9 Dec 13, 2022
Info for The Great DataTas plot-a-thon

The Great DataTas plot-a-thon Datatas is organising a Data Visualisation competition: The Great DataTas plot-a-thon We will be using Tidy Tuesday data

2 Nov 21, 2021
IPython/Jupyter notebook module for Vega and Vega-Lite

IPython Vega IPython/Jupyter notebook module for Vega 5, and Vega-Lite 4. Notebooks with embedded visualizations can be viewed on GitHub and nbviewer.

Vega 335 Nov 29, 2022
An intuitive library to add plotting functionality to scikit-learn objects.

Welcome to Scikit-plot Single line functions for detailed visualizations The quickest and easiest way to go from analysis... ...to this. Scikit-plot i

Reiichiro Nakano 2.3k Dec 31, 2022
clock_plot provides a simple way to visualize timeseries data, mapping 24 hours onto the 360 degrees of a polar plot

clock_plot clock_plot provides a simple way to visualize timeseries data mapping 24 hours onto the 360 degrees of a polar plot. For usage, please see

12 Aug 24, 2022
GitHub Stats Visualizations : Transparent

GitHub Stats Visualizations : Transparent Generate visualizations of GitHub user and repository statistics using GitHub Actions. ⚠️ Disclaimer The pro

YuanYap 7 Apr 05, 2022
An XLSX spreadsheet renderer for Django REST Framework.

drf-renderer-xlsx provides an XLSX renderer for Django REST Framework. It uses OpenPyXL to create the spreadsheet and returns the data.

The Wharton School 166 Dec 01, 2022
Minimalistic tool to visualize how the routes to a given target domain change over time, feat. Python 3.10 & mermaid.js

Minimalistic tool to visualize how the routes to a given target domain change over time, feat. Python 3.10 & mermaid.js

Péter Ferenc Gyarmati 1 Jan 17, 2022
Python Data. Leaflet.js Maps.

folium Python Data, Leaflet.js Maps folium builds on the data wrangling strengths of the Python ecosystem and the mapping strengths of the Leaflet.js

6k Jan 02, 2023
Drag’n’drop Pivot Tables and Charts for Jupyter/IPython Notebook, care of PivotTable.js

pivottablejs: the Python module Drag’n’drop Pivot Tables and Charts for Jupyter/IPython Notebook, care of PivotTable.js Installation pip install pivot

Nicolas Kruchten 512 Dec 26, 2022
This is a small repository for me to implement my simply Data Visualisation skills through Python.

Data Visualisations This is a small repository for me to implement my simply Data Visualisation skills through Python. Steam Population Chart from 10/

9 Dec 31, 2021
A curated list of awesome Dash (plotly) resources

Awesome Dash A curated list of awesome Dash (plotly) resources Dash is a productive Python framework for building web applications. Written on top of

Luke Singham 1.7k Jan 07, 2023
GD-UltraHack - A Mod Menu for Geometry Dash. Specifically a MegahackV5 clone in Python. Only for Windows

GD UltraHack: The Mod Menu that Nobody asked for. This is a mod menu for the gam

zeo 1 Jan 05, 2022
The repository is my code for various types of data visualization cases based on the Matplotlib library.

ScienceGallery The repository is my code for various types of data visualization cases based on the Matplotlib library. It summarizes the code and cas

Warrick Xu 2 Apr 20, 2022
Debugging, monitoring and visualization for Python Machine Learning and Data Science

Welcome to TensorWatch TensorWatch is a debugging and visualization tool designed for data science, deep learning and reinforcement learning from Micr

Microsoft 3.3k Dec 27, 2022
Draw datasets from within Jupyter.

drawdata This small python app allows you to draw a dataset in a jupyter notebook. This should be very useful when teaching machine learning algorithm

vincent d warmerdam 505 Nov 27, 2022
Voilà, install macOS on ANY Computer! This is really and magic easiest way!

OSX-PROXMOX - Run macOS on ANY Computer - AMD & Intel Install Proxmox VE v7.02 - Next, Next & Finish (NNF). Open Proxmox Web Console - Datacenter N

Gabriel Luchina 654 Jan 09, 2023
Statistical data visualization using matplotlib

seaborn: statistical data visualization Seaborn is a Python visualization library based on matplotlib. It provides a high-level interface for drawing

Michael Waskom 10.2k Dec 30, 2022
Standardized plots and visualizations in Python

Standardized plots and visualizations in Python pltviz is a Python package for standardized visualization. Routine and novel plotting approaches are f

Andrew Tavis McAllister 0 Jul 09, 2022
Make sankey, alluvial and sankey bump plots in ggplot

The goal of ggsankey is to make beautiful sankey, alluvial and sankey bump plots in ggplot2

David Sjoberg 156 Jan 03, 2023