Portfolio analytics for quants, written in Python

Overview
Python version PyPi version PyPi status Travis-CI build status PyPi downloads CodeFactor Star this repo Follow me on twitter

QuantStats: Portfolio analytics for quants

QuantStats Python library that performs portfolio profiling, allowing quants and portfolio managers to understand their performance better by providing them with in-depth analytics and risk metrics.

Changelog »

QuantStats is comprised of 3 main modules:

  1. quantstats.stats - for calculating various performance metrics, like Sharpe ratio, Win rate, Volatility, etc.
  2. quantstats.plots - for visualizing performance, drawdowns, rolling statistics, monthly returns, etc.
  3. quantstats.reports - for generating metrics reports, batch plotting, and creating tear sheets that can be saved as an HTML file.

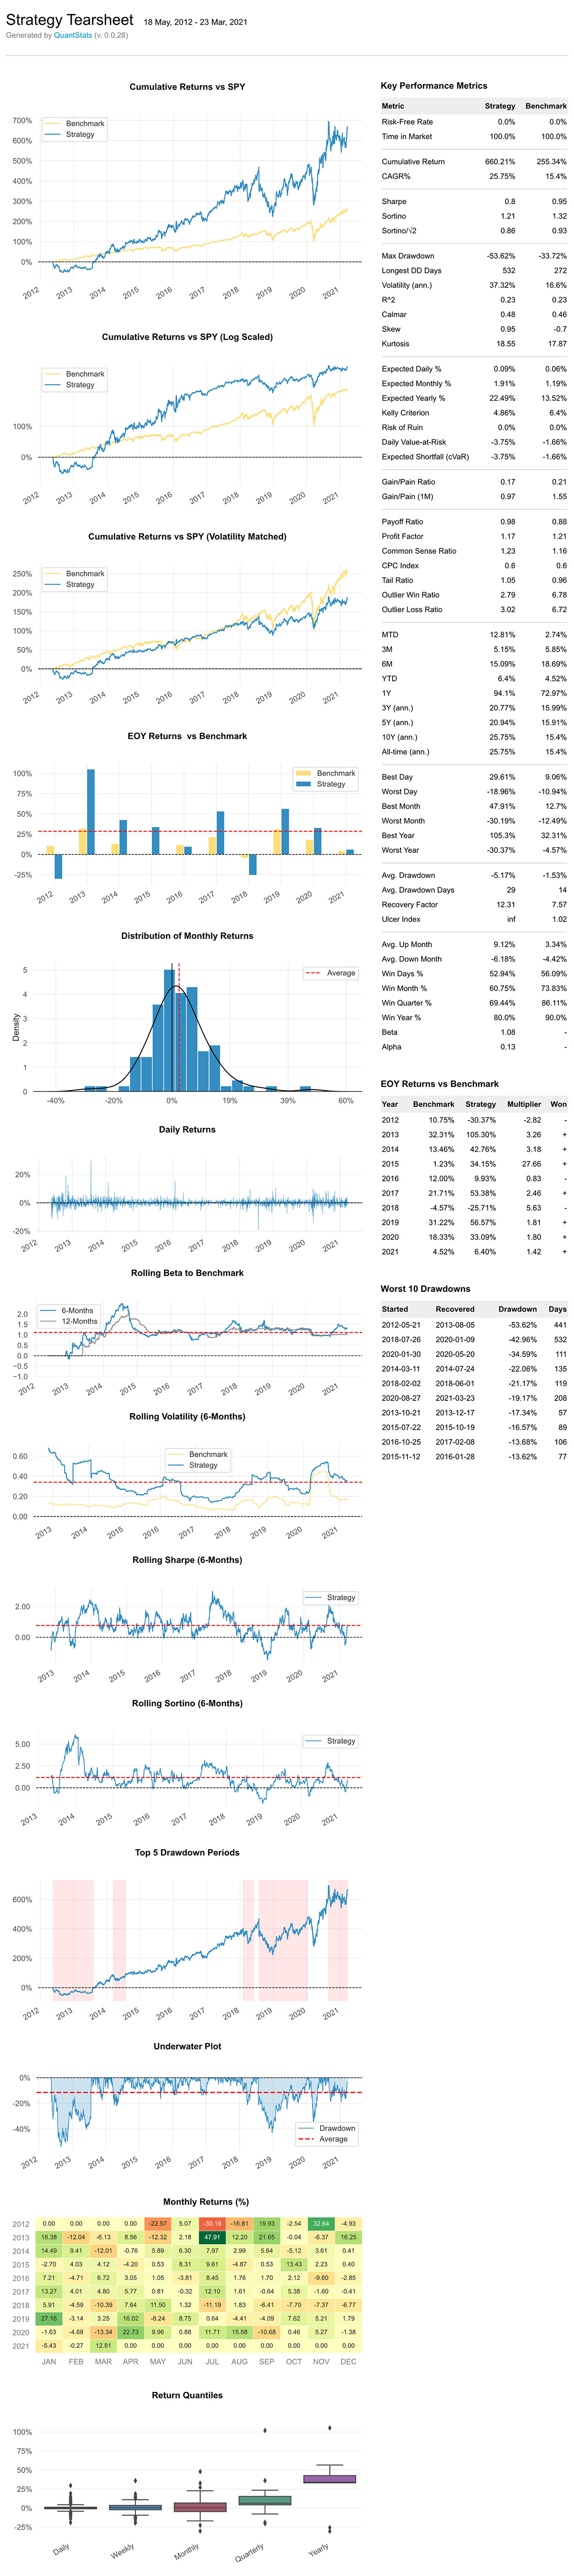
Here's an example of a simple tear sheet analyzing a strategy:

Quick Start

%matplotlib inline
import quantstats as qs

# extend pandas functionality with metrics, etc.
qs.extend_pandas()

# fetch the daily returns for a stock
stock = qs.utils.download_returns('FB')

# show sharpe ratio
qs.stats.sharpe(stock)

# or using extend_pandas() :)
stock.sharpe()

Output:

0.8135304438803402

Visualize stock performance

qs.plots.snapshot(stock, title='Facebook Performance')

# can also be called via:
# stock.plot_snapshot(title='Facebook Performance')

Output:

Snapshot plot

Creating a report

You can create 7 different report tearsheets:

  1. qs.reports.metrics(mode='basic|full", ...) - shows basic/full metrics
  2. qs.reports.plots(mode='basic|full", ...) - shows basic/full plots
  3. qs.reports.basic(...) - shows basic metrics and plots
  4. qs.reports.full(...) - shows full metrics and plots
  5. qs.reports.html(...) - generates a complete report as html

Let' create an html tearsheet

(benchmark can be a pandas Series or ticker)
qs.reports.html(stock, "SPY")

Output will generate something like this:

HTML tearsheet

(view original html file)

To view a complete list of available methods, run

[f for f in dir(qs.stats) if f[0] != '_']
['avg_loss',
 'avg_return',
 'avg_win',
 'best',
 'cagr',
 'calmar',
 'common_sense_ratio',
 'comp',
 'compare',
 'compsum',
 'conditional_value_at_risk',
 'consecutive_losses',
 'consecutive_wins',
 'cpc_index',
 'cvar',
 'drawdown_details',
 'expected_return',
 'expected_shortfall',
 'exposure',
 'gain_to_pain_ratio',
 'geometric_mean',
 'ghpr',
 'greeks',
 'implied_volatility',
 'information_ratio',
 'kelly_criterion',
 'kurtosis',
 'max_drawdown',
 'monthly_returns',
 'outlier_loss_ratio',
 'outlier_win_ratio',
 'outliers',
 'payoff_ratio',
 'profit_factor',
 'profit_ratio',
 'r2',
 'r_squared',
 'rar',
 'recovery_factor',
 'remove_outliers',
 'risk_of_ruin',
 'risk_return_ratio',
 'rolling_greeks',
 'ror',
 'sharpe',
 'skew',
 'sortino',
 'adjusted_sortino',
 'tail_ratio',
 'to_drawdown_series',
 'ulcer_index',
 'ulcer_performance_index',
 'upi',
 'utils',
 'value_at_risk',
 'var',
 'volatility',
 'win_loss_ratio',
 'win_rate',
 'worst']
[f for f in dir(qs.plots) if f[0] != '_']
['daily_returns',
 'distribution',
 'drawdown',
 'drawdowns_periods',
 'earnings',
 'histogram',
 'log_returns',
 'monthly_heatmap',
 'returns',
 'rolling_beta',
 'rolling_sharpe',
 'rolling_sortino',
 'rolling_volatility',
 'snapshot',
 'yearly_returns']

*** Full documenttion coming soon ***

In the meantime, you can get insights as to optional parameters for each method, by using Python's help method:

help(qs.stats.conditional_value_at_risk)
Help on function conditional_value_at_risk in module quantstats.stats:

conditional_value_at_risk(returns, sigma=1, confidence=0.99)
    calculats the conditional daily value-at-risk (aka expected shortfall)
    quantifies the amount of tail risk an investment

Installation

Install using pip:

$ pip install quantstats --upgrade --no-cache-dir

Install using conda:

$ conda install -c ranaroussi quantstats

Requirements

Questions?

This is a new library... If you find a bug, please open an issue in this repository.

If you'd like to contribute, a great place to look is the issues marked with help-wanted.

Known Issues

For some reason, I couldn't find a way to tell seaborn not to return the monthly returns heatmap when instructed to save - so even if you save the plot (by passing savefig={...}) it will still show the plot.

Legal Stuff

QuantStats is distributed under the Apache Software License. See the LICENSE.txt file in the release for details.

P.S.

Please drop me a note with any feedback you have.

Ran Aroussi

Comments
  • OverflowError: cannot convert float infinity to integer

    OverflowError: cannot convert float infinity to integer

    test.xlsx Below two functions are not working in attached data.

    1. qs.plots.snapshot()
    2. qs.reports.full()

    Function returns: OverflowError: cannot convert float infinity to integer

    opened by aa-gamJain 22
  • qs.reports.html(), ValueError: cannot convert float NaN to integer

    qs.reports.html(), ValueError: cannot convert float NaN to integer

    Hi, I'm experiencing problems simply using the example from the README to make a report, ie.:

    %matplotlib inline
    import quantstats as qs
    
    # extend pandas functionality with metrics, etc.
    qs.extend_pandas()
    
    # fetch the daily returns for a stock
    stock = qs.utils.download_returns('FB')
    
    qs.reports.html(stock, "SPY)
    

    This results in

    ---------------------------------------------------------------------------
    ValueError                                Traceback (most recent call last)
    <ipython-input-112-5ce6901da6d9> in <module>
    ----> 1 qs.reports.html(stock, benchmark)
    
    ~/WORKSPACE/venv/lib/python3.8/site-packages/quantstats/reports.py in html(returns, benchmark, rf, grayscale, title, output, compounded)
         56     tpl = tpl.replace('{{v}}', __version__)
         57 
    ---> 58     mtrx = metrics(returns=returns, benchmark=benchmark,
         59                    rf=rf, display=False, mode='full',
         60                    sep=True, internal="True",
    
    ~/WORKSPACE/venv/lib/python3.8/site-packages/quantstats/reports.py in metrics(returns, benchmark, rf, display, mode, sep, compounded, **kwargs)
        297 
        298     # return df
    --> 299     dd = _calc_dd(df, display=(display or "internal" in kwargs))
        300 
        301     metrics = _pd.DataFrame()
    
    ~/WORKSPACE/venv/lib/python3.8/site-packages/quantstats/reports.py in _calc_dd(df, display)
        573                 by='max drawdown', ascending=True
        574             )['max drawdown'].values[0] / pct,
    --> 575             'Longest DD Days': str(round(ret_dd.sort_values(
        576                 by='days', ascending=False)['days'].values[0])),
        577             'Avg. Drawdown %': ret_dd['max drawdown'].mean() / pct,
    
    ValueError: cannot convert float NaN to integer
    

    Any help would be much appreciated.

    opened by nistrup 17
  • Rolling beta does not works on small dataframes (`ValueError: cannot convert float NaN to integer`)

    Rolling beta does not works on small dataframes (`ValueError: cannot convert float NaN to integer`)

    The 6 months rolling do not work when there is not enough data.

    Here is the stack trace it generate:

    ...
      File "C:\Users\cacer\Desktop\datacrunch-trading-cli\backtest\export\quants.py", line 84, in finalize
        quantstats.reports.html(merged.daily_profit_pct, merged.close, output=True, download_filename=self.html_output_file)
      File "C:\Users\cacer\AppData\Local\Programs\Python\Python39\lib\site-packages\quantstats\reports.py", line 192, in html
        _plots.rolling_beta(returns, benchmark, grayscale=grayscale,
      File "C:\Users\cacer\AppData\Local\Programs\Python\Python39\lib\site-packages\quantstats\_plotting\wrappers.py", line 514, in rolling_beta
        fig = _core.plot_rolling_beta(returns, benchmark,
      File "C:\Users\cacer\AppData\Local\Programs\Python\Python39\lib\site-packages\quantstats\_plotting\core.py", line 515, in plot_rolling_beta
        mmin = min([-100, int(beta.min()*100)])
    ValueError: cannot convert float NaN to integer
    

    A simple fix can be to do fillna() on the beta after this line: https://github.com/ranaroussi/quantstats/blob/bfc247071fa1b80772cb101f2b31b72b8227cabf/quantstats/_plotting/core.py#L506

    I can do a pull request if you want. Please tell me if you found anything that would make this fix incorrect.

    opened by Caceresenzo 10
  • qs.reports.plots(mode=

    qs.reports.plots(mode="full", ...) returns "AttributeError: 'Int64Index' object has no attribute 'date'" or "TypeError: 'method' object is not subscriptable"

    Hi there,

    Running the simple code below:

    import quantstats as qs
    
    # fetch the daily returns for a stock
    stock = qs.utils.download_returns('FB')
    
    qs.reports.plots(mode="full",returns=stock)
    

    returns the following error:

      File "C:\Users\rapha\OneDrive\Dokumente\GitHub\algorithms\ml4t\tmp.py", line 16, in <module>
        qs.reports.plots(mode="full",returns=stock)
    
      File "C:\Users\rapha\anaconda3\envs\py36-backtrader\lib\site-packages\quantstats\reports.py", line 520, in plots
        show=True, ylabel=False)
    
      File "C:\Users\rapha\anaconda3\envs\py36-backtrader\lib\site-packages\quantstats\_plotting\wrappers.py", line 381, in yearly_returns
        savefig=savefig, show=show)
    
      File "C:\Users\rapha\anaconda3\envs\py36-backtrader\lib\site-packages\quantstats\_plotting\core.py", line 111, in plot_returns_bars
        df.index.date[:1][0].strftime('%Y'),
    
    AttributeError: 'Int64Index' object has no attribute 'date'
    

    If I extend pandas functionnality as suggest in the Quick Start example (qs.extend_pandas), I get a different error at the same place in the code:

      File "C:\Users\rapha\OneDrive\Dokumente\GitHub\algorithms\ml4t\tmp.py", line 16, in <module>
        qs.reports.plots(mode="full",returns=stock)
    
      File "C:\Users\rapha\anaconda3\envs\py36-backtrader\lib\site-packages\quantstats\reports.py", line 520, in plots
        show=True, ylabel=False)
    
      File "C:\Users\rapha\anaconda3\envs\py36-backtrader\lib\site-packages\quantstats\_plotting\wrappers.py", line 381, in yearly_returns
        savefig=savefig, show=show)
    
      File "C:\Users\rapha\anaconda3\envs\py36-backtrader\lib\site-packages\quantstats\_plotting\core.py", line 111, in plot_returns_bars
        df.index.date[:1][0].strftime('%Y'),
    
    AttributeError: 'Int64Index' object has no attribute 'date'
    

    Any idea what the issue is? My environment seems to fit the requirements:

    • Python = 3.6.12
    • pandas = 1.1.3
    • numpy = 1.19.2
    • scipy = 1.5.2
    • matplotlib = 3.2.2
    • seaborn = 0.11.1
    • tabulate = 0.8.7
    • yfinance = 0.1.55
    • plotly = 4.14.3

    Best, Raphaël

    opened by rcardinaux 7
  • calculation issues with rolling_sharpe() and rolling_sortino()

    calculation issues with rolling_sharpe() and rolling_sortino()

    I noticed a couple of calculation issues with the rolling_sharpe() and rolling_sortino() functions used in the tearsheet graphs:

    1. In both rolling_sharpe() and rolling_sortino(): The period variable is used to specify the number of days in the rolling window (by default 126). However, period is also used to annualize the daily returns data for returns and benchmarks, which is incorrect. Irrespective of the number of days in the rolling window, the returns are still daily returns, so the factor should be 252. [For #74, a new variable would need to be created -- period can't do double duty as both the number of datapoints in the rolling window, AND the timespan that each datapoint represents :-) ]
    2. In rolling_sortino() in wrappers.py, the target downside deviation is not calculated as per the Red Rock Capital whitepaper cited in the sortino() function in stats.py. rolling_sortino() throws away all the positive returns and only takes the standard deviation of the negative returns, which is the opposite of the whitepaper's recommendation. I'm currently using this in rolling_sortino() as a workaround:
      from empyrical import roll_sortino_ratio
      returns = roll_sortino_ratio(returns, period)
      

    I'd be happy to provide a pull request for these items, just let me know.

    opened by kartiksubbarao 6
  • when rf is not equal to zero, metric report doesn't look correct.

    when rf is not equal to zero, metric report doesn't look correct.

    qs.reports.full(stock,benchmark='^NSEI',rf=0.065)

    Performance Metrics Strategy Benchmark


    Start Period 2014-11-14 2014-11-14 End Period 2019-11-14 2019-11-14 Risk-Free Rate 0.06% 0.06% Time in Market 100.0% 100.0%

    Cumulative Return -100.0% -100.0% CAGR% -100.0% -100.0% Sharpe -62.45 -118.52 Sortino -15.39 -15.73

    opened by sabirjana 6
  • Feat: Add make_index() for easy index creation

    Feat: Add make_index() for easy index creation

    Easily build an index for a given dictionary of weights and lookback period.

    Example

    FAANG = qs.utils.make_index(
        {
            'FB': 0.2,
            'AAPL': 0.2,
            'AMZN': 0.2,
            'NFLX': 0.2,
            'GOOG': 0.2
        },
    )
    
    qs.plots.snapshot(FAANG.dropna(), "SPY")
    

    Output: image

    opened by ctjlewis 5
  • No output for html reports

    No output for html reports

    Hi team, I have tried to run reports functions on jupyter notebook. However, there's no outpute for qs.reports.html(stock, "SPY"), could any one advise what's missing? Thanks `

    • qs.reports.metrics(mode='basic|full", ...) - shows basic/full metrics
    • qs.reports.plots(mode='basic|full", ...) - shows basic/full plots
    • qs.reports.basic(...) - shows basic metrics and plots
    • qs.reports.full(...) - shows full metrics and plots
    • qs.reports.html(...) - generates a complete report as html`
    opened by boyac 5
  • Profit factor calculation

    Profit factor calculation

    Is there any reason why you calculate profit factor as

    return abs(returns.sum() / returns[returns < 0].sum())
    

    as opposed to:

    return abs(returns[returns > 0].sum() / returns[returns < 0].sum())
    

    I thought normally profit factor is total profit / total loss

    opened by RatkoJ 5
  • Errors when there are no drawdowns

    Errors when there are no drawdowns

    Hello,

    First of all, thank you very much for releasing this lib publicly. I've been using it since it's so much simpler to use than many other ones.

    I did come across a problem when there aren't any drawdowns or if there are fewer than 5 drawdowns. The problem is in at least two places that I've seen.

    In stats._drawdown_details(drawdown), when returning None here, some code later expects a DataFrame and therefore it fails.

    # no drawdown :)
    if len(starts) == 0:
        return None
    

    Even if above we return an empty DataFrame with the right column names, the code that uses this function still fails because range(1,6) is assigned to an index: E.g. in reports.full()

    dd_info = _stats.drawdown_details(dd).sort_values(
            by='max drawdown', ascending=True)[:5]
    dd_info.index = range(1, 6)   # <-- Fails here
    
    opened by RatkoJ 5
  • Added Serenity Index and modified UPI calc

    Added Serenity Index and modified UPI calc

    Hi I've added to the metrics the Serenity index from this papar: https://www.keyquant.com/Download/GetFile?Filename=%5CPublications%5CKeyQuant_WhitePaper_APT_Part1.pdf also in attachment. KeyQuant_WhitePaper_APT_Part1.pdf

    I've also modified the UPI calculation, invoking the ulcer index function, removing copied code and calculating the drawdown on prices and not on daily returns

    Ciao, Giuseppe

    opened by galarosa 3
  • quantstats.reports.full is breaking

    quantstats.reports.full is breaking

    import quantstats quantstats.reports.full(navData, benchmark= indexData)# both have NAV data respectively for Strategy and Index

    Versions: quantstats- '0.0.59' matplotlib- '3.6.2' Python- '3.9'

    ValueError Traceback (most recent call last) ~\AppData\Local\Temp\ipykernel_13940\3446853376.py in ----> 1 quantstats.reports.full(navData, benchmark= indexData)

    ~\AppData\Roaming\Python\Python39\site-packages\quantstats\reports.py in full(returns, benchmark, rf, grayscale, figsize, display, compounded, periods_per_year, match_dates) 314 print('\n\n') 315 print('[Strategy Visualization]\nvia Matplotlib') --> 316 plots(returns=returns, benchmark=benchmark, 317 grayscale=grayscale, figsize=figsize, mode='full', 318 periods_per_year=periods_per_year, prepare_returns=False)

    ~\AppData\Roaming\Python\Python39\site-packages\quantstats\reports.py in plots(returns, benchmark, grayscale, figsize, mode, compounded, periods_per_year, prepare_returns, match_dates) 680 show=True, ylabel=False, 681 prepare_returns=False) --> 682 _plots.yearly_returns(returns, benchmark, 683 grayscale=grayscale, 684 figsize=(figsize[0], figsize[0]*.5),

    ~\AppData\Roaming\Python\Python39\site-packages\quantstats_plotting\wrappers.py in yearly_returns(returns, benchmark, fontname, grayscale, hlw, hlcolor, hllabel, match_volatility, log_scale, figsize, ylabel, subtitle, compounded, savefig, show, prepare_returns) 386 returns = returns.resample('A').last() 387 --> 388 fig = _core.plot_returns_bars(returns, benchmark, 389 fontname=fontname, 390 hline=returns.mean(),

    ~\AppData\Roaming\Python\Python39\site-packages\quantstats_plotting\core.py in plot_returns_bars(returns, benchmark, returns_label, hline, hlw, hlcolor, hllabel, resample, title, match_volatility, log_scale, figsize, grayscale, fontname, ylabel, subtitle, savefig, show) 84 # --------------- 85 colors, _, _ = _get_colors(grayscale) ---> 86 df = _pd.DataFrame(index=returns.index, data={returns_label: returns}) 87 if isinstance(benchmark, _pd.Series): 88 df['Benchmark'] = benchmark[benchmark.index.isin(returns.index)]

    C:\ProgramData\Anaconda3\lib\site-packages\pandas\core\frame.py in init(self, data, index, columns, dtype, copy) 634 elif isinstance(data, dict): 635 # GH#38939 de facto copy defaults to False only in non-dict cases --> 636 mgr = dict_to_mgr(data, index, columns, dtype=dtype, copy=copy, typ=manager) 637 elif isinstance(data, ma.MaskedArray): 638 import numpy.ma.mrecords as mrecords

    C:\ProgramData\Anaconda3\lib\site-packages\pandas\core\internals\construction.py in dict_to_mgr(data, index, columns, dtype, typ, copy) 500 # TODO: can we get rid of the dt64tz special case above? 501 --> 502 return arrays_to_mgr(arrays, columns, index, dtype=dtype, typ=typ, consolidate=copy) 503 504

    C:\ProgramData\Anaconda3\lib\site-packages\pandas\core\internals\construction.py in arrays_to_mgr(arrays, columns, index, dtype, verify_integrity, typ, consolidate) 123 124 # don't force copy because getting jammed in an ndarray anyway --> 125 arrays = _homogenize(arrays, index, dtype) 126 # _homogenize ensures 127 # - all(len(x) == len(index) for x in arrays)

    C:\ProgramData\Anaconda3\lib\site-packages\pandas\core\internals\construction.py in _homogenize(data, index, dtype) 623 val = lib.fast_multiget(val, oindex._values, default=np.nan) 624 --> 625 val = sanitize_array( 626 val, index, dtype=dtype, copy=False, raise_cast_failure=False 627 )

    C:\ProgramData\Anaconda3\lib\site-packages\pandas\core\construction.py in sanitize_array(data, index, dtype, copy, raise_cast_failure, allow_2d) 599 subarr = maybe_infer_to_datetimelike(subarr) 600 --> 601 subarr = _sanitize_ndim(subarr, data, dtype, index, allow_2d=allow_2d) 602 603 if isinstance(subarr, np.ndarray):

    C:\ProgramData\Anaconda3\lib\site-packages\pandas\core\construction.py in _sanitize_ndim(result, data, dtype, index, allow_2d) 650 if allow_2d: 651 return result --> 652 raise ValueError("Data must be 1-dimensional") 653 if is_object_dtype(dtype) and isinstance(dtype, ExtensionDtype): 654 # i.e. PandasDtype("O")

    ValueError: Data must be 1-dimensional

    opened by Virenk 0
  • download returns with period not max

    download returns with period not max

    I have a problem using the download.returns function with the non default option for the period argument.

    It is also not very clear from the code what the period argument is supposed to do. I take it that is there to start collecting data after the specified date.

    For example, I doing this and I get nothing.

    start_date = '2020-11-21'
    qs.utils.download_returns('SPY', period=start_date)
    
    opened by msh855 0
  • ERROR: Data must be 1-dimensional

    ERROR: Data must be 1-dimensional

    I am running quantstats with a custom pandas dataframe of daily returns values from an algo that I am developing. The returns data is formatted like the download from the y-finance with the first column as daily time stamps and the second column with the daily returns. When I run (below) I get the following error.

    qs.reports.full(returns)

    returns is a pandas data frame from June 2022 to end of December 2022.

            Strategy_Returns
    

    time
    2022-06-01 0.000000 2022-06-02 0.000000 2022-06-03 0.000000 2022-06-04 0.000000 2022-06-05 0.000000 ... ... 2022-12-23 0.000000 2022-12-24 0.000000 2022-12-25 -0.000307 2022-12-26 0.015963 2022-12-27 0.004344

    [210 rows x 1 columns]

    Any insights as to what is the underlying cause of the error would be appreciated or does my data set perhaps expose a bug in the library?


    ValueError Traceback (most recent call last) Input In [274], in <cell line: 1>() ----> 1 qs.reports.full(returns)

    File ~/opt/anaconda3/lib/python3.9/site-packages/quantstats/reports.py:317, in full(returns, benchmark, rf, grayscale, figsize, display, compounded, periods_per_year, match_dates) 314 print('\n\n') 315 print('[Strategy Visualization]\nvia Matplotlib') --> 317 plots(returns=returns, benchmark=benchmark, 318 grayscale=grayscale, figsize=figsize, mode='full', 319 periods_per_year=periods_per_year, prepare_returns=False)

    File ~/opt/anaconda3/lib/python3.9/site-packages/quantstats/reports.py:684, in plots(returns, benchmark, grayscale, figsize, mode, compounded, periods_per_year, prepare_returns, match_dates) 677 if benchmark is not None: 678 _plots.returns(returns, benchmark, match_volatility=True, 679 grayscale=grayscale, 680 figsize=(figsize[0], figsize[0].5), 681 show=True, ylabel=False, 682 prepare_returns=False) --> 684 _plots.yearly_returns(returns, benchmark, 685 grayscale=grayscale, 686 figsize=(figsize[0], figsize[0].5), 687 show=True, ylabel=False, 688 prepare_returns=False) 690 _plots.histogram(returns, grayscale=grayscale, 691 figsize=(figsize[0], figsize[0].5), 692 show=True, ylabel=False, 693 prepare_returns=False) 695 _plots.daily_returns(returns, grayscale=grayscale, 696 figsize=(figsize[0], figsize[0].3), 697 show=True, ylabel=False, 698 prepare_returns=False)

    File ~/opt/anaconda3/lib/python3.9/site-packages/quantstats/_plotting/wrappers.py:388, in yearly_returns(returns, benchmark, fontname, grayscale, hlw, hlcolor, hllabel, match_volatility, log_scale, figsize, ylabel, subtitle, compounded, savefig, show, prepare_returns) 385 returns = returns.resample('A').apply(_df.sum) 386 returns = returns.resample('A').last() --> 388 fig = _core.plot_returns_bars(returns, benchmark, 389 fontname=fontname, 390 hline=returns.mean(), 391 hlw=hlw, 392 hllabel=hllabel, 393 hlcolor=hlcolor, 394 match_volatility=match_volatility, 395 log_scale=log_scale, 396 resample=None, 397 title=title, 398 figsize=figsize, 399 grayscale=grayscale, 400 ylabel=ylabel, 401 subtitle=subtitle, 402 savefig=savefig, show=show) 403 if not show: 404 return fig

    File ~/opt/anaconda3/lib/python3.9/site-packages/quantstats/_plotting/core.py:86, in plot_returns_bars(returns, benchmark, returns_label, hline, hlw, hlcolor, hllabel, resample, title, match_volatility, log_scale, figsize, grayscale, fontname, ylabel, subtitle, savefig, show) 84 # --------------- 85 colors, _, _ = _get_colors(grayscale) ---> 86 df = _pd.DataFrame(index=returns.index, data={returns_label: returns}) 87 if isinstance(benchmark, _pd.Series): 88 df['Benchmark'] = benchmark[benchmark.index.isin(returns.index)]

    File ~/opt/anaconda3/lib/python3.9/site-packages/pandas/core/frame.py:636, in DataFrame.init(self, data, index, columns, dtype, copy) 630 mgr = self._init_mgr( 631 data, axes={"index": index, "columns": columns}, dtype=dtype, copy=copy 632 ) 634 elif isinstance(data, dict): 635 # GH#38939 de facto copy defaults to False only in non-dict cases --> 636 mgr = dict_to_mgr(data, index, columns, dtype=dtype, copy=copy, typ=manager) 637 elif isinstance(data, ma.MaskedArray): 638 import numpy.ma.mrecords as mrecords

    File ~/opt/anaconda3/lib/python3.9/site-packages/pandas/core/internals/construction.py:502, in dict_to_mgr(data, index, columns, dtype, typ, copy) 494 arrays = [ 495 x 496 if not hasattr(x, "dtype") or not isinstance(x.dtype, ExtensionDtype) 497 else x.copy() 498 for x in arrays 499 ] 500 # TODO: can we get rid of the dt64tz special case above? --> 502 return arrays_to_mgr(arrays, columns, index, dtype=dtype, typ=typ, consolidate=copy)

    File ~/opt/anaconda3/lib/python3.9/site-packages/pandas/core/internals/construction.py:125, in arrays_to_mgr(arrays, columns, index, dtype, verify_integrity, typ, consolidate) 122 index = ensure_index(index) 124 # don't force copy because getting jammed in an ndarray anyway --> 125 arrays = _homogenize(arrays, index, dtype) 126 # _homogenize ensures 127 # - all(len(x) == len(index) for x in arrays) 128 # - all(x.ndim == 1 for x in arrays) (...) 131 132 else: 133 index = ensure_index(index)

    File ~/opt/anaconda3/lib/python3.9/site-packages/pandas/core/internals/construction.py:625, in _homogenize(data, index, dtype) 622 val = dict(val) 623 val = lib.fast_multiget(val, oindex._values, default=np.nan) --> 625 val = sanitize_array( 626 val, index, dtype=dtype, copy=False, raise_cast_failure=False 627 ) 628 com.require_length_match(val, index) 630 homogenized.append(val)

    File ~/opt/anaconda3/lib/python3.9/site-packages/pandas/core/construction.py:601, in sanitize_array(data, index, dtype, copy, raise_cast_failure, allow_2d) 598 subarr = cast(np.ndarray, subarr) 599 subarr = maybe_infer_to_datetimelike(subarr) --> 601 subarr = _sanitize_ndim(subarr, data, dtype, index, allow_2d=allow_2d) 603 if isinstance(subarr, np.ndarray): 604 # at this point we should have dtype be None or subarr.dtype == dtype 605 dtype = cast(np.dtype, dtype)

    File ~/opt/anaconda3/lib/python3.9/site-packages/pandas/core/construction.py:652, in _sanitize_ndim(result, data, dtype, index, allow_2d) 650 if allow_2d: 651 return result --> 652 raise ValueError("Data must be 1-dimensional") 653 if is_object_dtype(dtype) and isinstance(dtype, ExtensionDtype): 654 # i.e. PandasDtype("O") 656 result = com.asarray_tuplesafe(data, dtype=np.dtype("object"))

    ValueError: Data must be 1-dimensional

    opened by gatorfan1990 0
  • Example doesn't work

    Example doesn't work

    As it said in readme:

    %matplotlib inline import quantstats as qs

    qs.extend_pandas()

    stock = qs.utils.download_returns('FB')

    qs.stats.sharpe(stock)

    stock.sharpe()

    the execution result:

    Got error from yahoo api for ticker FB, Error: {'code': 'Not Found', 'description': 'No data found, symbol may be delisted'}

    • FB: No timezone found, symbol may be delisted nan
    opened by Whisperes 0
  • inconsistent days treatment for returns vs pv

    inconsistent days treatment for returns vs pv

    consider the code similar to #233

    import pandas as pd
    import quantstats as qs
    
    pv_raw = [100, 101, 99, 98, 97, 101, 99]
    dates = pd.date_range("2022-12-01", periods=7)
    pv = pd.DataFrame(pv_raw, index=dates, columns=["pv"])
    vol = qs.stats.volatility(pv)
    sharpe = qs.stats.sharpe(pv)
    
    # calculate daily returns, no first day return as since data is daily (assumed EOD) 
    rt = pv.pct_change()
    rt = rt[1:]
    vol2 = qs.stats.volatility(rt)
    sharpe2 = qs.stats.sharpe(rt)
    

    printouts

    >>> vol[0], vol2[0]
    (0.3417106479175939, 0.3742046996695246)
    >>> sharpe[0], sharpe2[0]
    (-0.9136086220829638, -0.9733213582901914)
    

    volatility, sharpe and almost every other metric differs b/c when calculated from pv quantstats calculates statistics for the one extra first day as well (where returns are NaN). The results differ only a little bit, but it is quite annoying especially when trying to debug and compare results vs external stats valuation

    on the other hand, if correct, trimmed returns (like rt above) are supplied to qs.reports.html(), then plots do not start at 0/100% point, which is also confusing

    opened by drusakov778 0
Releases(0.0.59)
Owner
Ran Aroussi
Founder @Tradologics. Creator of tools for traders. Programming is how I meditate.
Ran Aroussi
一个多语言支持、易使用的 OCR 项目。An easy-to-use OCR project with multilingual support.

AgentOCR 简介 AgentOCR 是一个基于 PaddleOCR 和 ONNXRuntime 项目开发的一个使用简单、调用方便的 OCR 项目 本项目目前包含 Python Package 【AgentOCR】 和 OCR 标注软件 【AgentOCRLabeling】 使用指南 Pytho

AgentMaker 98 Nov 10, 2022
PyTorch implementation of normalizing flow models

PyTorch implementation of normalizing flow models

Vincent Stimper 242 Jan 02, 2023
Code for Learning Manifold Patch-Based Representations of Man-Made Shapes, in ICLR 2021.

LearningPatches | Webpage | Paper | Video Learning Manifold Patch-Based Representations of Man-Made Shapes Dmitriy Smirnov, Mikhail Bessmeltsev, Justi

Dima Smirnov 22 Nov 14, 2022
Learnable Boundary Guided Adversarial Training (ICCV2021)

Learnable Boundary Guided Adversarial Training This repository contains the implementation code for the ICCV2021 paper: Learnable Boundary Guided Adve

DV Lab 27 Sep 25, 2022
QAHOI: Query-Based Anchors for Human-Object Interaction Detection (paper)

QAHOI QAHOI: Query-Based Anchors for Human-Object Interaction Detection (paper) Requirements PyTorch = 1.5.1 torchvision = 0.6.1 pip install -r requ

38 Dec 29, 2022
A data annotation pipeline to generate high-quality, large-scale speech datasets with machine pre-labeling and fully manual auditing.

About This repository provides data and code for the paper: Scalable Data Annotation Pipeline for High-Quality Large Speech Datasets Development (subm

Appen Repos 86 Dec 07, 2022
First-Order Probabilistic Programming Language

FOPPL: A First-Order Probabilistic Programming Language This is an implementation of FOPPL, an S-expression based probabilistic programming language d

Renato Costa 23 Dec 20, 2022
Methods to get the probability of a changepoint in a time series.

Bayesian Changepoint Detection Methods to get the probability of a changepoint in a time series. Both online and offline methods are available. Read t

Johannes Kulick 554 Dec 30, 2022
Code for "R-GCN: The R Could Stand for Random"

RR-GCN: Random Relational Graph Convolutional Networks PyTorch Geometric code for the paper "R-GCN: The R Could Stand for Random" RR-GCN is an extensi

PreDiCT.IDLab 31 Sep 07, 2022
A computational block to solve entity alignment over textual attributes in a knowledge graph creation pipeline.

How to apply? Create your config.ini file following the example provided in config.ini Choose one of the options below to run: Run with Python3 pip in

Scientific Data Management Group 3 Jun 23, 2022
This is a package for LiDARTag, described in paper: LiDARTag: A Real-Time Fiducial Tag System for Point Clouds

LiDARTag Overview This is a package for LiDARTag, described in paper: LiDARTag: A Real-Time Fiducial Tag System for Point Clouds (PDF)(arXiv). This wo

University of Michigan Dynamic Legged Locomotion Robotics Lab 159 Dec 21, 2022
A quick recipe to learn all about Transformers

Transformers have accelerated the development of new techniques and models for natural language processing (NLP) tasks.

DAIR.AI 772 Dec 31, 2022
Supervised forecasting of sequential data in Python.

Supervised forecasting of sequential data in Python. Intro Supervised forecasting is the machine learning task of making predictions for sequential da

The Alan Turing Institute 54 Nov 15, 2022
Code for the Active Speakers in Context Paper (CVPR2020)

Active Speakers in Context This repo contains the official code and models for the "Active Speakers in Context" CVPR 2020 paper. Before Training The c

43 Oct 14, 2022
Code for our CVPR 2022 Paper "GEN-VLKT: Simplify Association and Enhance Interaction Understanding for HOI Detection"

GEN-VLKT Code for our CVPR 2022 paper "GEN-VLKT: Simplify Association and Enhance Interaction Understanding for HOI Detection". Contributed by Yue Lia

Yue Liao 47 Dec 04, 2022
Official Implementation for "ReStyle: A Residual-Based StyleGAN Encoder via Iterative Refinement" https://arxiv.org/abs/2104.02699

ReStyle: A Residual-Based StyleGAN Encoder via Iterative Refinement Recently, the power of unconditional image synthesis has significantly advanced th

967 Jan 04, 2023
SPEAR: Semi suPErvised dAta progRamming

Semi-Supervised Data Programming for Data Efficient Machine Learning SPEAR is a library for data programming with semi-supervision. The package implem

decile-team 91 Dec 06, 2022
Code for paper "Which Training Methods for GANs do actually Converge? (ICML 2018)"

GAN stability This repository contains the experiments in the supplementary material for the paper Which Training Methods for GANs do actually Converg

Lars Mescheder 885 Jan 01, 2023
PyTorch implementation of Glow

glow-pytorch PyTorch implementation of Glow, Generative Flow with Invertible 1x1 Convolutions (https://arxiv.org/abs/1807.03039) Usage: python train.p

Kim Seonghyeon 433 Dec 27, 2022
Advanced Deep Learning with TensorFlow 2 and Keras (Updated for 2nd Edition)

Advanced Deep Learning with TensorFlow 2 and Keras (Updated for 2nd Edition)

Packt 1.5k Jan 03, 2023