32 Repositories
Latest Python Libraries

web application for flight log analysis & review
Flight Review This is a web application for flight log analysis. It allows users to upload ULog flight logs, and analyze them through the browser. It

MetPy is a collection of tools in Python for reading, visualizing and performing calculations with weather data.
MetPy MetPy is a collection of tools in Python for reading, visualizing and performing calculations with weather data. MetPy follows semantic versioni

Standardized plots and visualizations in Python
Standardized plots and visualizations in Python pltviz is a Python package for standardized visualization. Routine and novel plotting approaches are f

🍊 :bar_chart: :bulb: Orange: Interactive data analysis
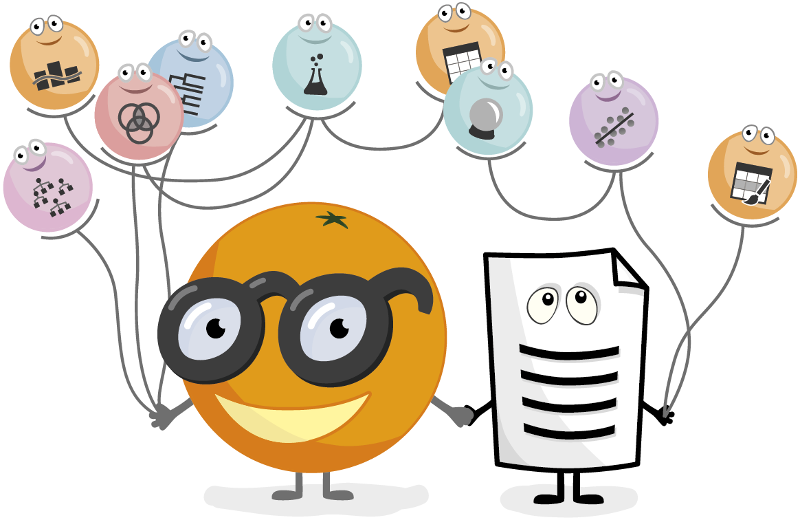
Orange Data Mining Orange is a data mining and visualization toolbox for novice and expert alike. To explore data with Orange, one requires no program
Interactive Data Visualization in the browser, from Python
Bokeh is an interactive visualization library for modern web browsers. It provides elegant, concise construction of versatile graphics, and affords hi

Tablexplore is an application for data analysis and plotting built in Python using the PySide2/Qt toolkit.
Tablexplore is an application for data analysis and plotting built in Python using the PySide2/Qt toolkit.
Python Libraries with functions and constants related to electrical engineering.
ElectricPy Electrical-Engineering-for-Python Python Libraries with functions and constants related to electrical engineering. The functions and consta
🌀❄️🌩️ This repository contains some examples for creating 2d and 3d weather plots using matplotlib and cartopy libraries in python3.
Weather-Plotting 🌀 ❄️ 🌩️ This repository contains some examples for creating 2d and 3d weather plots using matplotlib and cartopy libraries in pytho

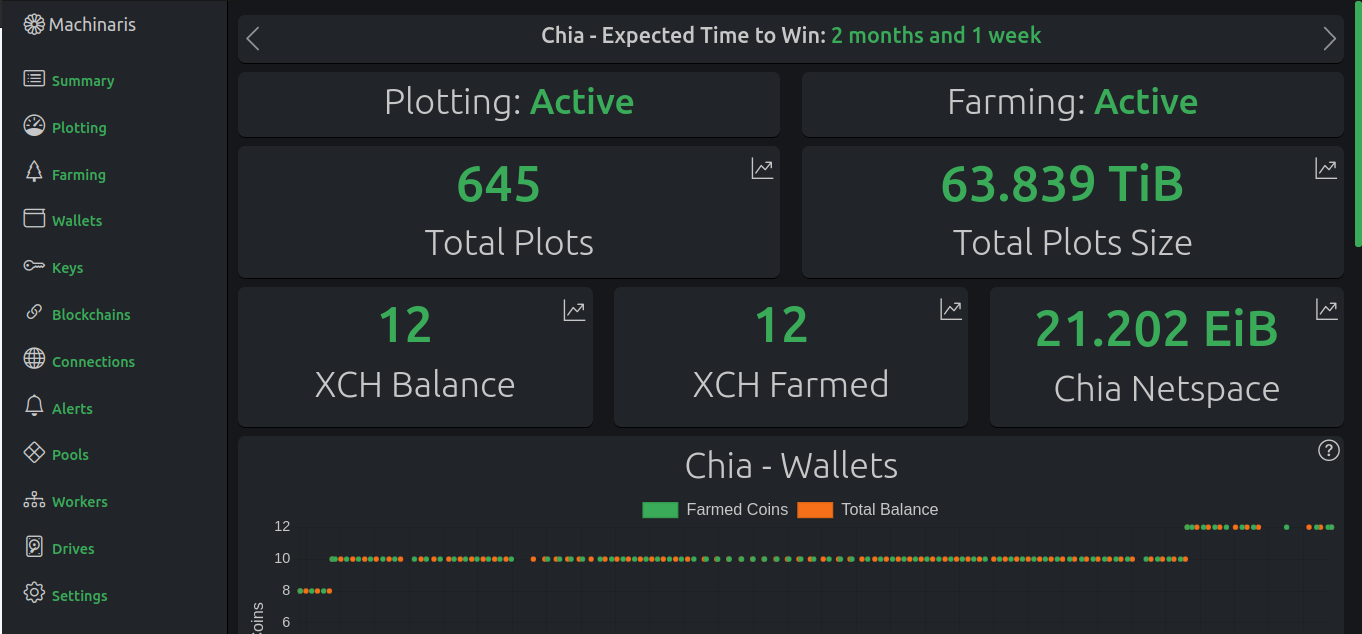
A Docker image for plotting and farming the Chia™ cryptocurrency on one computer or across many.
An easy-to-use WebUI for crypto plotting and farming. Offers Plotman, MadMax, Chiadog, Bladebit, Farmr, and Forktools in a Docker container. Supports Chia, Cactus, Chives, Flax, Flora, HDDCoin, Maize

A grammar of graphics for Python
plotnine Latest Release License DOI Build Status Coverage Documentation plotnine is an implementation of a grammar of graphics in Python, it is based

Simple, concise geographical visualization in Python
Geographic visualizations for HoloViews. Build Status Coverage Latest dev release Latest release Docs What is it? GeoViews is a Python library that ma
With Holoviews, your data visualizes itself.
HoloViews Stop plotting your data - annotate your data and let it visualize itself. HoloViews is an open-source Python library designed to make data a

A high-level plotting API for pandas, dask, xarray, and networkx built on HoloViews
hvPlot A high-level plotting API for the PyData ecosystem built on HoloViews. Build Status Coverage Latest dev release Latest release Docs What is it?
With Holoviews, your data visualizes itself.
HoloViews Stop plotting your data - annotate your data and let it visualize itself. HoloViews is an open-source Python library designed to make data a
![Python histogram library - histograms as updateable, fully semantic objects with visualization tools. [P]ython [HYST]ograms.](https://github.com/janpipek/physt/raw/dev/doc/heights.png)
Python histogram library - histograms as updateable, fully semantic objects with visualization tools. [P]ython [HYST]ograms.
physt P(i/y)thon h(i/y)stograms. Inspired (and based on) numpy.histogram, but designed for humans(TM) on steroids(TM). The goal is to unify different
Area-weighted venn-diagrams for Python/matplotlib
Venn diagram plotting routines for Python/Matplotlib Routines for plotting area-weighted two- and three-circle venn diagrams. Installation The simples

A Python package to create, run, and post-process MODFLOW-based models.
Version 3.3.5 — release candidate Introduction FloPy includes support for MODFLOW 6, MODFLOW-2005, MODFLOW-NWT, MODFLOW-USG, and MODFLOW-2000. Other s
This package creates clean and beautiful matplotlib plots that work on light and dark backgrounds
This package creates clean and beautiful matplotlib plots that work on light and dark backgrounds. Inspired by the work of Edward Tufte.
termplotlib is a Python library for all your terminal plotting needs.
termplotlib termplotlib is a Python library for all your terminal plotting needs. It aims to work like matplotlib. Line plots For line plots, termplot

Resources for teaching & learning practical data visualization with python.
Practical Data Visualization with Python Overview All views expressed on this site are my own and do not represent the opinions of any entity with whi

3D plotting and mesh analysis through a streamlined interface for the Visualization Toolkit (VTK)
PyVista Deployment Build Status Metrics Citation License Community 3D plotting and mesh analysis through a streamlined interface for the Visualization

A high-level plotting API for pandas, dask, xarray, and networkx built on HoloViews
hvPlot A high-level plotting API for the PyData ecosystem built on HoloViews. Build Status Coverage Latest dev release Latest release Docs What is it?

Portfolio analytics for quants, written in Python
QuantStats: Portfolio analytics for quants QuantStats Python library that performs portfolio profiling, allowing quants and portfolio managers to unde

An intuitive library to add plotting functionality to scikit-learn objects.
Welcome to Scikit-plot Single line functions for detailed visualizations The quickest and easiest way to go from analysis... ...to this. Scikit-plot i

An intuitive library to add plotting functionality to scikit-learn objects.
Welcome to Scikit-plot Single line functions for detailed visualizations The quickest and easiest way to go from analysis... ...to this. Scikit-plot i

Scientific Visualization: Python + Matplotlib
An open access book on scientific visualization using python and matplotlib

Joyplots in Python with matplotlib & pandas :chart_with_upwards_trend:
JoyPy JoyPy is a one-function Python package based on matplotlib + pandas with a single purpose: drawing joyplots (a.k.a. ridgeline plots). The code f

Python library that makes it easy for data scientists to create charts.
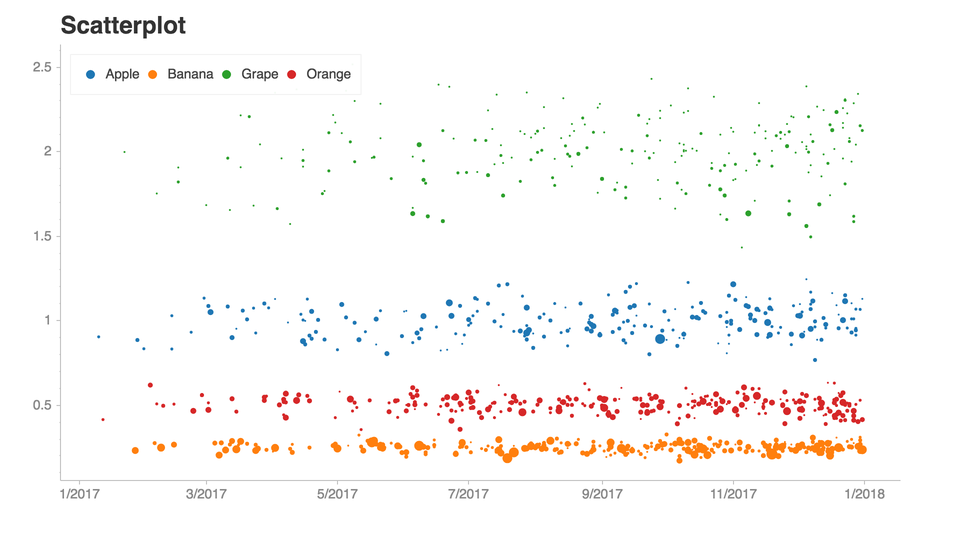
Chartify Chartify is a Python library that makes it easy for data scientists to create charts. Why use Chartify? Consistent input data format: Spend l

Python library that makes it easy for data scientists to create charts.
Chartify Chartify is a Python library that makes it easy for data scientists to create charts. Why use Chartify? Consistent input data format: Spend l

A python package for animating plots build on matplotlib.
animatplot A python package for making interactive as well as animated plots with matplotlib. Requires Python = 3.5 Matplotlib = 2.2 (because slider
Monitor your Binance portfolio
Binance Report Bot The intent of this bot is to take a snapshot of your binance wallet, e.g. the current balances and store it for further plotting. I

ipyvizzu - Jupyter notebook integration of Vizzu
ipyvizzu - Jupyter notebook integration of Vizzu. Tutorial · Examples · Repository About The Project ipyvizzu is the Jupyter Notebook integration of V