Resources for teaching & learning practical data visualization with python.

Overview

Practical Data Visualization with Python

Overview

All views expressed on this site are my own and do not represent the opinions of any entity with which I have been, am now, or will be affiliated.

This repository contains all materials related to a lecture / seminar I teach on practical data visualization with python. What I mean by "practical" is that the materials herein do not focus on one particular library or data visualization method; rather, my goal is to empower the consumer of this content with the tools, heuristics, and methods needed to handle a wide variety of data visualization problems.

If you have questions, comments, or suggested alterations to these materials, please open an issue here on GitHub. Also, don't hesitate to reach out via LinkedIn.

Outline of Materials

Below you'll find a brief outline of the content contained in the four sections of this seminar, along with notebook links, and an example visualization from each section. For each section there is a separate notebook of python code containing all the materials for that section. Each notebook will start with a few setup steps--package imports and data prep mostly--that are almost identical between the notebooks, directly after which comes the content for each section. For information about the data used in these materials, check out the data_prep_nb.ipynb notebook, the easy-to-view version of which is hosted here.

Section 1: Why We Visualize

Here is the link to the easy-to-view notebook for this section of material.
Here is the link to the GitHub-hosted notebook for this section of the material.

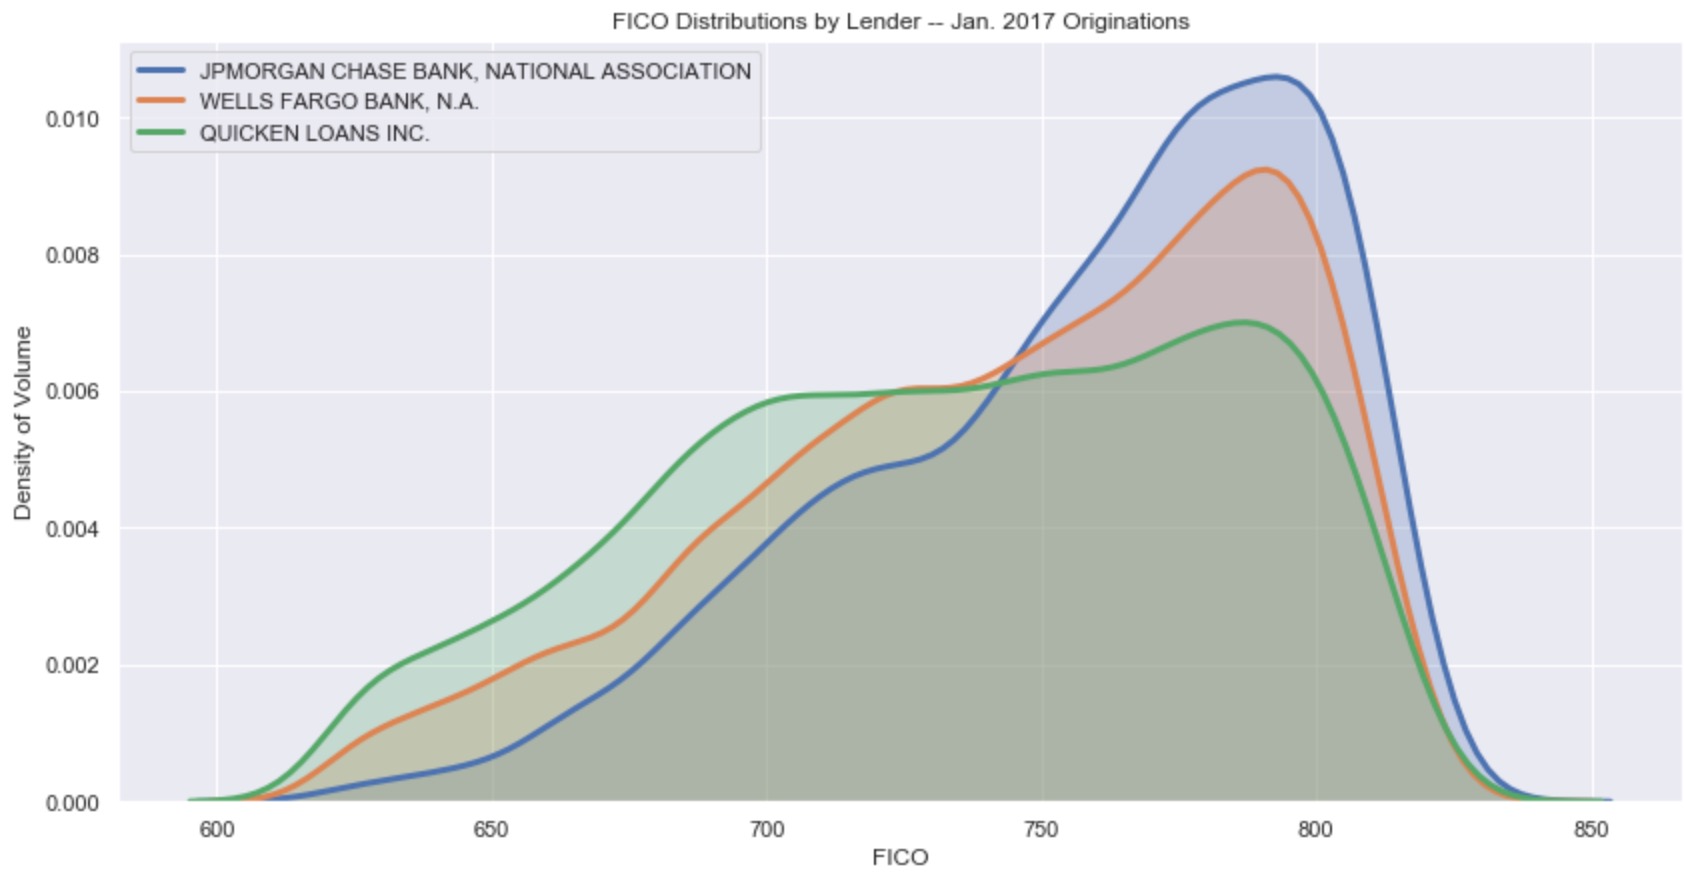
  1. The power of visual data representation and storytelling.
  2. A few principles and heuristics of visualization.
  3. The building blocks of visualization explored.

Example Visualization from this Section:

Section 2: Overview of Python Visualization Landscape

Here is the link to the easy-to-view notebook for this section of material.
Here is the link to the GitHub-hosted notebook for this section of the material.

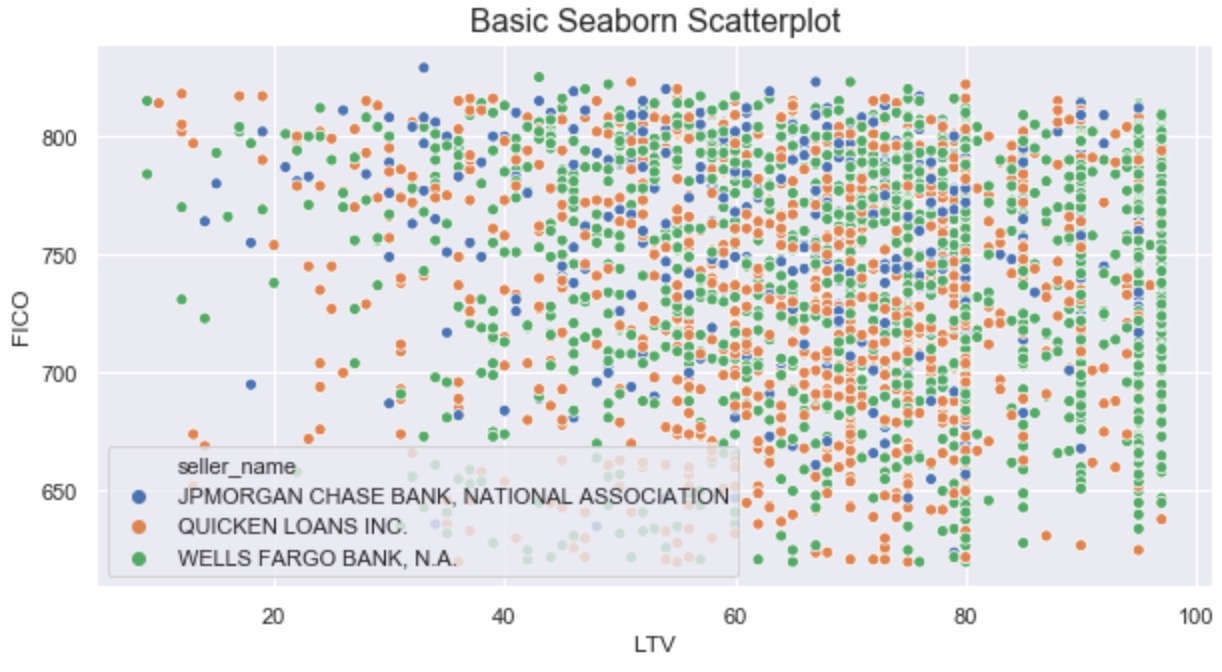
  1. Intro to the visualization ecosystem: python's Tower of Babel.
  2. Smorgasbord of packages explored through a single example viz.
  3. Quick & dirty (and subjective) heuristics for picking a visualization package.

Example Visualization from this Section:

Section 3: Statistical Visualization in the Wild

Here is the link to the easy-to-view notebook for this section of material.
Here is the link to the GitHub-hosted notebook for this section of the material.

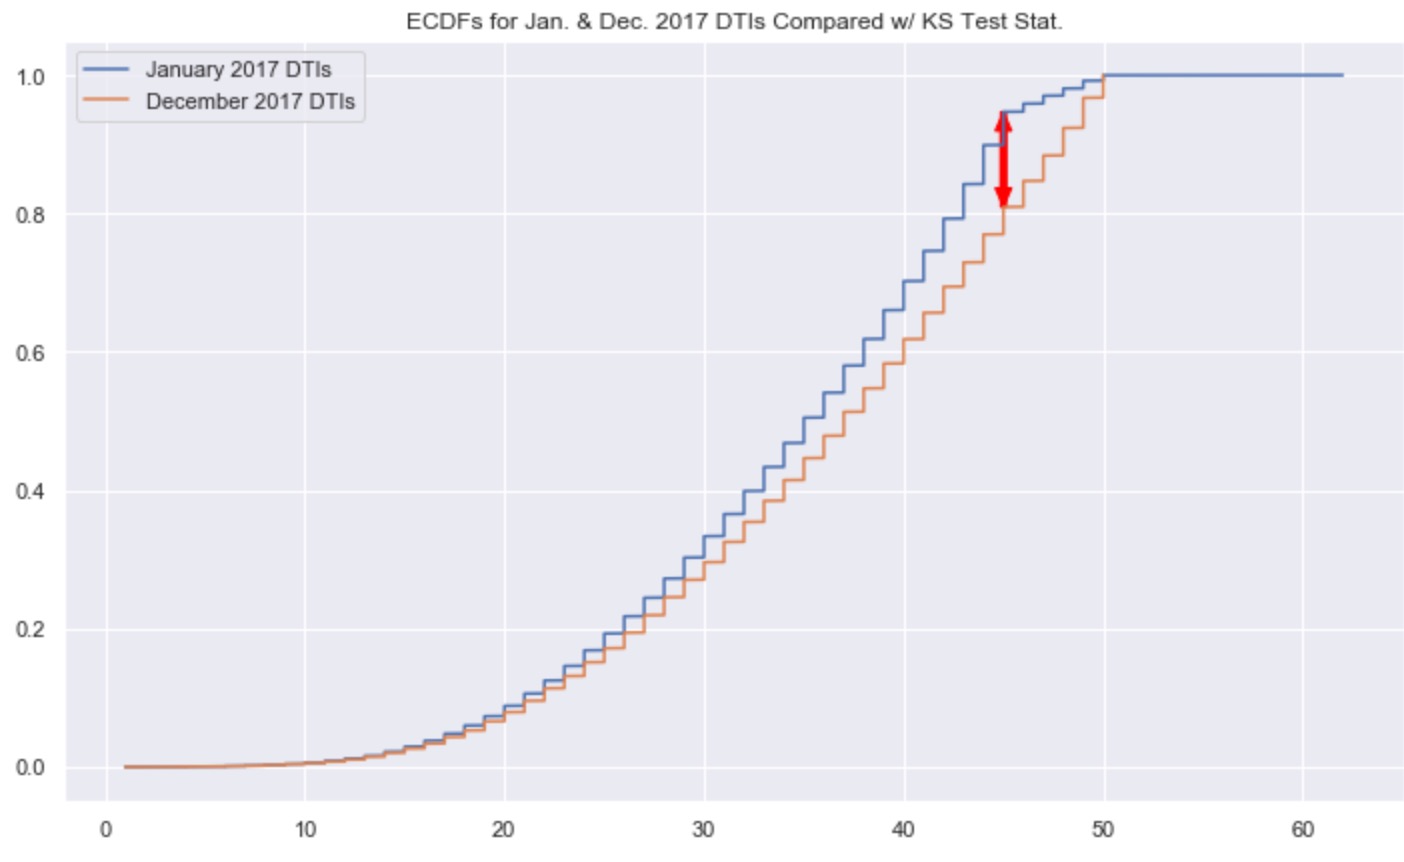
  1. Example business use case of data visualization:
    1. Observational:
      • mean, median, and variance
      • distributions
    2. Inferential:
      • parametric tests
      • non-parametric tests

Example Visualization from this Section:

Section 4: Library Deep-Dive (Plotly)

Here is the link to the easy-to-view notebook for this section of material.
Here is the link to the GitHub-hosted notebook for this section of the material.

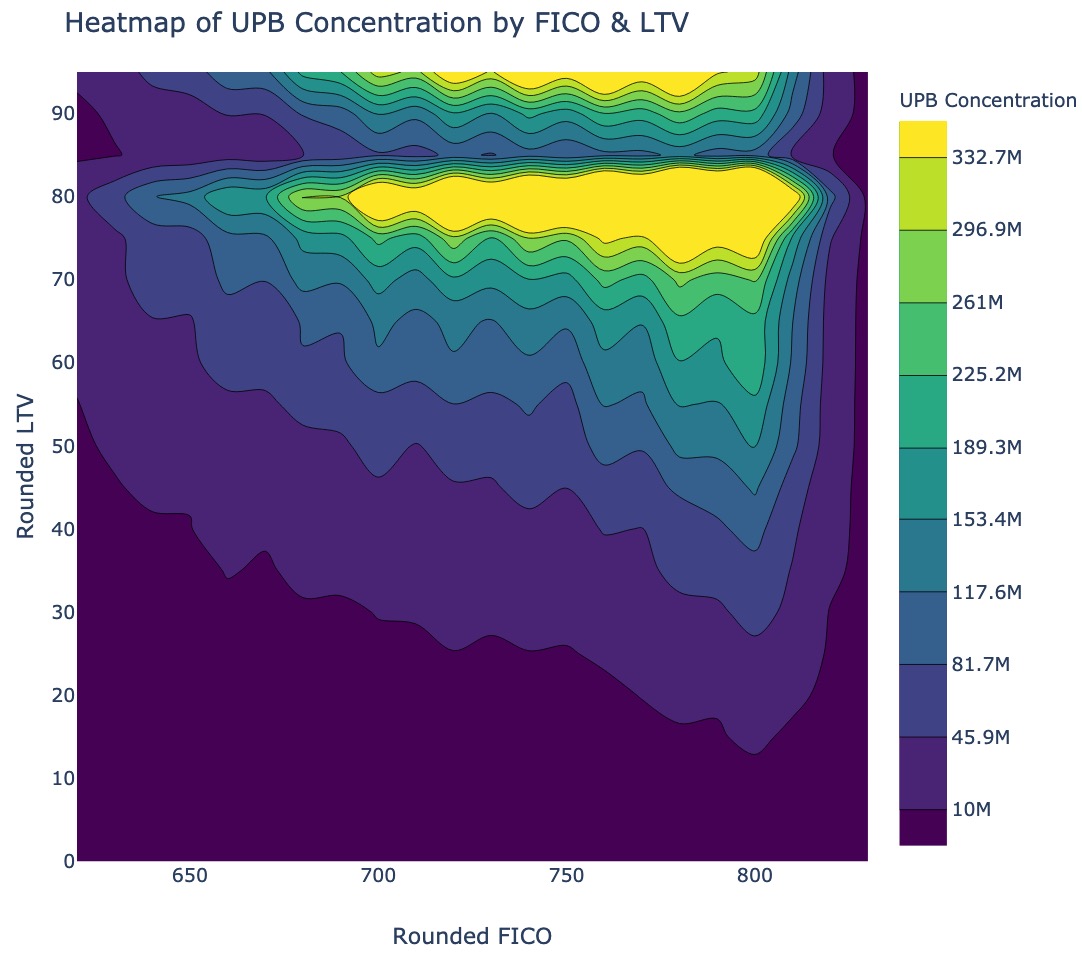
  1. Quick and simple data visualizations with Plotly Express.
  2. Additional control and complexity with base Plotly.

Example Visualization from this Section:

Homework Exercises

There is a homework associated with these materials, for those interested. Given the open-ended nature of the homework, there is no answer key. That said, if you're working through it and would like some feedback, feel free to reach out to me via LinkedIn.

Here is the link to the easy-to-view homework notebook.
Here is the link to the GitHub-hosted version of the homework notebook.

Setup Instructions

  • clone this repository
  • create a virtual environment using python3 -m venv env
  • activate that virtual environment using source env/bin/activate
  • install needed packages using pip install -r requirements.txt
  • run an instance of jupyter lab out of your virutal env using env/bin/jupyter-lab
  • open and run the four main files of content for this course--one for each section:
    • part_1_main_nb.ipynb
    • part_2_main_nb.ipynb
    • part_3_main_nb.ipynb
    • part_4_main_nb.ipynb
Owner
Paul Jeffries
Trained in intl. econ; started in mortgage finance; dabbled in equities & crypto; now working in banking. I enjoy challenging questions regarding value & risk.
Paul Jeffries
VDLdraw - Batch plot the log files exported from VisualDL using Matplotlib

VDLdraw Batch plot the log files exported from VisualDL using Matplotlib. At pre

Yizhou Chen 5 Sep 26, 2022
:small_red_triangle: Ternary plotting library for python with matplotlib

python-ternary This is a plotting library for use with matplotlib to make ternary plots plots in the two dimensional simplex projected onto a two dime

Marc 611 Dec 29, 2022
eoplatform is a Python package that aims to simplify Remote Sensing Earth Observation by providing actionable information on a wide swath of RS platforms and provide a simple API for downloading and visualizing RS imagery

An Earth Observation Platform Earth Observation made easy. Report Bug | Request Feature About eoplatform is a Python package that aims to simplify Rem

Matthew Tralka 4 Aug 11, 2022
Data science project for exploratory analysis on the kcse grades dataset (Kamilimu Data Science Track)

Kcse-Data-Analysis Data science project for exploratory analysis on the kcse grades dataset (Kamilimu Data Science Track) Findings The performance of

MUGO BRIAN 1 Feb 23, 2022
SummVis is an interactive visualization tool for text summarization.

SummVis is an interactive visualization tool for analyzing abstractive summarization model outputs and datasets.

Robustness Gym 246 Dec 08, 2022
Automatization of BoxPlot graph usin Python MatPlotLib and Excel

BoxPlotGraphAutomation Automatization of BoxPlot graph usin Python / Excel. This file is an automation of BoxPlot-Graph using python graph library mat

EricAugustin 1 Feb 07, 2022
The interactive graphing library for Python (includes Plotly Express) :sparkles:

plotly.py Latest Release User forum PyPI Downloads License Data Science Workspaces Our recommended IDE for Plotly’s Python graphing library is Dash En

Plotly 12.7k Jan 05, 2023
A high performance implementation of HDBSCAN clustering. http://hdbscan.readthedocs.io/en/latest/

HDBSCAN Now a part of scikit-learn-contrib HDBSCAN - Hierarchical Density-Based Spatial Clustering of Applications with Noise. Performs DBSCAN over va

Leland McInnes 91 Dec 29, 2022
Painlessly create beautiful matplotlib plots.

Announcement Thank you to everyone who has used prettyplotlib and made it what it is today! Unfortunately, I no longer have the bandwidth to maintain

Olga Botvinnik 1.6k Jan 06, 2023
Graphical display tools, to help students debug their class implementations in the Carcassonne family of projects

carcassonne_tools Graphical display tools, to help students debug their class implementations in the Carcassonne family of projects NOTE NOTE NOTE The

1 Nov 08, 2021
Turn a STAC catalog into a dask-based xarray

StackSTAC Turn a list of STAC items into a 4D xarray DataArray (dims: time, band, y, x), including reprojection to a common grid. The array is a lazy

Gabe Joseph 148 Dec 19, 2022
Geospatial Data Visualization using PyGMT

Example script to visualize topographic data, earthquake data, and tomographic data on a map

Utpal Kumar 2 Jul 30, 2022
Visualize your pandas data with one-line code

PandasEcharts 简介 基于pandas和pyecharts的可视化工具 安装 pip 安装 $ pip install pandasecharts 源码安装 $ git clone https://github.com/gamersover/pandasecharts $ cd pand

陈华杰 2 Apr 13, 2022
Rockstar - Makes you a Rockstar C++ Programmer in 2 minutes

Rockstar Rockstar is one amazing library, which will make you a Rockstar Programmer in just 2 minutes. In last decade, people learned C++ in 21 days.

4k Jan 05, 2023
Political elections, appointment, analysis and visualization in Python

Political elections, appointment, analysis and visualization in Python poli-sci-kit is a Python package for political science appointment and election

Andrew Tavis McAllister 9 Dec 01, 2022
Pglive - Pglive package adds support for thread-safe live plotting to pyqtgraph

Live pyqtgraph plot Pglive package adds support for thread-safe live plotting to

Martin Domaracký 15 Dec 10, 2022
Visualize the training curve from the *.csv file (tensorboard format).

Training-Curve-Vis Visualize the training curve from the *.csv file (tensorboard format). Feature Custom labels Curve smoothing Support for multiple c

Luckky 7 Feb 23, 2022
Datapane is the easiest way to create data science reports from Python.

Datapane Teams | Documentation | API Docs | Changelog | Twitter | Blog Share interactive plots and data in 3 lines of Python. Datapane is a Python lib

Datapane 744 Jan 06, 2023
Some method of processing point cloud

Point-Cloud Some method of processing point cloud inversion the completion pointcloud to incomplete point cloud Some model of encoding point cloud to

Tan 1 Nov 19, 2021
High-level geospatial data visualization library for Python.

geoplot: geospatial data visualization geoplot is a high-level Python geospatial plotting library. It's an extension to cartopy and matplotlib which m

Aleksey Bilogur 1k Jan 01, 2023