Painlessly create beautiful matplotlib plots.

Overview

Announcement

Thank you to everyone who has used prettyplotlib and made it what it is today! Unfortunately, I no longer have the bandwidth to maintain prettyplotlib. I recommend using seaborn. Using seaborn, to get the prettyplotlib style, do:

import seaborn as sns
sns.set(style='ticks', palette='Set2')

And to remove "chartjunk", do:

sns.despine()

If you have discrete pull requests, I will accept them, but I personally will no longer fix bugs.

If you are a biological scientist looking for ways to analyze your big-ish (20+ samples) data, check out my main project, flotilla.

Build Status

prettyplotlib

Python matplotlib-enhancer library which painlessly creates beautiful default matplotlib plots. Inspired by Edward Tufte's work on information design and Cynthia Brewer's work on color perception.

I truly believe that scientific progress is impeded when improper data visualizations are used. I spent a lot of time tweaking my figures to make them more understandable, and realized the scientific world could be a better place if the default parameters for plotting libraries followed recent advances in information design research. And thus prettyplotlib was born.

Requirements:

  • matplotlib. Can be installed via pip install matplotlib or easy_install matplotlib
  • brewer2mpl. Can be installed via pip install brewer2mpl or easy_install brewer2mpl

Comparison to matplotlib

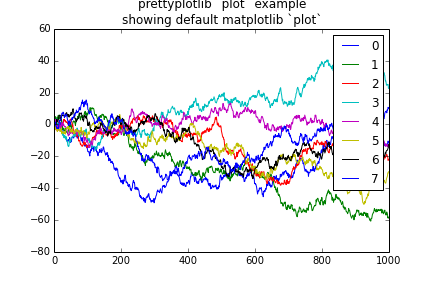
matplotlib default plot
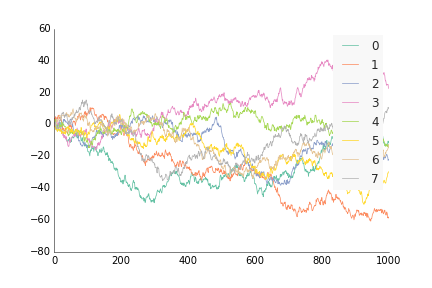
prettyplotlib default plot
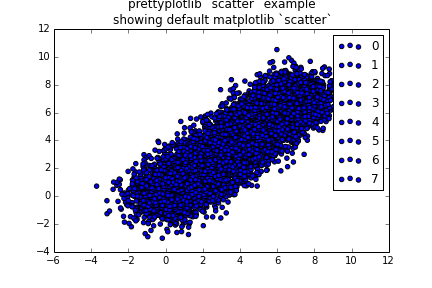
matplotlib default scatter
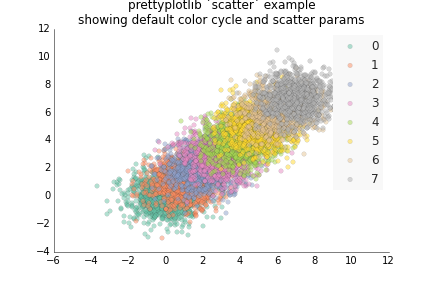
prettyplotlib default scatter
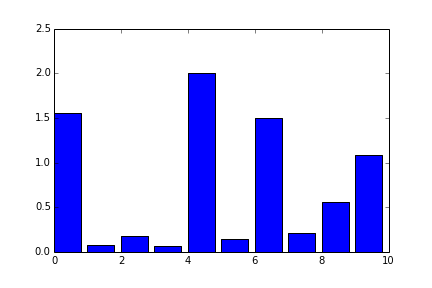
matplotlib default bar
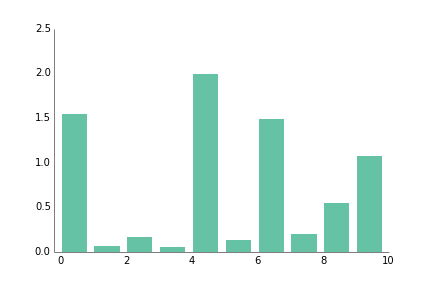
prettyplotlib default bar
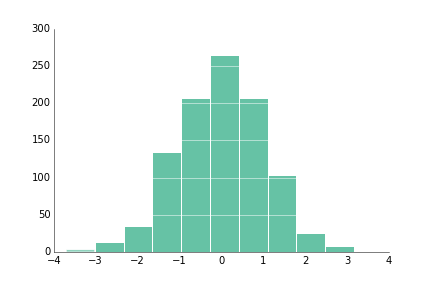
matplotlib default hist
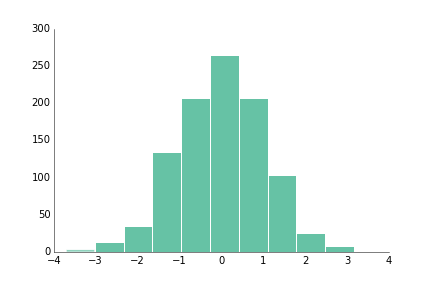
prettyplotlib default hist
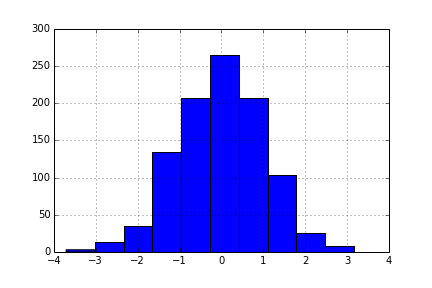
matplotlib default hist
with grid
prettyplotlib default hist
with grid
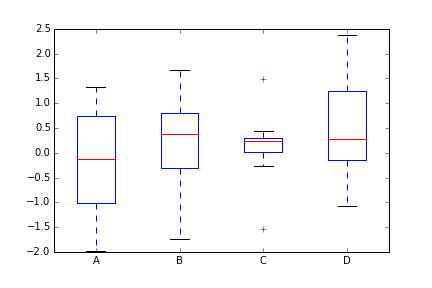
matplotlib default boxplot
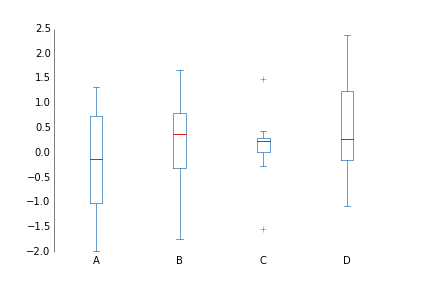
prettyplotlib default boxplot
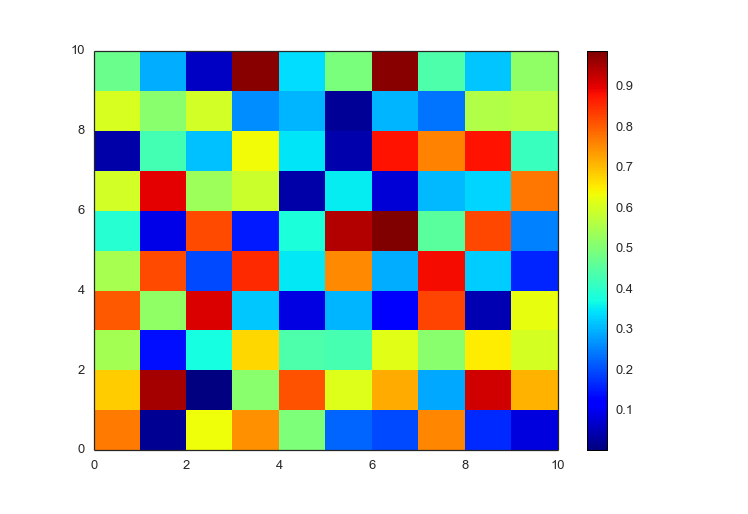
matplotlib default pcolormesh
positive and negative data
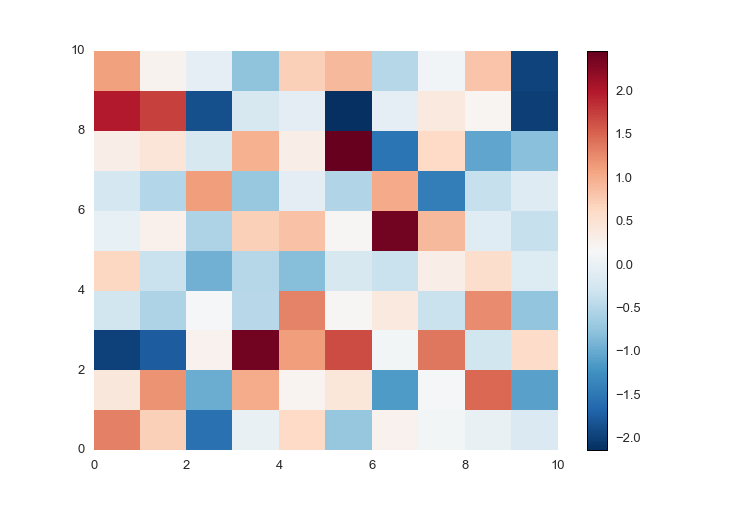
prettyplotlib default pcolormesh
positive and negative data
matplotlib default pcolormesh
positive data only
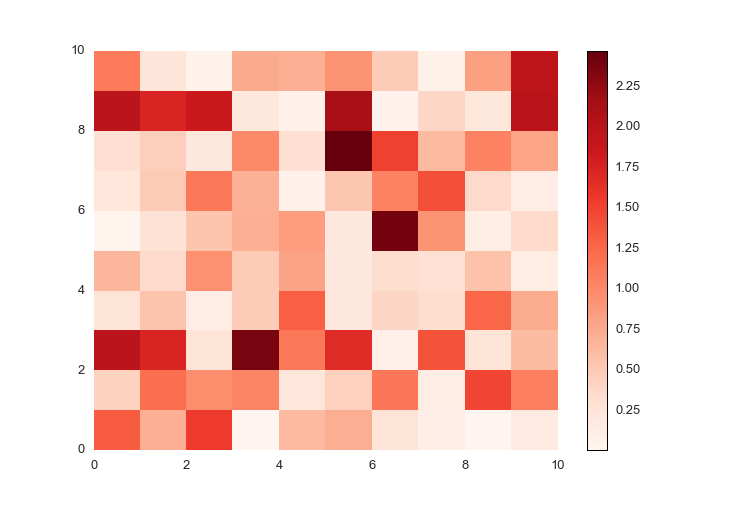
prettyplotlib default pcolormesh
positive data only
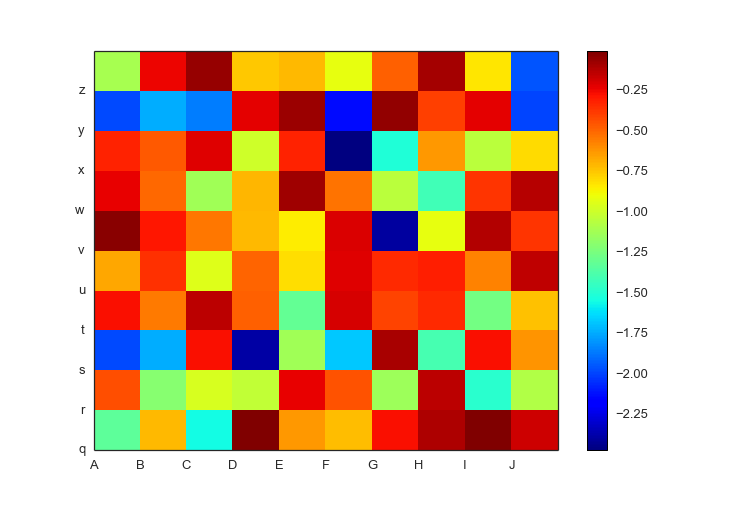
matplotlib pcolormesh
negative-valued data with labels
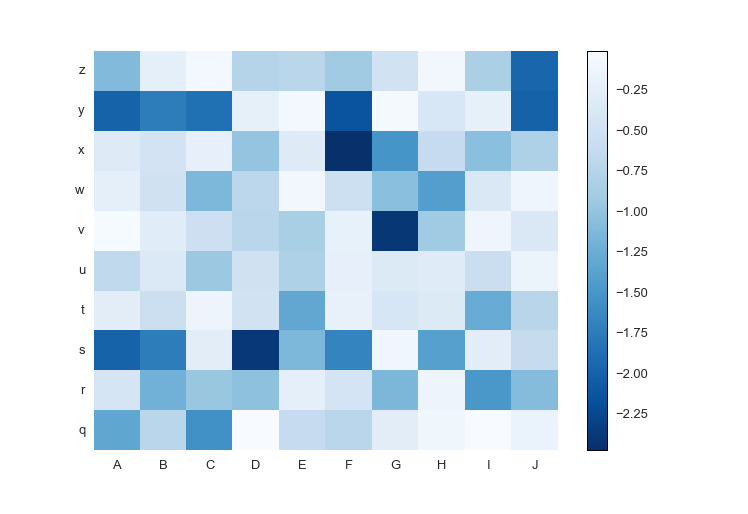
prettyplotlib pcolormesh
negative-valued data with labels

Quotes

"Dis ain't no uglyplotlib" - Anonymous

Owner
Olga Botvinnik
peppy computational biologist
Olga Botvinnik
A programming language built on top of Python to easily allow Swahili speakers to get started with programming without ever knowing English

pyswahili A programming language built over Python to easily allow swahili speakers to get started with programming without ever knowing english pyswa

Jordan Kalebu 72 Dec 15, 2022
Fast scatter density plots for Matplotlib

About Plotting millions of points can be slow. Real slow... 😴 So why not use density maps? ⚡ The mpl-scatter-density mini-package provides functional

Thomas Robitaille 473 Dec 12, 2022
GUI for visualization and interactive editing of SMPL-family body models ie. SMPL, SMPL-X, MANO, FLAME.

Body Model Visualizer Introduction This is a simple Open3D-based GUI for SMPL-family body models. This GUI lets you play with the shape, expression, a

Muhammed Kocabas 207 Jan 01, 2023
CPG represent!

CoolPandasGroup CPG represent! Arianna Brandon Enne Luan Tracie Project requirements: use Pandas to clean and format datasets use Jupyter Notebook to

Enne 3 Feb 07, 2022
A package for plotting maps in R with ggplot2

Attention! Google has recently changed its API requirements, and ggmap users are now required to register with Google. From a user’s perspective, ther

David Kahle 719 Jan 04, 2023
Visualize your pandas data with one-line code

PandasEcharts 简介 基于pandas和pyecharts的可视化工具 安装 pip 安装 $ pip install pandasecharts 源码安装 $ git clone https://github.com/gamersover/pandasecharts $ cd pand

陈华杰 2 Apr 13, 2022
Simple plotting for Python. Python wrapper for D3xter - render charts in the browser with simple Python syntax.

PyDexter Simple plotting for Python. Python wrapper for D3xter - render charts in the browser with simple Python syntax. Setup $ pip install PyDexter

D3xter 31 Mar 06, 2021
A script written in Python that generate output custom color (HEX or RGB input to x1b hexadecimal)

ColorShell ─ 1.5 Planned for v2: setup.sh for setup alias This script converts HEX and RGB code to x1b x1b is code for colorize outputs, works on ou

Riley 4 Oct 31, 2021
Leyna's Visualizing Data With Python

Leyna's Visualizing Data Below is information on the number of bilingual students in three school districts in Massachusetts. You will also find infor

11 Oct 28, 2021
Painlessly create beautiful matplotlib plots.

Announcement Thank you to everyone who has used prettyplotlib and made it what it is today! Unfortunately, I no longer have the bandwidth to maintain

Olga Botvinnik 1.6k Jan 06, 2023
EPViz is a tool to aid researchers in developing, validating, and reporting their predictive modeling outputs.

EPViz (EEG Prediction Visualizer) EPViz is a tool to aid researchers in developing, validating, and reporting their predictive modeling outputs. A lig

Jeff 2 Oct 19, 2022
This package creates clean and beautiful matplotlib plots that work on light and dark backgrounds

This package creates clean and beautiful matplotlib plots that work on light and dark backgrounds. Inspired by the work of Edward Tufte.

Nico Schlömer 205 Jan 07, 2023
A Python wrapper of Neighbor Retrieval Visualizer (NeRV)

PyNeRV A Python wrapper of the dimensionality reduction algorithm Neighbor Retrieval Visualizer (NeRV) Compile Set up the paths in Makefile then make.

2 Aug 29, 2021
A filler visualizer built using python

filler-visualizer 42 filler のログをビジュアライズしてスポーツさながら楽しむことができます! Usage (標準入力でvisualizer.pyに渡せばALL OK) 1. 既にあるログをビジュアライズする $ ./filler_vm -t 3 -p1 john_fill

Takumi Hara 1 Nov 04, 2021
Visualization of numerical optimization algorithms

Visualization of numerical optimization algorithms

Zhengxia Zou 46 Dec 01, 2022
Visualise top-rated GitHub repositories in a barchart by keyword

This python script was written for simple purpose -- to visualise top-rated GitHub repositories in a barchart by keyword. Script generates html-page with barchart and information about repository own

Cur1iosity 2 Feb 07, 2022
A gui application to visualize various sorting algorithms using pure python.

Sorting Algorithm Visualizer A gui application to visualize various sorting algorithms using pure python. Language : Python 3 Libraries required Tkint

Rajarshi Banerjee 19 Nov 30, 2022
Create Badges with stats of Scratch User, Project and Studio. Use those badges in Github readmes, etc.

Scratch-Stats-Badge Create customized Badges with stats of Scratch User, Studio or Project. Use those badges in Github readmes, etc. Examples Document

Siddhesh Chavan 5 Aug 28, 2022
Insert SVGs into matplotlib

Insert SVGs into matplotlib

Andrew White 35 Dec 29, 2022
Machine learning beginner to Kaggle competitor in 30 days. Non-coders welcome. The program starts Monday, August 2, and lasts four weeks. It's designed for people who want to learn machine learning.

30-Days-of-ML-Kaggle 🔥 About the Hands On Program 💻 Machine learning beginner → Kaggle competitor in 30 days. Non-coders welcome The program starts

Roja Achary 145 Jan 01, 2023