阴阳师后台全平台(使用网易 MuMu 模拟器)辅助。支持御魂,觉醒,御灵,结界突破,秘闻副本,地域鬼王。

Overview

阴阳师后台全平台辅助

screen

  • Python 版本:Python 3.8.3
  • 模拟器:网易 MuMu雷电模拟器
  • 模拟器分辨率:1024*576
  • 显卡渲染模式:兼容(OpenGL)
  • 兼容 Windows 系统和 MacOS 系统

思路:

利用 adb 截图后,使用 opencv 找图找色,模拟点击。使用 adb 操作模拟器,相当于后台操作。

我主要为了刷勾玉,所以此工具更侧重地域鬼王,结界突破和秘闻副本,御魂是用来刷突破券的。

为了防止收到鬼使黑的来信,所以增加随机等待的时间比较多,每次随机等待 2-3 秒,导致整体运行速度稍微慢了一些。

此工具适合放在后台干其他工作的同学使用。也比较符合我个人的使用。


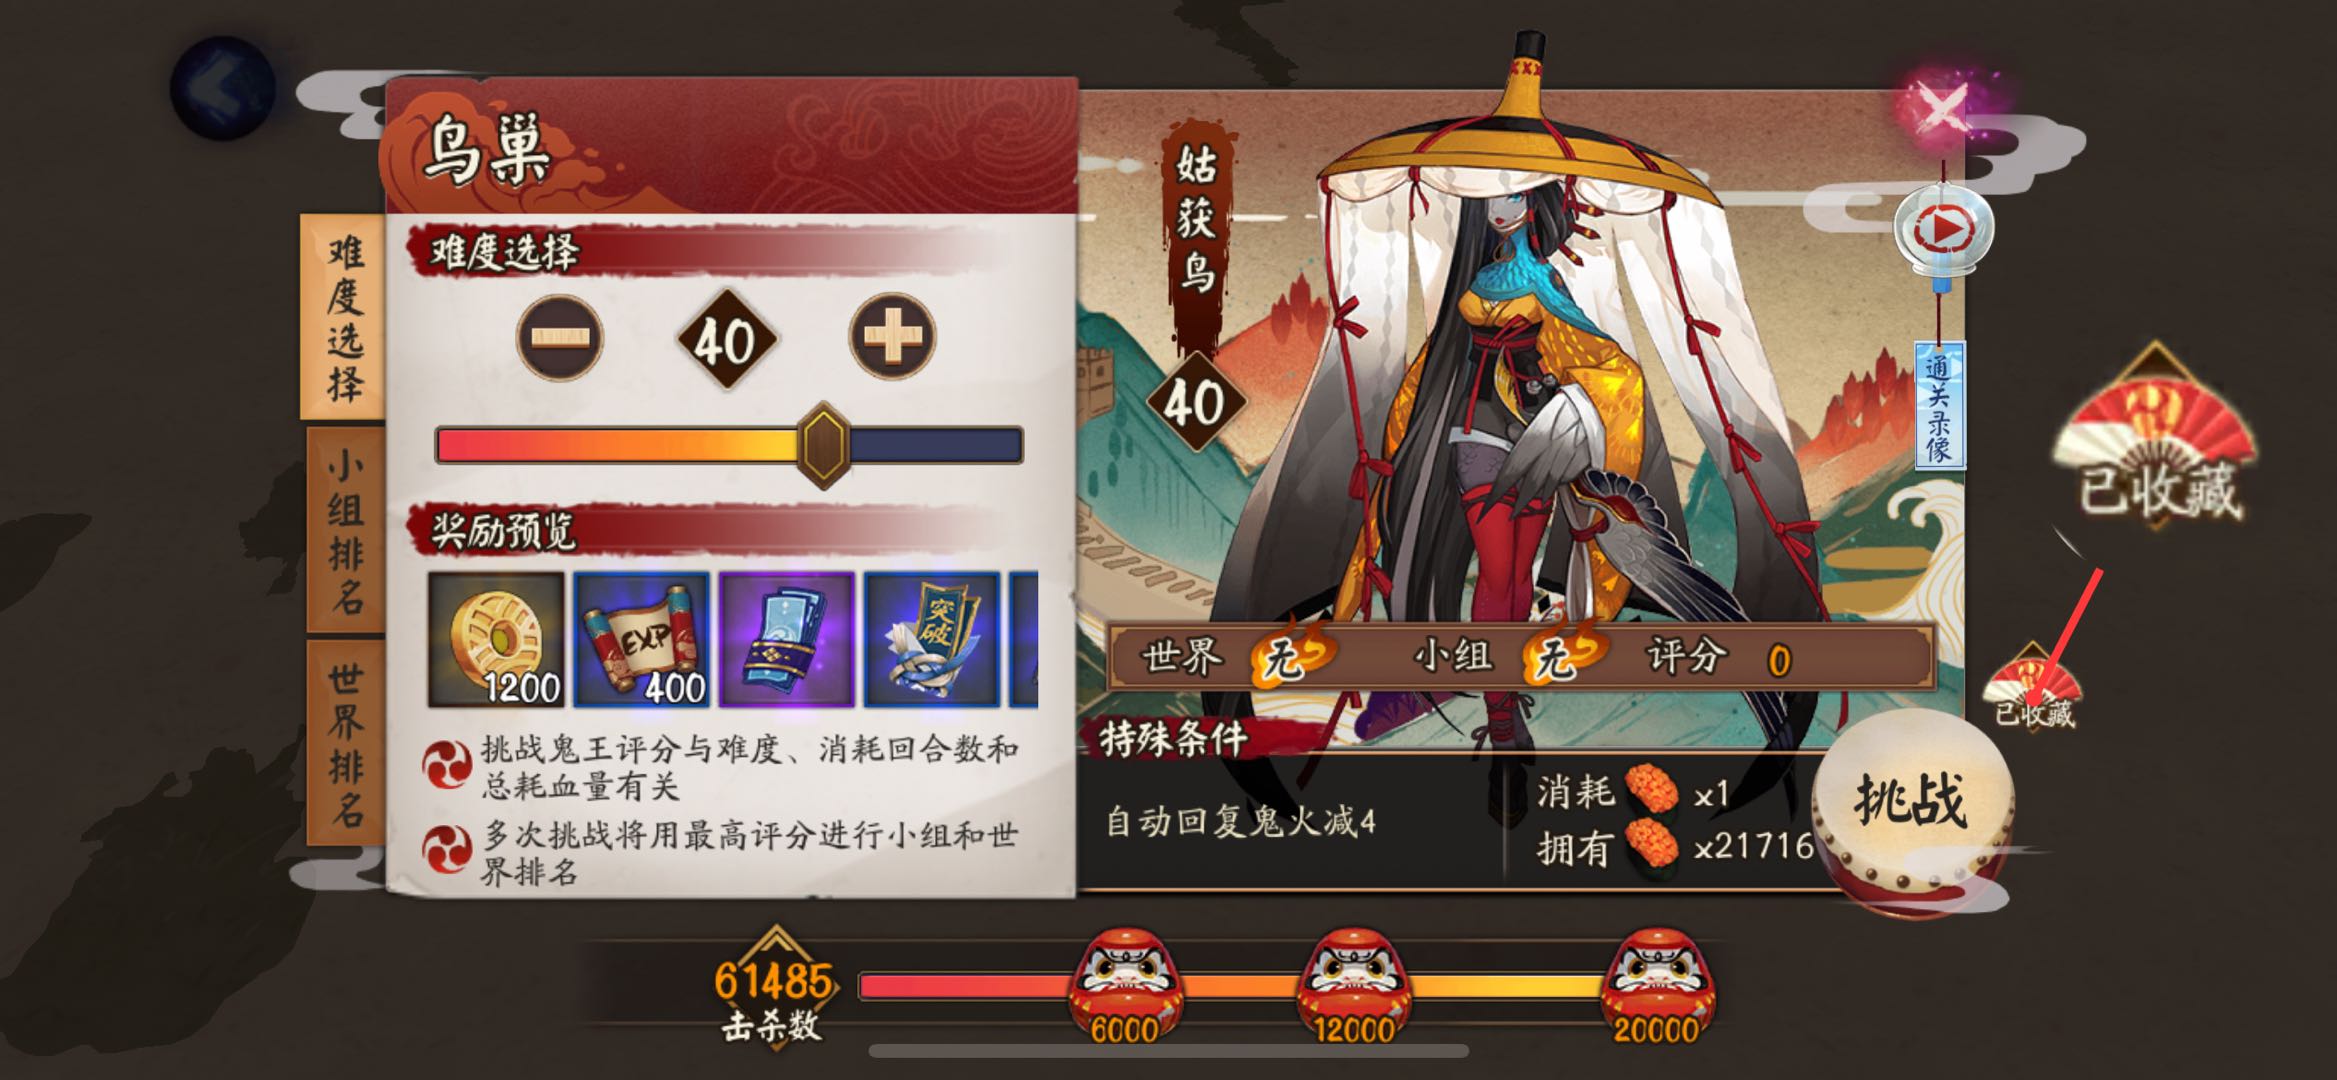
地域鬼王需要先把姑获鸟,以津真天和山童收藏。

收藏

结界突破主要是把九宫格的坐标保存到列表,使用 shuffle 方法随机打乱,然后循环执行。

第一次进入突破会主动失败一次,失败的话难度不会增加,方便刷排名和勾玉使用。

每突破三次会领取一次奖励,等待九次全部完成后,会把右上角突破剩余数量截图上传到腾讯 OCR 识别接口,如果剩余次数大于等于九次,递归执行,否则停止执行。

腾讯 OCR 每月有一千次免费次数。如果只是识别结界券使用,应该是够用了,如果不够用可以按需付费或者自建字典识别。

突破剩余数量

这一步需要申请 腾讯云文字识别 OCR 的 secretId 和 secretKey。

然后新建文件 tencentcloudKeys.py,写入:

secretId = "AKI***********************aYHDtmaOw"
secretKey = "Sg**************************QdZ7X"

模拟器版

部分操作参考 网易 MuMu 开发者必备说明书【雷神命令】常用adb命令整理贴

建议直接看雷神模拟器社区的命令整理,比较详细。

运行阴阳师

如果不清楚应用的启动命令,可以先手动运行该程序,然后使用命令:

adb shell dumpsys window | findstr mCurrentFocus

查找正在运行的应用。

启动阴阳师的命令为:

adb shell am start -n com.netease.onmyoji.netease_simulator/com.netease.onmyoji.Client

因为我是 iOS,只能扫码登录,所以启动命令对我来说并不实用。

模拟点击

例如我们需要点击 500, 266 这个坐标:

adb shell input tap 500 266

模拟滑动

0, 0 滑动到 200, 200,耗时 0.5 秒:

adb shell input swipe 0 0 200 200 500

截图

需要先运行此命令:

adb shell screencap /data/screen.png

再将截图推送到电脑:

adb pull /data/screen.png .

注意:示例中的命令将图片保存到当前路径下。

找图

这里借助 opencv 库实现。

import cv2

def p():
    capture_img = ""  # 程序运行时的截图
    temp_img = ""  # 已经保存好的图片
    
    img1 = cv2.imread(capture_img)
    img2 = cv2.imread(temp_img)
    result = cv2.matchTemplate(img1, img2, cv2.TM_CCOEFF_NORMED)
    
    if result.max() > 0.9:
        return True

找色

如何在截图中获取某坐标的像素值?

import cv2

def p(x, y):
    capture_img = ""
    _img = cv2.imread(capture_img)
    img = cv2.cvtColor(_img, cv2.COLOR_BGR2RGB)
    r, g, b = img[y, x]  # 注意这里的坐标是相反的
    return r, g, b

裁剪图片

我们截图完成以后,如何从截图中获取剩余结界突破数量?

import cv2

capture_img = ""
img = cv2.imread(capture_img)
cv2.imwrite("new.png", img[12:30, 705:750])  # 裁剪坐标为 [y0:y1, x0:x1]

需要注意的是坐标都是 y, x。

双开应用切换

由于多开改版后(2.2.2x86/x64 版本之后)所有的多开应用和原应用都是同一个包名,所以需要通过 UserId 来控制多开的应用。

这里以网易云游戏为例,多开后分别获取包名,使用命令:

adb shell dumpsys window | findstr mCurrentFocus

全部都是 com.netease.android.cloudgame/com.netease.android.cloudgame.MainActivity

所以需要通过切换 UserId 来切换应用。

通过包名来获取对应 UserId:

adb shell ps|findstr com.netease.android.cloudgame

返回如下内容:

对应用户ID

可以看到原端应用的进程 id 是 u0_a36 ,看 _ 前面的 u0 就行,即 UserId=0; 在 MuMu 上一般原端的 UserId=0,多开端 #N1 的 UserId=10,如此类推 #N2 的 UserId=11,#N3 的 UserId=12,#N4 的 UserId=13

所以多开操作分为两步:

  1. 切换 UserId
  2. 打开应用

根据上边的截图,UserId 分别是 0 和 10,如果要在两个应用之间切换可以使用:

# 切换原应用
adb shell am start-user 0
adb shell am start --user 0 com.netease.android.cloudgame/com.netease.android.cloudgame.MainActivity

# 切换多开应用
adb shell am start-user 10
adb shell am start --user 10 com.netease.android.cloudgame/com.netease.android.cloudgame.MainActivity

切换之后就可以继续操作了。

赞赏

Owner
简讯
简讯
Python library that makes it easy for data scientists to create charts.

Chartify Chartify is a Python library that makes it easy for data scientists to create charts. Why use Chartify? Consistent input data format: Spend l

Spotify 3.2k Jan 01, 2023
Handout for the tutorial "Creating publication-quality figures with matplotlib"

Handout for the tutorial "Creating publication-quality figures with matplotlib"

JB Mouret 1.9k Jan 02, 2023
A Jupyter - Leaflet.js bridge

ipyleaflet A Jupyter / Leaflet bridge enabling interactive maps in the Jupyter notebook. Usage Selecting a basemap for a leaflet map: Loading a geojso

Jupyter Widgets 1.3k Dec 27, 2022
Create HTML profiling reports from pandas DataFrame objects

Pandas Profiling Documentation | Slack | Stack Overflow Generates profile reports from a pandas DataFrame. The pandas df.describe() function is great

10k Jan 01, 2023
erdantic is a simple tool for drawing entity relationship diagrams (ERDs) for Python data model classes

erdantic is a simple tool for drawing entity relationship diagrams (ERDs) for Python data model classes. Diagrams are rendered using the venerable Graphviz library.

DrivenData 129 Jan 04, 2023
Pyan3 - Offline call graph generator for Python 3

Pyan takes one or more Python source files, performs a (rather superficial) static analysis, and constructs a directed graph of the objects in the combined source, and how they define or use each oth

Juha Jeronen 235 Jan 02, 2023
Create 3d loss surface visualizations, with optimizer path. Issues welcome!

MLVTK A loss surface visualization tool Simple feed-forward network trained on chess data, using elu activation and Adam optimizer Simple feed-forward

7 Dec 21, 2022
A library for bridging Python and HTML/Javascript (via Svelte) for creating interactive visualizations

A library for bridging Python and HTML/Javascript (via Svelte) for creating interactive visualizations

Anthropic 98 Dec 27, 2022
Graphing communities on Twitch.tv in a visually intuitive way

VisualizingTwitchCommunities This project maps communities of streamers on Twitch.tv based on shared viewership. The data is collected from the Twitch

Kiran Gershenfeld 312 Jan 07, 2023
🐞 📊 Ladybug extension to generate 2D charts

ladybug-charts Ladybug extension to generate 2D charts. Installation pip install ladybug-charts QuickStart import ladybug_charts API Documentation Loc

Ladybug Tools 3 Dec 30, 2022
WhatsApp Chat Analyzer is a WebApp and it can be used by anyone to analyze their chat. 😄

WhatsApp-Chat-Analyzer You can view the working project here. WhatsApp chat Analyzer is a WebApp where anyone either tech or non-tech person can analy

Prem Chandra Singh 26 Nov 02, 2022
demir.ai Dataset Operations

demir.ai Dataset Operations With this application, you can have the empty values (nan/null) deleted or filled before giving your dataset to machine le

Ahmet Furkan DEMIR 8 Nov 01, 2022
web application for flight log analysis & review

Flight Review This is a web application for flight log analysis. It allows users to upload ULog flight logs, and analyze them through the browser. It

PX4 Drone Autopilot 145 Dec 20, 2022
A way of looking at COVID-19 data that I haven't seen before.

Visualizing Omicron: COVID-19 Deaths vs. Cases Click here for other countries. Data is from Our World in Data/Johns Hopkins University. About this pro

1 Jan 10, 2022
Plotting library for IPython/Jupyter notebooks

bqplot 2-D plotting library for Project Jupyter Introduction bqplot is a 2-D visualization system for Jupyter, based on the constructs of the Grammar

3.4k Dec 29, 2022
Data-FX is an addon for Blender (2.9) that allows for the visualization of data with different charts

Data-FX Data-FX is an addon for Blender (2.9) that allows for the visualization of data with different charts Currently, there are only 2 chart option

Landon Ferguson 20 Nov 21, 2022
Kglab - an abstraction layer in Python for building knowledge graphs

Graph Data Science: an abstraction layer in Python for building knowledge graphs, integrated with popular graph libraries – atop Pandas, RDFlib, pySHACL, RAPIDS, NetworkX, iGraph, PyVis, pslpython, p

derwen.ai 466 Jan 09, 2023
Simulation du problème de Monty Hall avec Python et matplotlib

Le problème de Monty Hall C'est un jeu télévisé où il y a trois portes sur le plateau de jeu. Seule une de ces portes cache un trésor. Il n'y a rien d

ETCHART YANG 1 Jan 06, 2022
trade bot connected to binance API/ websocket.,, include dashboard in plotly dash to visualize trades and balances

Crypto trade bot 1. What it is Trading bot connected to Binance API. This project made for fun. So ... Do not use to trade live before you have backte

G 3 Oct 07, 2022
This GitHub Repository contains Data Analysis projects that I have completed so far! While most of th project are focused on Data Analysis, some of them are also put here to show off other skills that I have learned.

Welcome to my Data Analysis projects page! This GitHub Repository contains Data Analysis projects that I have completed so far! While most of th proje

Kyle Dini 1 Jan 31, 2022