Pglive - Pglive package adds support for thread-safe live plotting to pyqtgraph

Overview

Live pyqtgraph plot

Pglive package adds support for thread-safe live plotting to pyqtgraph.
It supports PyQt5 and PyQt6.

Description

By default, pyqtgraph doesn't support live plotting. Aim of this package is to provide easy implementation of Line, Scatter and Bar Live plot. Every plot is connected with it's DataConnector, which sole purpose is to consume data points and manage data re-plotting. DataConnector interface provides Pause and Resume method, update rate and maximum number of plotted points. Each time data point is collected, call DataConnector.cb_set_data or DataConnector.cb_append_data_point callback. That's all You need to update plot with new data. Callbacks are Thread safe, so it works nicely in applications with multiple data collection Threads.

Focus on data collection and leave plotting to pglive.

To make firsts steps easy, package comes with many examples implemented in PyQt5 or PyQt6.

Code examples

import sys
from math import sin
from threading import Thread
from time import sleep

from PyQt6.QtWidgets import QApplication

from pglive.sources.data_connector import DataConnector
from pglive.sources.live_plot import LiveLinePlot
from pglive.sources.live_plot_widget import LivePlotWidget

"""
In this example Line plot is displayed.
"""
app = QApplication(sys.argv)
running = True

plot_widget = LivePlotWidget(title="Line Plot @ 100Hz")
plot_curve = LiveLinePlot()
plot_widget.addItem(plot_curve)
# DataConnector holding 600 points and plots @ 100Hz
data_connector = DataConnector(plot_curve, max_points=600, update_rate=100)


def sin_wave_generator(connector):
    """Sinus wave generator"""
    x = 0
    while running:
        x += 1
        data_point = sin(x * 0.01)
        # Callback to plot new data point
        connector.cb_append_data_point(data_point, x)

        sleep(0.01)


plot_widget.show()
Thread(target=sin_wave_generator, args=(data_connector,)).start()
app.exec()
running = False

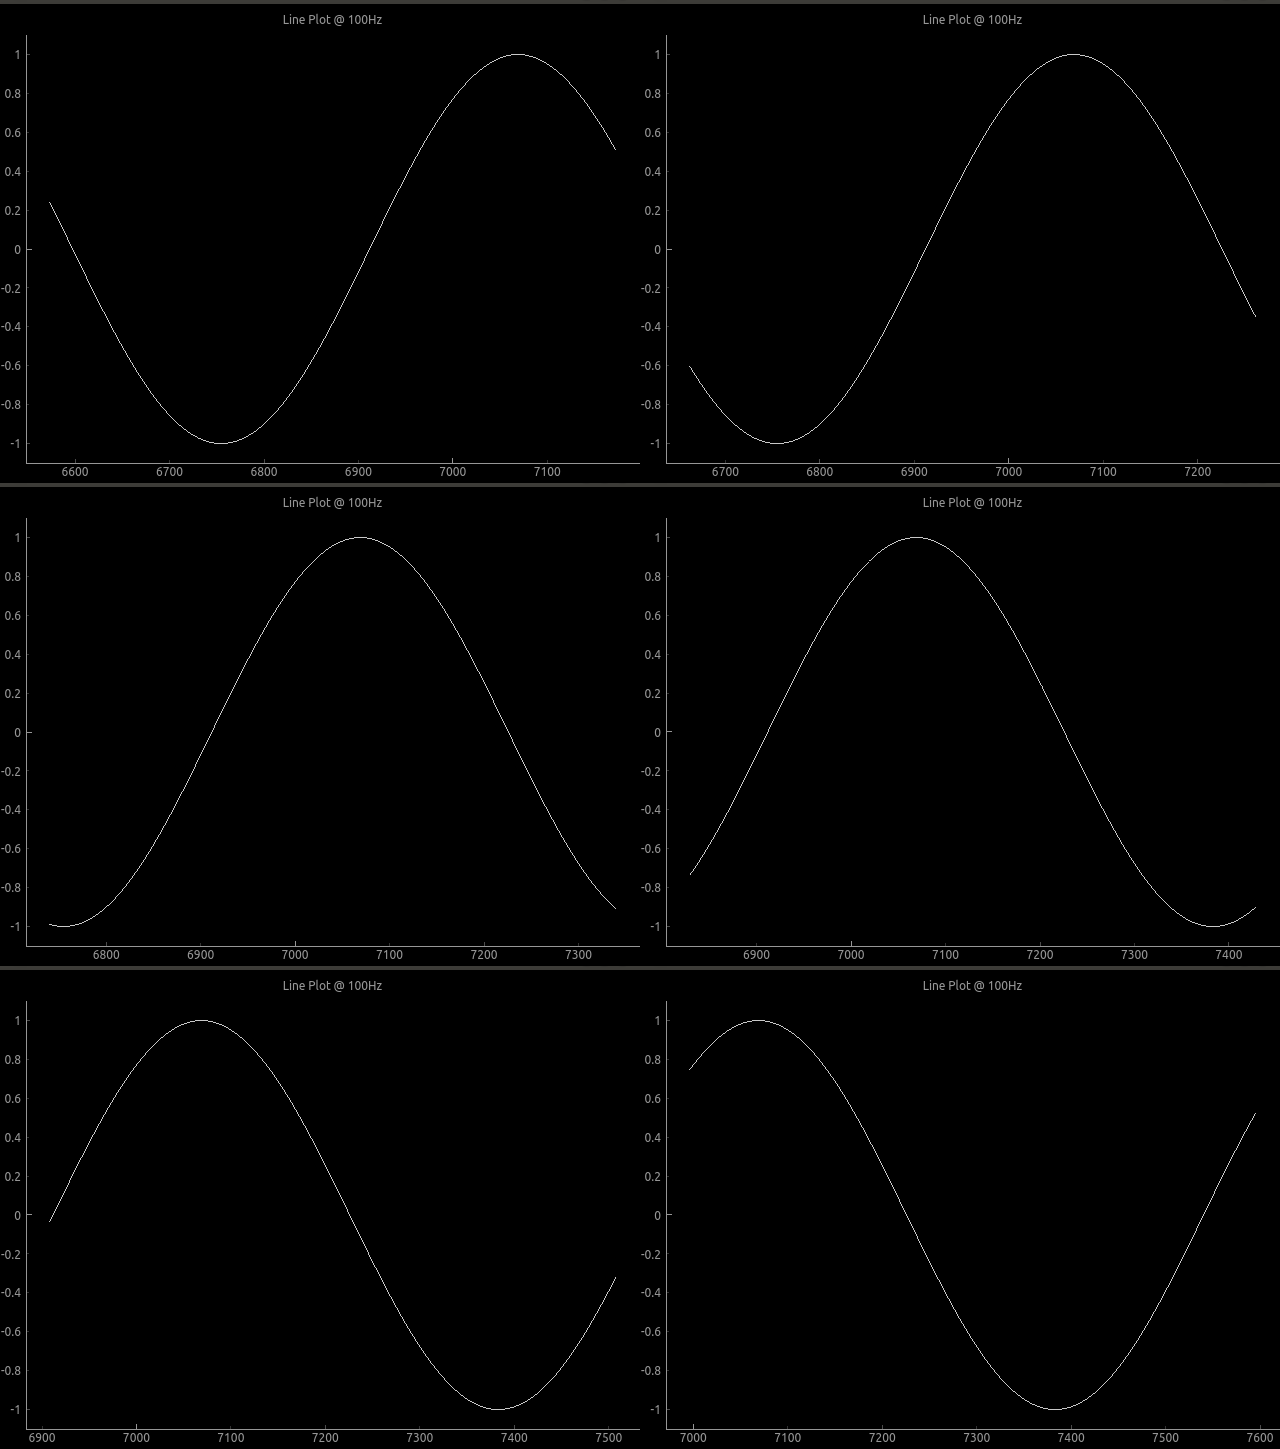
Output:

Plot example

To run built-in examples, use python3 -m parameter like:
python3 -m pglive.examples_pyqt6.all_plot_types
python3 -m pglive.examples_pyqt6.crosshair

Available plot types

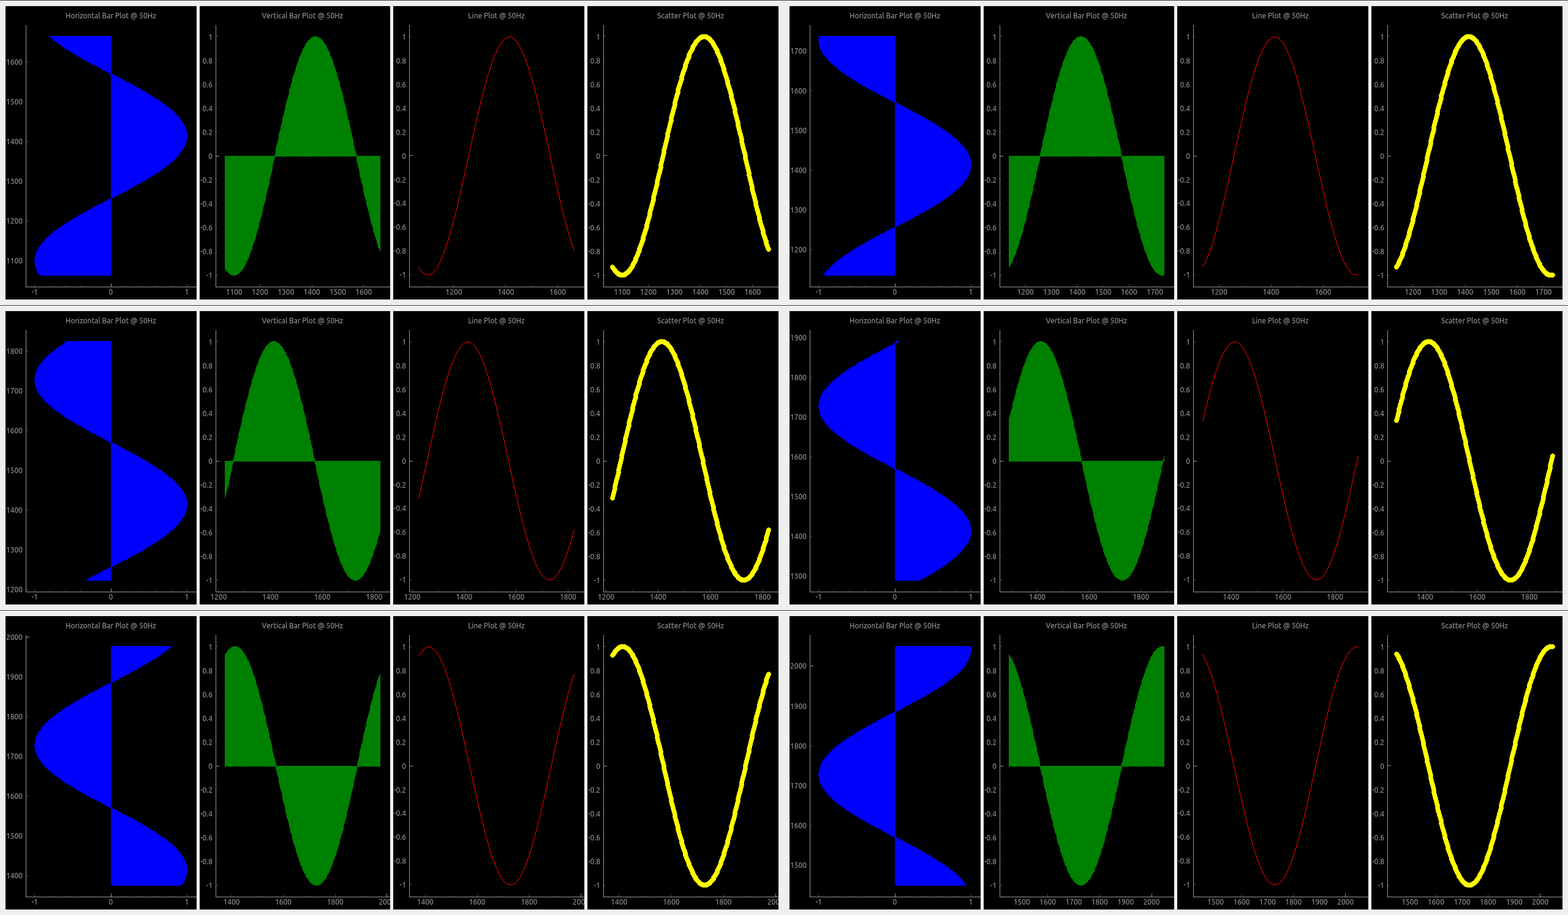
Pglive supports four plot types: LiveLinePlot, LiveScatterPlot, LiveHBarPlot (horizontal bar plot) and LiveVBarPlot (vertical bar plot).

All plot types

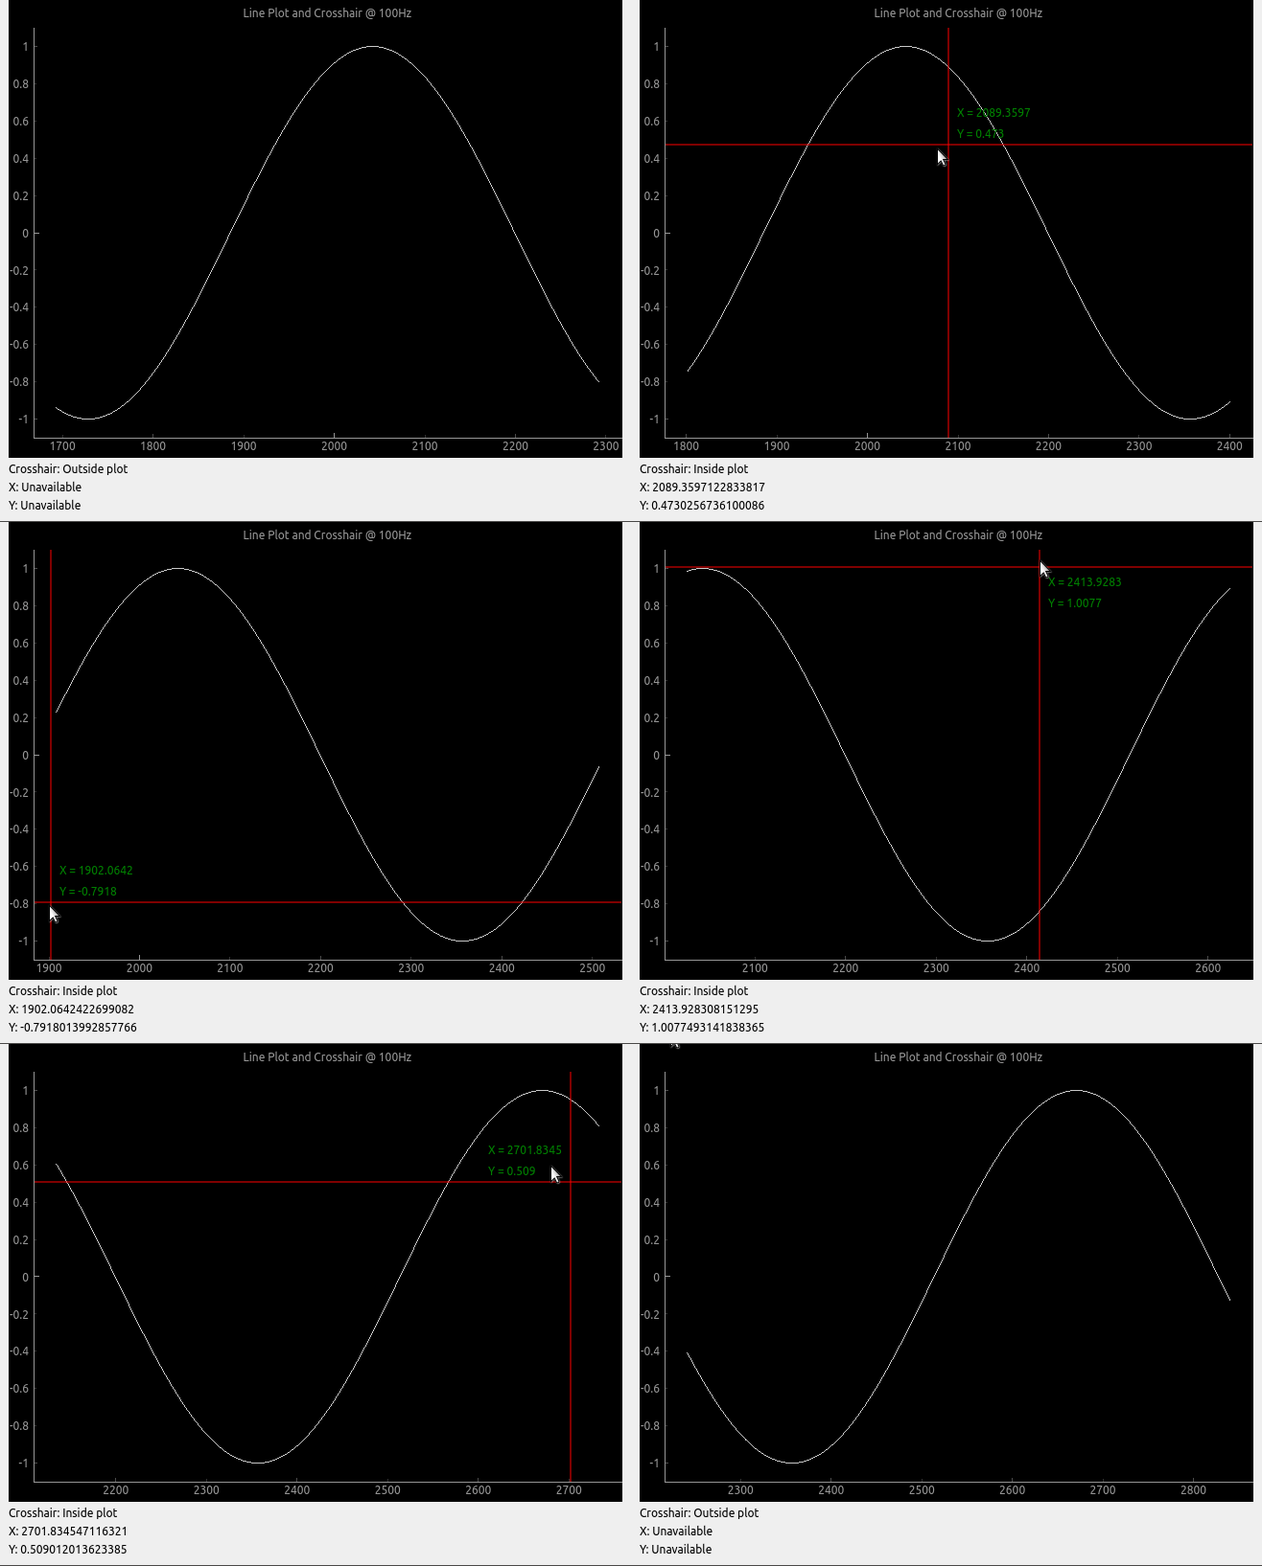
Crosshair

Pglive comes with built-in Crosshair as well.

Crosshair

Axis

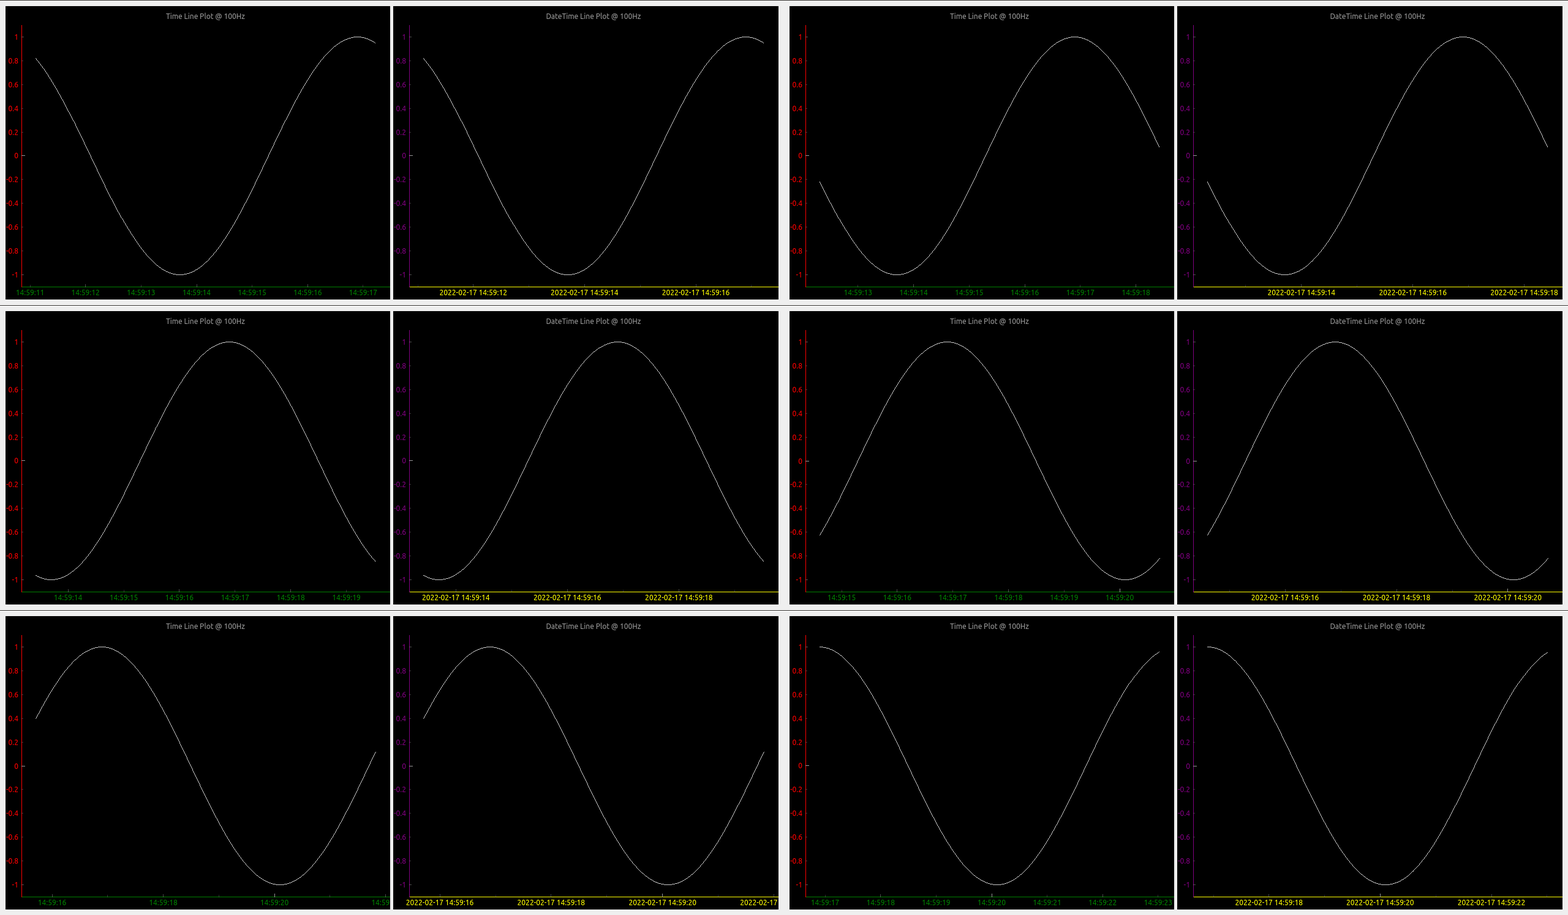
To make life easier, pglive includes few axis improvements:

  • Colored axis line using new axisPen attribute
  • Time and DateTime tick format, converting timestamp into human readable format

Crosshair

Summary

  • With Pglive You've got easy Thread-safe implementation of fast Live plots
  • You can use all kwargs specified in pyqtgraph
  • Focus on Data Handling, not Data Plotting
Comments
  • version 0.4.4 - after cb_set_data, x,y view range is not auto set. whereas it works perfectly in 0.3.3

    version 0.4.4 - after cb_set_data, x,y view range is not auto set. whereas it works perfectly in 0.3.3

    Dear Sir, I have been using pglive 0.3.3 and very much impressed with your work. Thank you very much for developing the module, it really simplifies the development effort to making pyqtgraph live. I use pglive for plotting live stock quote (just a live line plot, i have also tested candleplot too).

    problem : I have recently updated the version to 0.4.4 and my previously working code is not usable now. I use livelineplot, and cb_set_data and cb_append_data_point to load initial data and append live data respectively. In the ver0.3.3, when the initial set of historical data is loaded using cb_set_data, the x,y axis view is is properly set and can see the plot (even if live data is unavailable). Whereas in the ver0.4.4, possibly because of introducing the x and y live axis controller, once initial data is set using cb_set_data , the plot view is blank. Note,I use datetime axis on X. Once cb_set_data command is issued, the x axis defaults to epoch (1970) and y axis is 0 to1. I am unable to autorange even by clicking the 'A' button of pyqtgraph which is on the bottom left.

    However, once the live data arrives, the plot shows up in the view box. Please let me know the method to enable x,y auto range during normal conditions (i.e, prior to the arrival of live data). I need to view historical data sometimes, when the live tick is not available. Actually, I would like to know the autorange command just like we use for pg.PlotWidget so that i can enable it as and when the view changes. I do not want to use pg.PlotWidget commands like setXrange, setLimits etc beacuse it interferes with pglive auto range features during live tick plotting.

    opened by vvdigitaal 9
  • Horizontal Bar chart with categories

    Horizontal Bar chart with categories

    Hello,

    I have successfully been using PGlive for awhile now and love it.

    Can PGlive do Horizontal Bar chart with categories like below?

    Barchart

    If so can you add some details to accomplish this? Categories on the Y-axis and keep the time on the X-axis.

    Thanks for a great charting app!

    opened by optio50 9
  • Append data and set data difference

    Append data and set data difference

    Hi, I am a little confused with cb_set_data and cb_append_data_point. Source code says, it "replaces current data" for cb_set_data, and "appends new data point" for cb_append_data_point. My understanding is that, when using cb_append_data_point, we can retain old data. For instance, if the plot widget is set to max_points of 600, the plot will start scrolling when it reaches max_points, but we will be able to pan and look at the past data if cb_append_data_point is used. Whereas, if we use cb_set_data, points in the view box will be replaced by a new set of data points when max_point is reached. Please let me know if this is correct. Thanks.

    opened by sreekarreddy21 8
  • "cb_append_data_point" leads to runtime error if no existing points are present

    I initialize a LiveLinePlot, which is passed to a DataConnector for later updating. On the first iteration where I try to add a datapoint through the connecter via cb_append_data_point I receive the following error:

    /home/user/.local/lib/python3.10/site-packages/pyqtgraph/debug.py:128: RuntimeWarning: Ignored exception:
    Traceback (most recent call last):
      File "/home/user/path/pysideGUI.py", line 1101, in <module>
        app.exec()
      File "/home/user/.local/lib/python3.10/site-packages/pglive/sources/live_plot_widget.py", line 165, in paintEvent
        return super().paintEvent(ev)
      File "/home/user/.local/lib/python3.10/site-packages/pyqtgraph/widgets/GraphicsView.py", line 137, in paintEvent
        return super().paintEvent(ev)
      File "/home/user/.local/lib/python3.10/site-packages/pyqtgraph/debug.py", line 128, in w
        printExc('Ignored exception:')
      --- exception caught here ---
      File "/home/user/.local/lib/python3.10/site-packages/pyqtgraph/debug.py", line 126, in w
        func(*args, **kwds)
      File "/home/user/.local/lib/python3.10/site-packages/pyqtgraph/graphicsItems/PlotCurveItem.py", line 905, in paint
        p.drawLines(*self._getLineSegments())
    TypeError: QPainter.drawLines() takes exactly one argument (0 given)
      printExc('Ignored exception:')
    

    I've found that checking for the presence of data in the x or y variable in the DataConnector and adding the first datapoint twice if there is none prevents the error from appearing. E.g.:

    if len(connector.x) < 1:
      *add extra datapoint*
    *add datapoint like normal*
    

    It seems like there just needs to be an additional check somewhere(?)

    Using: Python 3.10 pglive 0.5.5

    opened by Obliman 7
  • Crosshair label not formatted

    Crosshair label not formatted

    Not sure if its a bug or simply requires proper formatting on my part. Using bottom_axis = LiveAxis("bottom", **{Axis.TICK_FORMAT: Axis.TIME}) the X crosshair is displayed in raw unformatted epoch time.

    Can you suggest a way to format the X crosshair label when using tick format Time?

    thank you

    opened by optio50 5
  • LiveAxisRange Multiple Plots Auto range if plot turned off.

    LiveAxisRange Multiple Plots Auto range if plot turned off.

    Is LiveAxisRange supposed to work with multiple plots? if you turn one of the plots off with the legend the "A" autorange breaks and plots disappear.

        PV1watts_plot = LiveLinePlot(pen='orange',name='PV-1',fillLevel=0, brush=(213,129,44,100))
        PV2watts_plot = LiveLinePlot(pen='cyan',name='PV-2', fillLevel=0, brush=(102,102,255,100))
    
        # Data connectors for each plot with dequeue of max_points
        self.PV1watts_connector = DataConnector(PV1watts_plot, max_points=48000) 
        self.PV2watts_connector = DataConnector(PV2watts_plot, max_points=48000) 
    
    
        # Setup bottom axis with TIME tick format
        # use Axis.DATETIME to show date
        pv1_watts_bottom_axis = LiveAxis("bottom", **{Axis.TICK_FORMAT: Axis.TIME})
    
        # Create plot
        self.PV1_graph_Widget = LivePlotWidget(title="Charger 1 & 2 Watts 1 Hour of 24",
        axisItems={'bottom': pv1_watts_bottom_axis},
        x_range_controller=LiveAxisRange(roll_on_tick=1800, offset_left=1), **kwargs)
    
        self.PV1_graph_Widget.x_range_controller.crop_left_offset_to_data = True
        
      
        # Show grid
        self.PV1_graph_Widget.showGrid(x=True, y=True, alpha=0.3)
    
        # Set labels
        self.PV1_graph_Widget.setLabel('bottom')
        self.PV1_graph_Widget.setLabel('left', 'Watts')
    
        self.PV1_graph_Widget.addLegend() # If plot is named, auto add name to legend
    
        # Add Line
        self.PV1_graph_Widget.addItem(PV1watts_plot)
        self.PV1_graph_Widget.addItem(PV2watts_plot)
    
        # Add chart to Layout in Qt Designer
        self.PV1_Watts_Layout.addWidget(self.PV1_graph_Widget)
    
    opened by optio50 4
  • Placing the widget into an existing window

    Placing the widget into an existing window

    Thanks for making this. Using your examples I can make a stand alone window with my live data and it looks and works great.

    I am having difficulty placing the widget into an existing window made with PYQT designer. I have promoted a Qwidget to a PlotWidget class but cannot figure out how to embed it into the promoted widget.

    Can you include an example how this might be achieved?

    Thank you.

    opened by optio50 4
  • Support for

    Support for "connect" attribute of pyqtgraph PlotDataItem/PlotCurveItem?

    Per the pyqtgraph documentation it's possible to specify the connectivity of data points on a line plot via the PlotDataItem:

    connect supports the following arguments:
    
    - ‘all’ connects all points.- 
    - ‘pairs’ generates lines between every other point.- 
    - ‘finite’ creates a break when a nonfinite points is encountered.- 
    - If an ndarray is passed, it should contain N int32 values of 0 or 1. Values of 1 indicate that the respective point will be connected to the next.- 
    - In the default ‘auto’ mode, PlotDataItem will normally use ‘all’, but if any nonfinite data points are detected, it will automatically switch to ‘finite’.
    

    The connect arg is also found in the PlotCurveItem.setData() function.

    Is this supported in pglive? I haven't found anything for it so far.

    opened by Obliman 2
  • Question: If using

    Question: If using "Promoted Widget", How to add LivePlotWidget(title=...., axisItems=......, **kwargs)

    I don't normally use a promoted widget but thought I would try it out in QT Designer. Normally I create the widget manually. If it's promoted and created in the QT Designer how do I add, LivePlotWidget(title="Chart Title", axisItems={'bottom': bottom_axis}, **kwargs)

    I can add title with .setLabels I can add axisItems with .setAxisItems

    Those are done with pyqtgraph options. How do I add ** kwargs that recognize the pglive crosshairs?

    Can it all be done with a one liner like I normally do with a widget created manually?

    I know you're busy. Thanks for looking.

    opened by optio50 2
  • Question: Autoscale plots when legend item is turned off

    Question: Autoscale plots when legend item is turned off

    I cant determine if this is a pyqtgraph function or PGlive.

    A graph with multiple plots and a legend. If you click an item in the legend box its plot is turned off in the graph. (its still collecting data)

    What I have is three plots with what can be large variations in Y axis values. I was hoping to autorange the remaining plots when a plot is turned off from the legend. For example below. Turn off Watts and have Volts and Amps auto scale for best viewable resolution. legend-plots

    opened by optio50 2
  • Question: Are Crosshairs expected to work with the Categorized Bar Chart?

    Question: Are Crosshairs expected to work with the Categorized Bar Chart?

    Are Crosshairs expected to work with the Categorized Bar Chart?

    I think I would only need it for the Date Time Axis to see preciously when the state changed happened.

    opened by optio50 2
Releases(v0.5.6)
Owner
Martin Domaracký
Martin Domaracký
Statistics and Visualization of acceptance rate, main keyword of CVPR 2021 accepted papers for the main Computer Vision conference (CVPR)

Statistics and Visualization of acceptance rate, main keyword of CVPR 2021 accepted papers for the main Computer Vision conference (CVPR)

Hoseong Lee 78 Aug 23, 2022
Make scripted visualizations in blender

Scripted visualizations in blender The goal of this project is to script 3D scientific visualizations using blender. To achieve this, we aim to bring

Praneeth Namburi 10 Jun 01, 2022
Automatization of BoxPlot graph usin Python MatPlotLib and Excel

BoxPlotGraphAutomation Automatization of BoxPlot graph usin Python / Excel. This file is an automation of BoxPlot-Graph using python graph library mat

EricAugustin 1 Feb 07, 2022
Multi-class confusion matrix library in Python

Table of contents Overview Installation Usage Document Try PyCM in Your Browser Issues & Bug Reports Todo Outputs Dependencies Contribution References

Sepand Haghighi 1.3k Dec 31, 2022
在原神中使用围栏绘图

yuanshen_draw 在原神中使用围栏绘图 文件说明 toLines.py 将一张图片转换为对应的线条集合,视频可以按帧转换。 draw.py 在原神家园里绘制一张线条图。 draw_video.py 在原神家园里绘制视频(自动按帧摆放,截图(win)并回收) cat_to_video.py

14 Oct 08, 2022
Simple spectra visualization tool for astronomers

SpecViewer A simple visualization tool for astronomers. Dependencies Python = 3.7.4 PyQt5 = 5.15.4 pyqtgraph == 0.10.0 numpy = 1.19.4 How to use py

5 Oct 07, 2021
A tool for creating SVG timelines from simple JSON input.

A tool for creating SVG timelines from simple JSON input.

Jason Reisman 432 Dec 30, 2022
CLAHE Contrast Limited Adaptive Histogram Equalization

A simple code to process images using contrast limited adaptive histogram equalization. Image processing is becoming a major part of data processig.

Happy N. Monday 4 May 18, 2022
Missing data visualization module for Python.

missingno Messy datasets? Missing values? missingno provides a small toolset of flexible and easy-to-use missing data visualizations and utilities tha

Aleksey Bilogur 3.4k Dec 29, 2022
Handout for the tutorial "Creating publication-quality figures with matplotlib"

Handout for the tutorial "Creating publication-quality figures with matplotlib"

JB Mouret 1.9k Jan 02, 2023
Streamlit component for Let's-Plot visualization library

streamlit-letsplot This is a work-in-progress, providing a convenience function to plot charts from the Lets-Plot visualization library. Example usage

Randy Zwitch 9 Nov 03, 2022
Plot, scatter plots and histograms in the terminal using braille dots

Plot, scatter plots and histograms in the terminal using braille dots, with (almost) no dependancies. Plot with color or make complex figures - similar to a very small sibling to matplotlib. Or use t

Tammo Ippen 207 Dec 30, 2022
This is a place where I'm playing around with pandas to analyze data in a csv/excel file.

pandas-csv-excel-analysis This is a place where I'm playing around with pandas to analyze data in a csv/excel file. 0-start A very simple cheat sheet

Chuqin 3 Oct 05, 2022
Matplotlib JOTA style for making figures

Matplotlib JOTA style for making figures This repo has Matplotlib JOTA style to format plots and figures for publications and presentation.

JOTA JORNALISMO 2 May 05, 2022
D-Analyst : High Performance Visualization Tool

D-Analyst : High Performance Visualization Tool D-Analyst is a high performance data visualization built with python and based on OpenGL. It allows to

4 Apr 14, 2022
This is a sorting visualizer made with Tkinter.

Sorting-Visualizer This is a sorting visualizer made with Tkinter. Make sure you've installed tkinter in your system to use this visualizer pip instal

Vishal Choubey 7 Jul 06, 2022
Visualize the training curve from the *.csv file (tensorboard format).

Training-Curve-Vis Visualize the training curve from the *.csv file (tensorboard format). Feature Custom labels Curve smoothing Support for multiple c

Luckky 7 Feb 23, 2022
The plottify package is makes matplotlib plots more legible

plottify The plottify package is makes matplotlib plots more legible. It's a thin wrapper around matplotlib that automatically adjusts font sizes, sca

Andy Jones 97 Nov 04, 2022
A set of useful perceptually uniform colormaps for plotting scientific data

Colorcet: Collection of perceptually uniform colormaps Build Status Coverage Latest dev release Latest release Docs What is it? Colorcet is a collecti

HoloViz 590 Dec 31, 2022
Moscow DEG 2021 elections plots

Построение графиков на основе публичных данных о ДЭГ в Москве в 2021г. Описание Скрипты в данном репозитории позволяют собственноручно построить графи

9 Jul 15, 2022