Lime: Explaining the predictions of any machine learning classifier

Overview

lime

Build Status Binder

This project is about explaining what machine learning classifiers (or models) are doing. At the moment, we support explaining individual predictions for text classifiers or classifiers that act on tables (numpy arrays of numerical or categorical data) or images, with a package called lime (short for local interpretable model-agnostic explanations). Lime is based on the work presented in this paper (bibtex here for citation). Here is a link to the promo video:

KDD promo video

Our plan is to add more packages that help users understand and interact meaningfully with machine learning.

Lime is able to explain any black box classifier, with two or more classes. All we require is that the classifier implements a function that takes in raw text or a numpy array and outputs a probability for each class. Support for scikit-learn classifiers is built-in.

Installation

The lime package is on PyPI. Simply run:

pip install lime

Or clone the repository and run:

pip install .

We dropped python2 support in 0.2.0, 0.1.1.37 was the last version before that.

Screenshots

Below are some screenshots of lime explanations. These are generated in html, and can be easily produced and embedded in ipython notebooks. We also support visualizations using matplotlib, although they don't look as nice as these ones.

Two class case, text

Negative (blue) words indicate atheism, while positive (orange) words indicate christian. The way to interpret the weights by applying them to the prediction probabilities. For example, if we remove the words Host and NNTP from the document, we expect the classifier to predict atheism with probability 0.58 - 0.14 - 0.11 = 0.31.

twoclass

Multiclass case

multiclass

Tabular data

tabular

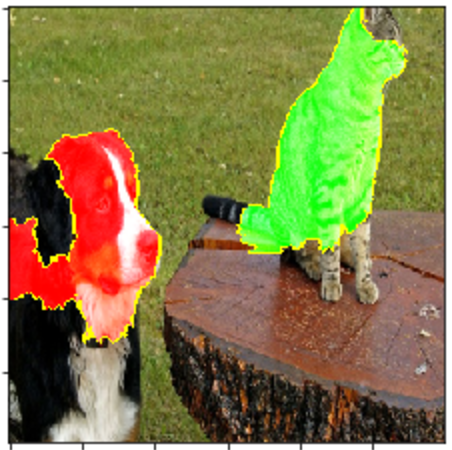
Images (explaining prediction of 'Cat' in pros and cons)

Tutorials and API

For example usage for text classifiers, take a look at the following two tutorials (generated from ipython notebooks):

For classifiers that use numerical or categorical data, take a look at the following tutorial (this is newer, so please let me know if you find something wrong):

For image classifiers:

For regression:

Submodular Pick:

The raw (non-html) notebooks for these tutorials are available here.

The API reference is available here.

What are explanations?

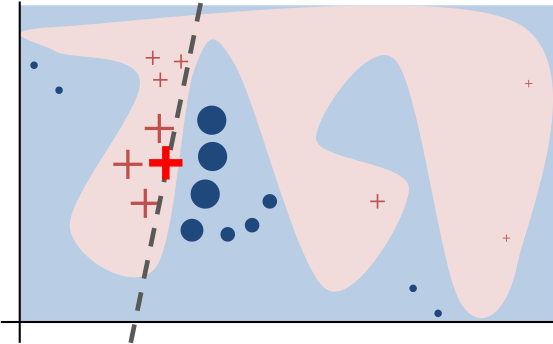
Intuitively, an explanation is a local linear approximation of the model's behaviour. While the model may be very complex globally, it is easier to approximate it around the vicinity of a particular instance. While treating the model as a black box, we perturb the instance we want to explain and learn a sparse linear model around it, as an explanation. The figure below illustrates the intuition for this procedure. The model's decision function is represented by the blue/pink background, and is clearly nonlinear. The bright red cross is the instance being explained (let's call it X). We sample instances around X, and weight them according to their proximity to X (weight here is indicated by size). We then learn a linear model (dashed line) that approximates the model well in the vicinity of X, but not necessarily globally. For more information, read our paper, or take a look at this blog post.

Contributing

Please read this.

Comments
  • LIME explain instance resulting in empty graph

    LIME explain instance resulting in empty graph

    Hi. I'm working with a spark data frame and to be able to make use of LIME we had to make some modifications:

    def new_predict_fn(data):
        sdf = map(lambda x: (int(x[0]), Vectors.dense(x[0:])), data)
        sdf = spark.createDataFrame(sdf, schema=["id", "features"]).select("features")
        predictions = cv_model.transform(sdf).select("prediction")
        return predictions.toPandas()["prediction"].values.reshape(-1)
    
    lime_df_test = nsdf.select('features').toPandas()
    lime_df_test = pd.DataFrame.from_records(lime_df_test['features'].tolist())
    
    exp = explainer.explain_instance(lime_df_test.iloc[10].values, new_predict_fn, num_features=20)
    display(exp.as_pyplot_figure())
    

    However, when it results in an "empty" explanation:

    [('3575 <= 2199.13', 0.0), ('3981 <= 2189.88', 0.0), ('3987 <= 2189.88', 0.0), ('4527 <= 93.00', 0.0), ('4003 <= 1.00', 0.0), ('4528 <= 0.00', 0.0), ('3824 <= 14000000.00', 0.0), ('4256 <= 2199.73', 0.0), ('3685 <= 2190.45', 0.0), ('3579 <= 2199.13', 0.0)]

    We are looking for some reason for this to happen. A simple test with the modifications mentioned above worked well, but using real data (with more than 3000) columns, we faced that problem. The only idea that comes to my mind is that LIME is not being able to explain an instance locally (?). But I'm not sure if that makes sense. I'm also wondering (now) if it's not just a case that the weights are plotted with 1 decimal place of precision and if (how) I could change that.

    Thanks.

    opened by paulaceccon 21
  • How to interpret LIME results?

    How to interpret LIME results?

    I am considering using LIME, and I am having some struggle to understand what exactly it outputs.

    I posed a question on stack exchange with a MCVE, but maybe this is more suitable here.

    Consider the following code, that uses logistic regression to fit a logistic process, and uses LIME for a new example.

    import numpy as np
    import lime.lime_tabular
    from sklearn.linear_model import LogisticRegression
    
    # generate a logistic latent variable from `a` and `b` with coef. 1, 1
    data = []
    for t in range(100000):
        a = 1 - 2 * np.random.random()
        b = 1 - 2 * np.random.random()
        noise = np.random.logistic()
        c = int(a + b + noise > 0)  # to predict
        data.append([a, b, c])
    data = np.array(data)
    
    x = data[:, :-1]
    y = data[:, -1]
    
    # fit Logistic regression without regularization (C=inf)
    classifier = LogisticRegression(C=1e10)
    classifier.fit(x, y)
    
    print(classifier.coef_)
    
    # "explain" with LIME
    explainer = lime.lime_tabular.LimeTabularExplainer(
                    x, mode='classification',
                    feature_names=['a', 'b'])
    
    explanation = explainer.explain_instance(np.array([1, 1]), classifier.predict_proba, num_samples=100000)
    print(explanation.as_list())
    

    output:

    [[ 0.9981159   0.99478328]]  # print(classifier.coef_)
    [('a > 0.50', 0.219), ('b > 0.50', 0.219)] # print(explanation.as_list())
    

    the ~[[1, 1]] is because we are doing logistic regression to a Logistic process with these coefficients.

    What do the values 0.219... mean? Are they relatable to any quantity of this example?

    opened by jorgecarleitao 19
  • Regression support

    Regression support

    I took @aikramer2's work in #52 and made the following minor changes to satisfy flake8:

    • synced the branch with the latest master from the base project
    • new LimeError class
    • lots of formatting (mostly lines that were >79
    • removed two unused labels variables.
    opened by Aylr 18
  • numerical data (categoric & continuous) explanation on SVC, and NN

    numerical data (categoric & continuous) explanation on SVC, and NN

    I follow your example from https://marcotcr.github.io/lime/tutorials/Tutorial%20-%20continuous%20and%20categorical%20features.html for continuous and categorical data and give it a try with different models. I used SVC (from sklearn) and NN (from keras). somehow both of the method I used get crashed and restart the kernel when it try to get the explanation (exp=...), code below.

    ` #1 using SVC predict_fn = lambda x: svm_linear.predict_proba(encoder.transform(x)) explainer = lime.lime_tabular.LimeTabularExplainer(train ,feature_names = feature_names,class_names=class_names, categorical_features=categorical_features, categorical_names=categorical_names, kernel_width=3)

    all_explains = {} for i in range(test.shape[0]): exp = explainer.explain_instance(test[i], predict_fn, num_features=5) all_explains[i]=exp`

    ` #2 using NN from keras.models import Sequential from keras.layers import Dense, Dropout, Activation from keras.optimizers import SGD

    model = Sequential() model.add(Dense(32, input_dim=encoded_train.shape[1], activation='relu')) model.add(Dense(32,activation='relu')) model.add(Dense(1, activation='sigmoid'))

    model.compile(loss='binary_crossentropy',optimizer='rmsprop',metrics=['accuracy'])

    model.fit(encoded_train_toa, labels_train, epochs=30, batch_size=128) score = model.evaluate(encoded_test_toa, labels_test, batch_size=128)

    def trans(x): x = encoder.transform(x).toarray() return model.predict_proba(x)

    import lime from lime import lime_tabular explainer = lime.lime_tabular.LimeTabularExplainer(train ,feature_names = feature_names,class_names=class_names, categorical_features=categorical_features, categorical_names=categorical_names) all_explains={} predict_fn = lambda x: trans(x) for i in range(test.shape[0]): temp = test[i,:] exp = explainer.explain_instance(temp, predict_fn, num_features=5) all_explains[i]=exp ` is SVM and NN not supported yet for numerical data? Because I have no problem using it on tree-based classifiers.

    opened by yusufazishty 18
  • Found input variables with inconsistent numbers of samples: [5000, 1]

    Found input variables with inconsistent numbers of samples: [5000, 1]

    Not sure if a new version of scikit-learn is messing this up or not but I get this error when trying to run an explanation:

    Found input variables with inconsistent numbers of samples: [5000, 1]

    The outer-error occurs in lime_base.py here: https://github.com/marcotcr/lime/blob/master/lime/lime_base.py#L75

    The inner error is thrown in scikit-learn here: https://github.com/scikit-learn/scikit-learn/blob/master/sklearn/utils/validation.py#L180

    I have tried to follow the multi-class notebook example as closely as I could but I do not see anything I could change to make my data look any more like the one in the example. That is, all of my classifier outputs look exactly like what's given in the example.

    Any suggestions?

    Thanks!

    opened by courageon 16
  • LIME vs feature importance

    LIME vs feature importance

    Hi,

    I have a question regarding the feature importance vs LIME.

    For the adult data set, we can see the feature importance of my model -

    importance

    However, when I set plotting various lime plots, I will post a few:

    1

    2

    3

    I ran around 20 plots and mostly we can see for example the variable marital status to be used in the decision. However, for the feature importance, it is slightly low. Is there a reason for this?

    feature importance let us know that the more important features are on the higher nodes for splitting. For the LIME, it is ordered by values. Is it correct to understand that more important features does not necessarily means that it will result in larger gain/loss in the LIME?

    opened by germayneng 14
  • Added RecurrentTabularExplainer

    Added RecurrentTabularExplainer

    This addresses issue #56, and adds a class to handle tabular data when the model is a stateless keras-style recurrent neural network. In that case, the model expects data with shape (n_samples, n_timesteps, n_features). This mostly uses the machinery of the existing LimeTabularExplainer, but reshapes data in a few places so that the user doesn't have to worry about reshaping themselves.

    opened by kgullikson88 14
  • Does the code work for regressors yet?

    Does the code work for regressors yet?

    Or is it only scikit-learn classifiers for now? I am interested in using LIME for some work that I am doing that uses SVRs. Would it be a lot of work to extend LIME to work with regression models? I am happy to help.

    opened by desilinguist 14
  • Add PySpark MLlib support

    Add PySpark MLlib support

    "All we require is that the classifier implements a function that takes in raw text or a numpy array and outputs a probability for each class."

    Necessarily to operate within the context in where it acts, Spark MLlib takes more complicated data structures as input. Would it be possible to add support for Spark? If it is, I might do it, but I'm not sure it is possible.

    opened by rjurney 13
  • Is it possible to do incremental training on LimeTabularExplainer?

    Is it possible to do incremental training on LimeTabularExplainer?

    Hi, I have a data, I fit a model, store the model, later I get new data, I don't want to retrain with full data, so I fit the new data, may I know is it possible to create explainer as a incremental fit for the new data.

    data = [[1, 2], [0.5, 6], [0, 10], [1, 18]]
    scaler = MinMaxScaler()
    scaler.partial_fit(data)
    sc_data = scaler.transform(data)
    model1 = IForest(contamination=0.1).fit(sc_data)
    explainer = lime.lime_tabular.LimeTabularExplainer(sc_data, 
                                                          mode='classification',
                                                          feature_names=feature_names,
                                                          kernel_width=5,
                                                          random_state=42,
                                                          discretize_continuous=False)
    

    I store the model, scaler, explainer for serving purpose, after some time i get more data, so fit the new data to the same model, is it possible for explainer as well?

    data2 = [[15, 12], [15, 16], [0, 11], [1, 18]]
    scaler = load(scaler)
    loaded_model = load(model1)
    
    scaler.partial_fit(data2)
    sc_data2 = scaler.transform(data2)
    model2 = loaded_model.fit(sc_data2)
    explainer = lime.lime_tabular.LimeTabularExplainer(????????????????)
    

    Thanks in advance for the inputs.

    opened by hanzigs 12
  • Interpreting Fine-tuned Bert model using LIME

    Interpreting Fine-tuned Bert model using LIME

    Thanks for this amazing work. I am trying to interpret Fine-tuned BERT model using Transformer framework. It seems there is tokenization issue, when I try to use LIME with BERT. Here is the error that i am getting:

    Traceback (most recent call last):
      File "src/predict.py", line 351, in <module>
        exp = explainer.explain_instance(s, prediction.predictor, num_features=6)
      File "/home/ramesh/.virtualenvs/transformer-env/lib/python3.6/site-packages/lime/lime_text.py", line 417, in explain_instance
        distance_metric=distance_metric)
      File "/home/ramesh/.virtualenvs/transformer-env/lib/python3.6/site-packages/lime/lime_text.py", line 484, in __data_labels_distances
        labels = classifier_fn(inverse_data)
      File "src/predict.py", line 297, in predictor
        input_ids, input_mask, segment_ids = self.convert_text_to_features(text)
      File "src/predict.py", line 135, in convert_text_to_features
        tokens_a = self.tokenizer.tokenize(text_a)
      File "/home/ramesh/.virtualenvs/transformer-env/lib/python3.6/site-packages/transformers/tokenization_utils.py", line 649, in tokenize
        tokenized_text = split_on_tokens(added_tokens, text)
      File "/home/ramesh/.virtualenvs/transformer-env/lib/python3.6/site-packages/transformers/tokenization_utils.py", line 637, in split_on_tokens
        if sub_text not in self.added_tokens_encoder \
    TypeError: unhashable type: 'list'
    

    Here is my code:

    def predictor(self, text):
    
            max_seq_length=128
            input_ids, input_mask, segment_ids = self.convert_text_to_features(text)
            self.model.to(self.device)
    
            with torch.no_grad():
                outputs = self.model(input_ids, input_mask, segment_ids)
    
            logits = outputs[0]
            logits = F.softmax(logits, dim=1)
    
            return logits.numpy()
    
    def convert_text_to_features(self, text_a, text_b=None):
    
            features = []
            cls_token = self.tokenizer.cls_token
            sep_token = self.tokenizer.sep_token
            cls_token_at_end = False
            sequence_a_segment_id = 0
            sequence_b_segment_id = 1
            cls_token_segment_id = 1
            pad_token_segment_id = 0
            mask_padding_with_zero = True
            pad_token = 0
            tokens_a = self.tokenizer.tokenize(text_a)
            tokens_b = None
    
            self._truncate_seq_pair(tokens_a, self.max_seq_length - 2)
    
            tokens = tokens_a + [sep_token]
            segment_ids = [sequence_a_segment_id] * len(tokens)
    
            if tokens_b:
                tokens += tokens_b + [sep_token]
                segment_ids += [sequence_b_segment_id] * (len(tokens_b) + 1)
    
    
            tokens = [cls_token] + tokens
            segment_ids = [cls_token_segment_id] + segment_ids
    
            input_ids = self.tokenizer.convert_tokens_to_ids(tokens)
    
            input_mask = [1 if mask_padding_with_zero else 0] * len(input_ids)
            padding_length = self.max_seq_length - len(input_ids)
    
    
            input_ids = input_ids + ([pad_token] * padding_length)
            input_mask = input_mask + ([0 if mask_padding_with_zero else 1] * padding_length)
            segment_ids = segment_ids + ([pad_token_segment_id] * padding_length)
    
            assert len(input_ids) == self.max_seq_length
            assert len(input_mask) == self.max_seq_length
            assert len(segment_ids) == self.max_seq_length
    
            input_ids = torch.tensor([input_ids], dtype=torch.long).to(self.device)
            input_mask = torch.tensor([input_mask], dtype=torch.long).to(self.device)
            segment_ids = torch.tensor([segment_ids], dtype=torch.long).to(self.device)
            return input_ids, input_mask, segment_ids
    
    
    if __name__ == '__main__':
    
        model_path = "models/mrpc"
        bert_model_class = "bert"
        prediction = Prediction(bert_model_class, model_path, lower_case=True, seq_length=128)
        label_names = [0, 1]
        explainer = LimeTextExplainer(class_names=label_names)
        train_df = pd.read_csv("data/train.tsv", sep = '\t')
    
        for example in train_df["string"]:
            exp = explainer.explain_instance(example, prediction.predictor, num_features=6)
            print(exp.as_list())
    

    I have checked this issue356, but still i cannot figure out my problem.

    Any leads will be appreciated.

    Thank you :)

    opened by rameshjes 12
  • Can the sampling around an instance method be part of the utils?

    Can the sampling around an instance method be part of the utils?

    I have noticed that sampling is done by a private method __data_inverse of the LimeTabularExplainer class. Is there a way to access the sampling algorithm without initializing the class object?

    opened by HardikPrabhu 0
  • Problems with implementing LIME, can't get binary 0 or 1 outputs, only probabilities

    Problems with implementing LIME, can't get binary 0 or 1 outputs, only probabilities

    Hope everyone is holding on tight, we're soon at Christmas!

    Hi, as I have already made a post about the issue in detail over at stackexchange, I'll just post the link here and a quick summary of my problem:

    Link here: https://datascience.stackexchange.com/questions/116799/problems-with-implementing-lime?noredirect=1#comment117787_116799

    My problem is that I want to show my random forest score through the predict.proba(x_test)[:, 1] method. However, it gives me this error code when I try use LIME to show the score using that prediction:

    Cell In [31], line 3 1 i = 49 ----> 3 exp = explainer.explain_instance(x_test.iloc[i], predict_fn_rf, num_features=5) 4 exp.show_in_notebook(show_table=True)

    File ~\OneDrive\Documents\Anaconda\lib\site-packages\lime\lime_tabular.py:361, in LimeTabularExplainer.explain_instance(self, data_row, predict_fn, labels, top_labels, num_features, num_samples, distance_metric, model_regressor) 359 if self.mode == "classification": 360 if len(yss.shape) == 1: --> 361 raise NotImplementedError("LIME does not currently support " 362 "classifier models without probability " 363 "scores. If this conflicts with your " 364 "use case, please let us know: " 365 "https://github.com/datascienceinc/lime/issues/16") 366 elif len(yss.shape) == 2: 367 if self.class_names is None:

    NotImplementedError: LIME does not currently support classifier models without probability scores. If this conflicts with your use case, please let us know: https://github.com/datascienceinc/lime/issues/16

    opened by Ostlimpa 0
  • Add predict_fn_accept_dense_only to explain_instance when input is sparse but model takes dense

    Add predict_fn_accept_dense_only to explain_instance when input is sparse but model takes dense

    Add predict_fn_accept_dense_only to explain_instance.

    When data_row (of explain_instance) is scipy.sparse.matrix but the model was NOT trained with scipy.sparse.matrix, the predict_fn_accept_dense_only convert inverse to dense before call predict_fn (and then back to sparse after call predict_fn)

    Bin [email protected]

    opened by dbinlbl 1
  • background/filter dataset in LIME

    background/filter dataset in LIME

    Hi LIME community, Thanks for the help or any lead in advance.

    One thing we are looking for is to provide a background data for LIME at the time of explanation of every instance. We are not sure if it is available in LIME? More specifically, it looks like the shap.KernelExplainer' data parameter. https://shap-lrjball.readthedocs.io/en/latest/generated/shap.KernelExplainer.html

    One possible method is to provide feature_selection (e.g, highest_weights) for LimeTabularExplainer or explain_instance_with_data. But, it looks like LimeTabularExplainer needs to build the explainer for every instance, and explain_instance_with_data needs users to provide neighborhood_data etc.

    Bests, Bin

    opened by dbinlbl 1
  • Create text classification tutorial using tensorflow

    Create text classification tutorial using tensorflow

    I've noticed that a few people are talking about using LIME with TensorFlow models. There was an issue, which was addressed before, but I believe this tutorial can provide a guide for users since it uses a very popular dataset (Kaggle's tweets classification).

    In this notebook, I've used the Universal Sentence Encoder from TensorFlow Hub to classify the text data.

    Hopefully, it will be helpful.

    opened by Nour-Aldein2 0
Releases(0.2.0.0)
Owner
Marco Tulio Correia Ribeiro
GUI for visualization and interactive editing of SMPL-family body models ie. SMPL, SMPL-X, MANO, FLAME.

Body Model Visualizer Introduction This is a simple Open3D-based GUI for SMPL-family body models. This GUI lets you play with the shape, expression, a

Muhammed Kocabas 207 Jan 01, 2023
The open-source tool for building high-quality datasets and computer vision models

The open-source tool for building high-quality datasets and computer vision models. Website • Docs • Try it Now • Tutorials • Examples • Blog • Commun

Voxel51 2.4k Jan 07, 2023
CompleX Group Interactions (XGI) provides an ecosystem for the analysis and representation of complex systems with group interactions.

XGI CompleX Group Interactions (XGI) is a Python package for the representation, manipulation, and study of the structure, dynamics, and functions of

Complex Group Interactions 67 Dec 28, 2022
Piglet-shaders - PoC of custom shaders for Piglet

Piglet custom shader PoC This is a PoC for compiling Piglet fragment shaders usi

6 Mar 10, 2022
Eulera Dashboard is an easy and intuitive way to get a quick feel of what’s happening on the world’s market.

an easy and intuitive way to get a quick feel of what’s happening on the world’s market ! Eulera dashboard is a tool allows you to monitor historical

Salah Eddine LABIAD 4 Nov 25, 2022
Color maps for POV-Ray v3.7 from the Plasma, Inferno, Magma and Viridis color maps in Python's Matplotlib

POV-Ray-color-maps Color maps for POV-Ray v3.7 from the Plasma, Inferno, Magma and Viridis color maps in Python's Matplotlib. The include file Color_M

Tor Olav Kristensen 1 Apr 05, 2022
Some method of processing point cloud

Point-Cloud Some method of processing point cloud inversion the completion pointcloud to incomplete point cloud Some model of encoding point cloud to

Tan 1 Nov 19, 2021
HiPlot makes understanding high dimensional data easy

HiPlot - High dimensional Interactive Plotting HiPlot is a lightweight interactive visualization tool to help AI researchers discover correlations and

Facebook Research 2.4k Jan 04, 2023
Python & Julia port of codes in excellent R books

X4DS This repo is a collection of Python & Julia port of codes in the following excellent R books: An Introduction to Statistical Learning (ISLR) Stat

Gitony 5 Jun 21, 2022
With Holoviews, your data visualizes itself.

HoloViews Stop plotting your data - annotate your data and let it visualize itself. HoloViews is an open-source Python library designed to make data a

HoloViz 2.3k Jan 04, 2023
A little word cloud generator in Python

Linux macOS Windows PyPI word_cloud A little word cloud generator in Python. Read more about it on the blog post or the website. The code is tested ag

Andreas Mueller 9.2k Dec 30, 2022
Dipto Chakrabarty 7 Sep 06, 2022
This is a Web scraping project using BeautifulSoup and Python to scrape basic information of all the Test matches played till Jan 2022.

Scraping-test-matches-data This is a Web scraping project using BeautifulSoup and Python to scrape basic information of all the Test matches played ti

Souradeep Banerjee 4 Oct 10, 2022
The Python ensemble sampling toolkit for affine-invariant MCMC

emcee The Python ensemble sampling toolkit for affine-invariant MCMC emcee is a stable, well tested Python implementation of the affine-invariant ense

Dan Foreman-Mackey 1.3k Jan 04, 2023
It's an application to calculate I from v and r. It can also plot a graph between V vs I.

Ohm-s-Law-Visualizer It's an application to calculate I from v and r using Ohm's Law. It can also plot a graph between V vs I. Story I'm doing my Unde

Sihab Sahariar 1 Nov 20, 2021
Handout for the tutorial "Creating publication-quality figures with matplotlib"

Handout for the tutorial "Creating publication-quality figures with matplotlib"

JB Mouret 1.9k Jan 02, 2023
GD-UltraHack - A Mod Menu for Geometry Dash. Specifically a MegahackV5 clone in Python. Only for Windows

GD UltraHack: The Mod Menu that Nobody asked for. This is a mod menu for the gam

zeo 1 Jan 05, 2022
a robust room presence solution for home automation with nearly no false negatives

Argos Room Presence This project builds a room presence solution on top of Argos. Using just a cheap raspberry pi zero w (plus an attached pi camera,

Angad Singh 46 Sep 18, 2022
Visualise top-rated GitHub repositories in a barchart by keyword

This python script was written for simple purpose -- to visualise top-rated GitHub repositories in a barchart by keyword. Script generates html-page with barchart and information about repository own

Cur1iosity 2 Feb 07, 2022
Easily configurable, chart dashboards from any arbitrary API endpoint. JSON config only

Flask JSONDash Easily configurable, chart dashboards from any arbitrary API endpoint. JSON config only. Ready to go. This project is a flask blueprint

Chris Tabor 3.3k Dec 31, 2022