BrowZen correlates your emotional states with the web sites you visit to give you actionable insights about how you spend your time browsing the web.

Overview

BrowZen

BrowZen correlates your emotional states with the web sites you visit to give you actionable insights about how you spend your time browsing the web.

How It Works

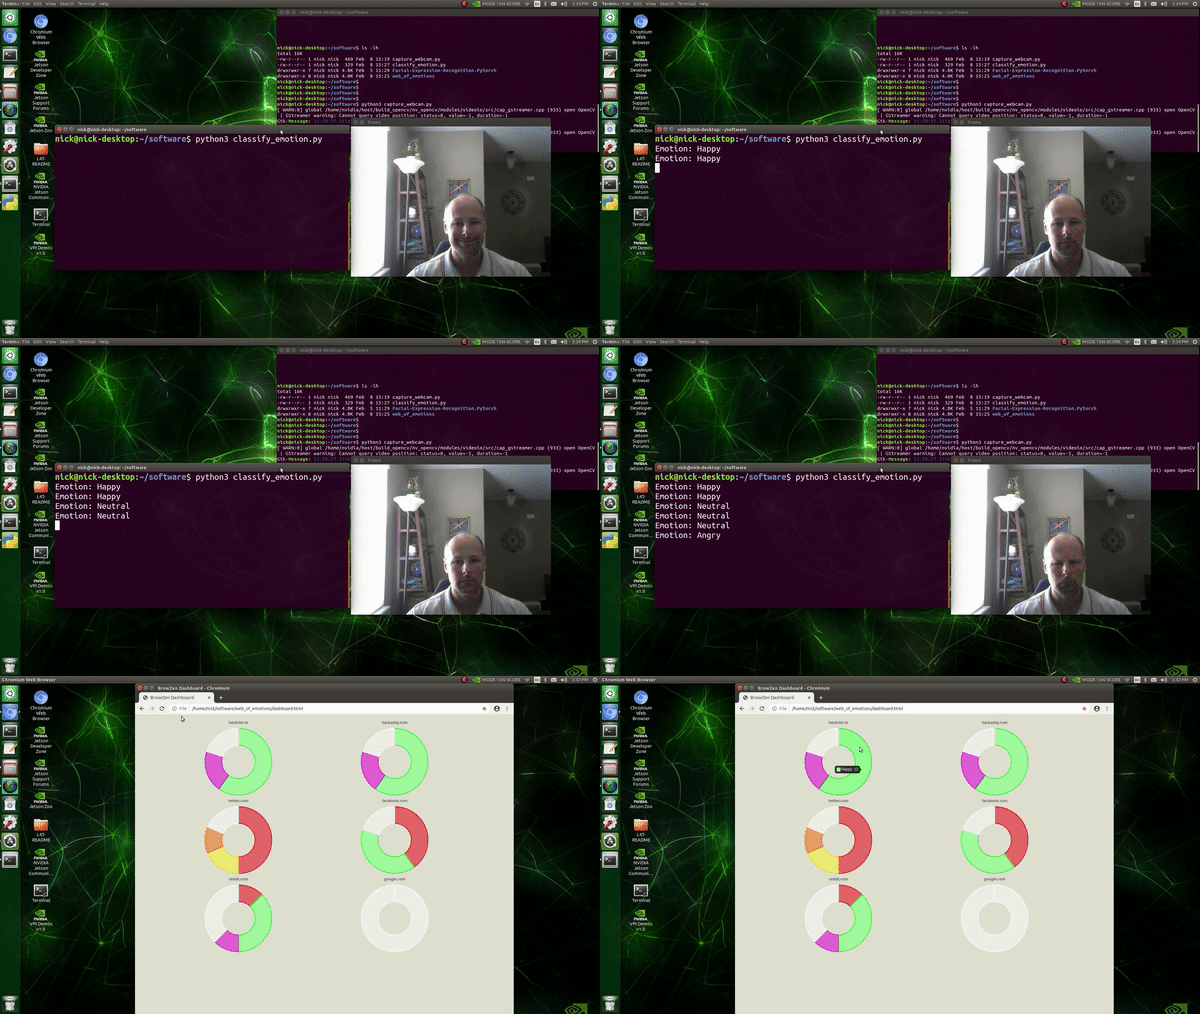
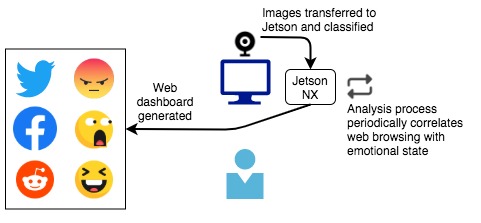
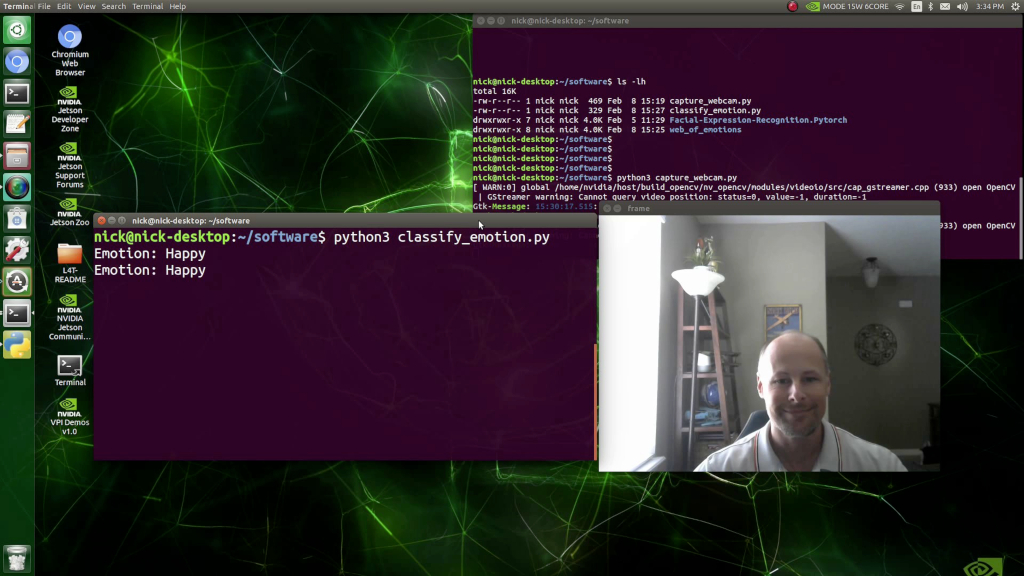
A webcam attached to an NVIDIA Jetson Xavier NX captures periodic images of the user of the computer as a background process. These images are classified (see classify_emotion.py) by a VGG19 convolutional neural network that has been pretrained to recognize seven emotional states ("Angry", "Disgust", "Fear", "Happy", "Sad", "Surprise", and "Neutral"). Observations (emotional state, datetime stamp) are recorded in an SQLite3 database. For privacy protection, images are destroyed after classification, and all processing takes place locally—nothing is sent to the cloud.

Next, analysis.py connects to the SQLite3 database that stores web history in Chrome/Chromium and correlates web site visit times with the database of emotional state observations created by the classification step. The result of the analysis, the sum of each emotional state observed while visiting each web site, is stored in an SQLite3 database table.

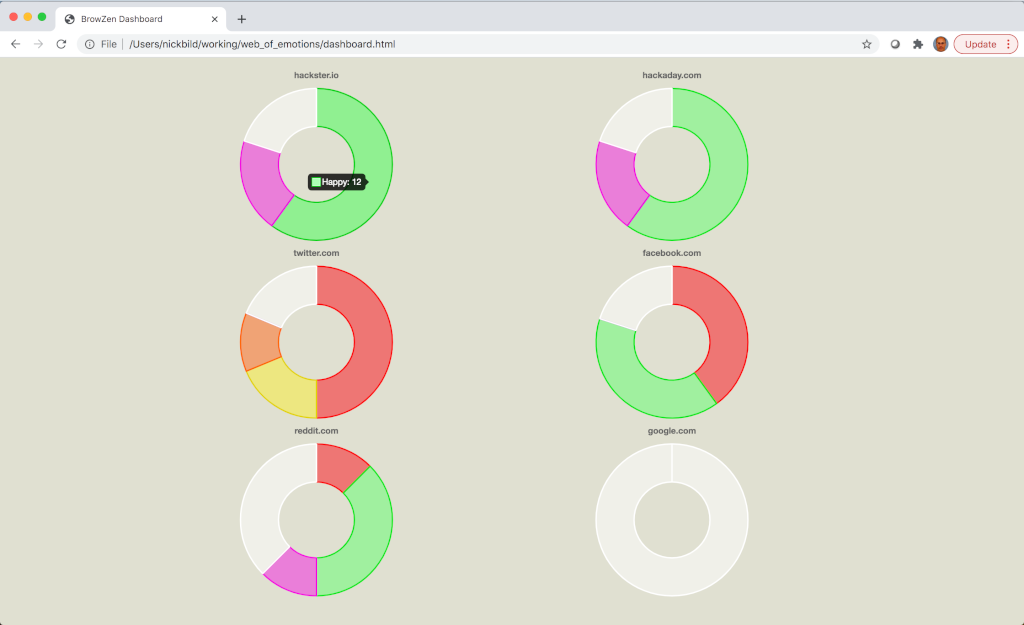
Finally, the analysis results are used to generate a web dashboard (generate_dashboard.py) to provide a simple way to visualize, on average, how each web site one visits impacts their emotional state. The web dashboard (dashboard.html) relies on only HTML5 and JavaScript.

Media

Demo Video: YouTube

The web dashboard, giving an overview of emotional reactions during visits to various websites (high resolution): Dashboard
Classifying emotions in real-time (high resolution): Classification
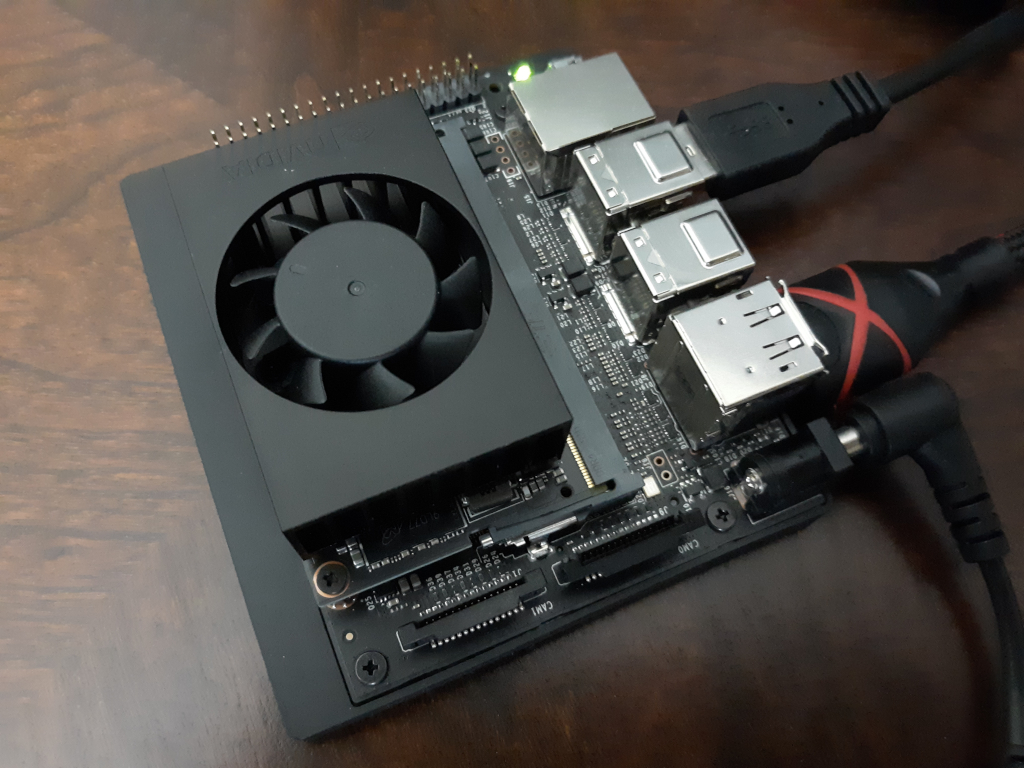
Jetson Xavier NX (high resolution): Jetson

Future Direction

It may be useful to create a browser plugin that displays a small, always-visible icon representing past emotions experienced when visiting the current website. This would serve as a quick reminder of past experiences that may modify current behavior.

I would like to also explore other areas, beyond web browsing, where this idea may be helpful.

Bill of Materials

  • 1 x NVIDIA Jetson Xavier NX
  • 1 x USB webcam

About the Author

Nick A. Bild, MS

Owner
Nick Bild
R&D, creativity, and building the next big thing you never knew you wanted are my specialties.
Nick Bild
📊 Charts with pure python

A zero-dependency python package that prints basic charts to a Jupyter output Charts supported: Bar graphs Scatter plots Histograms 🍑 📊 👏 Examples

Max Humber 54 Oct 04, 2022
An open-source plotting library for statistical data.

Lets-Plot Lets-Plot is an open-source plotting library for statistical data. It is implemented using the Kotlin programming language. The design of Le

JetBrains 820 Jan 06, 2023
Pebble is a stat's visualization tool, this will provide a skeleton to develop a monitoring tool.

Pebble is a stat's visualization tool, this will provide a skeleton to develop a monitoring tool.

Aravind Kumar G 2 Nov 17, 2021
3D plotting and mesh analysis through a streamlined interface for the Visualization Toolkit (VTK)

PyVista Deployment Build Status Metrics Citation License Community 3D plotting and mesh analysis through a streamlined interface for the Visualization

PyVista 1.6k Jan 08, 2023
Frbmclust - Clusterize FRB profiles using hierarchical clustering, plot corresponding parameters distributions

frbmclust Getting Started Clusterize FRB profiles using hierarchical clustering,

3 May 06, 2022
Visualization of the World Religion Data dataset by Correlates of War Project.

World Religion Data Visualization Visualization of the World Religion Data dataset by Correlates of War Project. Mostly personal project to famirializ

Emile Bangma 1 Oct 15, 2022
Python package for hypergraph analysis and visualization.

The HyperNetX library provides classes and methods for the analysis and visualization of complex network data. HyperNetX uses data structures designed to represent set systems containing nested data

Pacific Northwest National Laboratory 304 Dec 27, 2022
Type-safe YAML parser and validator.

StrictYAML StrictYAML is a type-safe YAML parser that parses and validates a restricted subset of the YAML specification. Priorities: Beautiful API Re

Colm O'Connor 1.2k Jan 04, 2023
Visualize the bitcoin blockchain from your local node

Project Overview A new feature in Bitcoin Core 0.20 allows users to dump the state of the blockchain (the UTXO set) using the command dumptxoutset. I'

18 Sep 11, 2022
A Bokeh project developed for learning and teaching Bokeh interactive plotting!

Bokeh-Python-Visualization A Bokeh project developed for learning and teaching Bokeh interactive plotting! See my medium blog posts about making bokeh

Will Koehrsen 350 Dec 05, 2022
Lightweight data validation and adaptation Python library.

Valideer Lightweight data validation and adaptation library for Python. At a Glance: Supports both validation (check if a value is valid) and adaptati

Podio 258 Nov 22, 2022
Monochromatic colorscheme for matplotlib with opinionated sensible default

Monochromatic colorscheme for matplotlib with opinionated sensible default If you need a simple monochromatic colorscheme for your matplotlib figures,

Aria Ghora Prabono 2 May 06, 2022
Cryptocurrency Centralized Exchange Visualization

This is a simple one that uses Grafina to visualize cryptocurrency from the Bitkub exchange. This service will make a request to the Bitkub API from your wallet and save the response to Postgresql. G

Popboon Mahachanawong 1 Nov 24, 2021
A library for bridging Python and HTML/Javascript (via Svelte) for creating interactive visualizations

A library for bridging Python and HTML/Javascript (via Svelte) for creating interactive visualizations

Anthropic 98 Dec 27, 2022
DALLE-tools provided useful dataset utilities to improve you workflow with WebDatasets.

DALLE tools DALLE-tools is a github repository with useful tools to categorize, annotate or check the sanity of your datasets. Installation Just clone

11 Dec 25, 2022
Python package for the analysis and visualisation of finite-difference fields.

discretisedfield Marijan Beg1,2, Martin Lang2, Samuel Holt3, Ryan A. Pepper4, Hans Fangohr2,5,6 1 Department of Earth Science and Engineering, Imperia

ubermag 12 Dec 14, 2022
Gesture controlled media player

Media Player Gesture Control Gesture controller for media player with MediaPipe, VLC and OpenCV. Contents About Setup About A tool for using gestures

Atharva Joshi 2 Dec 22, 2021
Python package to visualize and cluster partial dependence.

partial_dependence A python library for plotting partial dependence patterns of machine learning classifiers. The technique is a black box approach to

NYU Visualization Lab 25 Nov 14, 2022
Visualise top-rated GitHub repositories in a barchart by keyword

This python script was written for simple purpose -- to visualise top-rated GitHub repositories in a barchart by keyword. Script generates html-page with barchart and information about repository own

Cur1iosity 2 Feb 07, 2022
Sprint planner considering JIRA issues and google calendar meetings schedule.

Sprint planner Sprint planner is a Python script for planning your Jira tasks based on your calendar availability. Installation Use the package manage

Apptension 2 Dec 05, 2021