Insert SVGs into matplotlib

Overview

skunk buildPyPI version

Insert SVGs into matplotlib

pip install skunk

Jupyter Notebooks

To show generated SVGs in Jupyter Notebooks: Currently, axes are cutoff when viewed in jupyter - I think due to restrictive viewport. Save to file to get publication ready version

skunk.display(svg)

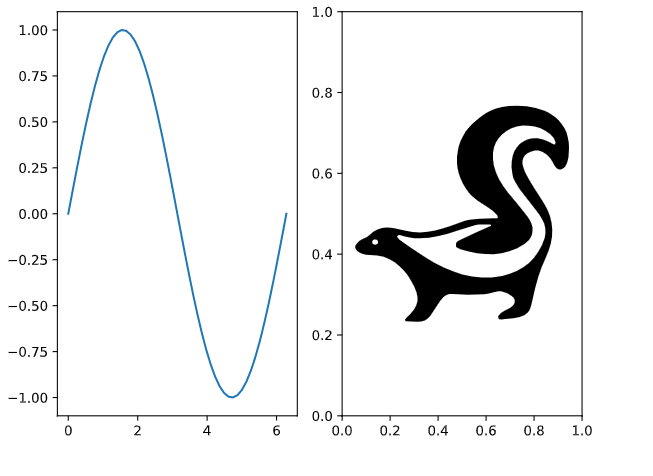
Overwrite Subplot

import skunk
import numpy as np
import os
import matplotlib.pyplot as plt

fig, axs = plt.subplots(ncols=2)

x = np.linspace(0, 2 * np.pi)
axs[0].plot(x, np.sin(x))

# important line where we set ID
skunk.connect(axs[1], 'sk')

plt.tight_layout()

# Overwrite using file path to my svg
# Can also use string
svg = skunk.insert(
    {
        'sk': 'skunk.svg'
    })

with open('replaced.svg', 'w') as f:
    f.write(svg)

Output

image

SVG in Annotation

Read about annotation boxes first

")) ax.add_artist(ab) # sknunk box with id sk2 box = skunk.Box(50, 50, 'sk2') ab = AnnotationBbox(box, (3 * np.pi / 2, -1), xybox=(-5, 100), xycoords='data', boxcoords='offset points', arrowprops=dict(arrowstyle="->")) ax.add_artist(ab) # insert current figure into itself at sk1 # insert svg file in sk2 svg = skunk.insert( { 'sk1': skunk.pltsvg(), 'sk2': 'skunk.svg' }) with open('replaced2.svg', 'w') as f: f.write(svg) ">
import numpy as np

fig, ax = plt.subplots()

x = np.linspace(0, 2 * np.pi)
ax.plot(x, np.sin(x))

# new code: using skunk box with id sk1
box = skunk.Box(50, 50, 'sk1')
ab = AnnotationBbox(box, (np.pi / 2, 1),
                    xybox=(-5, -100),
                    xycoords='data',
                    boxcoords='offset points',
                    arrowprops=dict(arrowstyle="->"))
ax.add_artist(ab)

# sknunk box with id sk2
box = skunk.Box(50, 50, 'sk2')
ab = AnnotationBbox(box, (3 * np.pi / 2, -1),
                    xybox=(-5, 100),
                    xycoords='data',
                    boxcoords='offset points',
                    arrowprops=dict(arrowstyle="->"))

ax.add_artist(ab)

# insert current figure into itself at sk1
# insert svg file in sk2
svg = skunk.insert(
    {
        'sk1': skunk.pltsvg(),
        'sk2': 'skunk.svg'
    })

with open('replaced2.svg', 'w') as f:
    f.write(svg)

Output

image

You might also like...
matplotlib: plotting with Python

Matplotlib is a comprehensive library for creating static, animated, and interactive visualizations in Python. Check out our home page for more inform

Statistical data visualization using matplotlib

seaborn: statistical data visualization Seaborn is a Python visualization library based on matplotlib. It provides a high-level interface for drawing

:small_red_triangle: Ternary plotting library for python with matplotlib

python-ternary This is a plotting library for use with matplotlib to make ternary plots plots in the two dimensional simplex projected onto a two dime

Joyplots in Python with matplotlib & pandas :chart_with_upwards_trend:

JoyPy JoyPy is a one-function Python package based on matplotlib + pandas with a single purpose: drawing joyplots (a.k.a. ridgeline plots). The code f

A python package for animating plots build on matplotlib.

animatplot A python package for making interactive as well as animated plots with matplotlib. Requires Python = 3.5 Matplotlib = 2.2 (because slider

Painlessly create beautiful matplotlib plots.

Announcement Thank you to everyone who has used prettyplotlib and made it what it is today! Unfortunately, I no longer have the bandwidth to maintain

basemap - Plot on map projections (with coastlines and political boundaries) using matplotlib.

Basemap Plot on map projections (with coastlines and political boundaries) using matplotlib. ⚠️ Warning: this package is being deprecated in favour of

Design your own matplotlib stylefile interactively

Tired of playing with font sizes and other matplotlib parameters every time you start a new project or write a new plotting function? Want all you plots have the same style? Use matplotlib configuration files!

A Python library for plotting hockey rinks with Matplotlib.

Hockey Rink A Python library for plotting hockey rinks with Matplotlib. Installation pip install hockey_rink Current Rinks The following shows the cus

Comments
  • plot svgs into matplotlib subplots in a for loop

    plot svgs into matplotlib subplots in a for loop

    Hi,

    Many thanks for this easy and straightforward tool. I have a dict with lxml text in it, and I want to plot each key into a subplot. How would you do that using skunk?.. I would be very grateful if you can provide a demo code.

    I played a little with your code, didn't manage to make what I am after, but I saw that I had to reset the dimensions of the svg image before adding it to a subplot.

    Many thanks in advance, HM

    opened by hmassalha 4
Releases(v1.2.0)
Owner
Andrew White
Andrew White
A simple interpreted language for creating basic mathematical graphs.

graphr Introduction graphr is a small language written to create basic mathematical graphs. It is an interpreted language written in python and essent

2 Dec 26, 2021
Complex heatmaps are efficient to visualize associations between different sources of data sets and reveal potential patterns.

Make Complex Heatmaps Complex heatmaps are efficient to visualize associations between different sources of data sets and reveal potential patterns. H

Zuguang Gu 973 Jan 09, 2023
Visualize data of Vietnam's regions with interactive maps.

Plotting Vietnam Development Map This is my personal project that I use plotly to analyse and visualize data of Vietnam's regions with interactive map

1 Jun 26, 2022
Simple spectra visualization tool for astronomers

SpecViewer A simple visualization tool for astronomers. Dependencies Python = 3.7.4 PyQt5 = 5.15.4 pyqtgraph == 0.10.0 numpy = 1.19.4 How to use py

5 Oct 07, 2021
A library for bridging Python and HTML/Javascript (via Svelte) for creating interactive visualizations

A library for bridging Python and HTML/Javascript (via Svelte) for creating interactive visualizations

Anthropic 98 Dec 27, 2022
This is a small repository for me to implement my simply Data Visualisation skills through Python.

Data Visualisations This is a small repository for me to implement my simply Data Visualisation skills through Python. Steam Population Chart from 10/

9 Dec 31, 2021
Wikipedia WordCloud App generate Wikipedia word cloud art created using python's streamlit, matplotlib, wikipedia and wordcloud packages

Wikipedia WordCloud App Wikipedia WordCloud App generate Wikipedia word cloud art created using python's streamlit, matplotlib, wikipedia and wordclou

Siva Prakash 5 Jan 02, 2022
Lumen provides a framework for visual analytics, which allows users to build data-driven dashboards from a simple yaml specification

Lumen project provides a framework for visual analytics, which allows users to build data-driven dashboards from a simple yaml specification

HoloViz 120 Jan 04, 2023
3D Vision functions with end-to-end support for deep learning developers, written in Ivy.

Ivy vision focuses predominantly on 3D vision, with functions for camera geometry, image projections, co-ordinate frame transformations, forward warping, inverse warping, optical flow, depth triangul

Ivy 61 Dec 29, 2022
Easily convert matplotlib plots from Python into interactive Leaflet web maps.

mplleaflet mplleaflet is a Python library that converts a matplotlib plot into a webpage containing a pannable, zoomable Leaflet map. It can also embe

Jacob Wasserman 502 Dec 28, 2022
This is simply repo for line drawing rendering using freestyle in Blender.

blender_freestyle_line_drawing This is simply repo for line drawing rendering using freestyle in Blender. how to use blender2935 --background --python

MaxLin 3 Jul 02, 2022
Interactive Data Visualization in the browser, from Python

Bokeh is an interactive visualization library for modern web browsers. It provides elegant, concise construction of versatile graphics, and affords hi

Bokeh 17.1k Dec 31, 2022
Curvipy - The Python package for visualizing curves and linear transformations in a super simple way

Curvipy - The Python package for visualizing curves and linear transformations in a super simple way

Dylan Tintenfich 55 Dec 28, 2022
Make your BSC transaction simple.

bsc_trade_history Make your BSC transaction simple. 中文ReadMe Background: inspired by debank ,Practice my hands on this small project Blog:Crypto-BscTr

foolisheddy 7 Jul 06, 2022
Bokeh Plotting Backend for Pandas and GeoPandas

Pandas-Bokeh provides a Bokeh plotting backend for Pandas, GeoPandas and Pyspark DataFrames, similar to the already existing Visualization feature of

Patrik Hlobil 822 Jan 07, 2023
ipyvizzu - Jupyter notebook integration of Vizzu

ipyvizzu - Jupyter notebook integration of Vizzu. Tutorial · Examples · Repository About The Project ipyvizzu is the Jupyter Notebook integration of V

Vizzu 729 Jan 08, 2023
Print matplotlib colors

mplcolors Tired of searching "matplotlib colors" every week/day/hour? This simple script displays them all conveniently right in your terminal emulato

Brandon Barker 32 Dec 13, 2022
Application for viewing pokemon regional variants.

Pokemon Regional Variants Application Application for viewing pokemon regional variants. Run The Source Code Download Python https://www.python.org/do

Michael J Bailey 4 Oct 08, 2021
Visualize large time-series data in plotly

plotly_resampler enables visualizing large sequential data by adding resampling functionality to Plotly figures. In this Plotly-Resampler demo over 11

PreDiCT.IDLab 604 Dec 28, 2022
Glue is a python project to link visualizations of scientific datasets across many files.

Glue Glue is a python project to link visualizations of scientific datasets across many files. Click on the image for a quick demo: Features Interacti

675 Dec 09, 2022