A Python wrapper of Neighbor Retrieval Visualizer (NeRV)

Overview

PyNeRV

A Python wrapper of the dimensionality reduction algorithm Neighbor Retrieval Visualizer (NeRV)

Compile

Set up the paths in Makefile then make.

Usage example

import numpy as np
import matplotlib.pyplot as plt
from nerv import NeRV

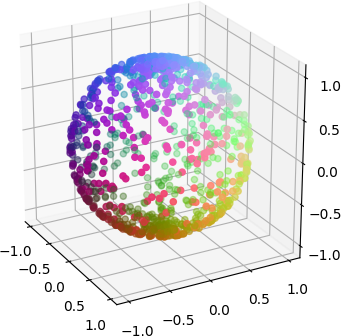
data = np.genfromtxt('dredviz-1.0.2/spheredata.dat', skip_header=1)
color = np.genfromtxt('dredviz-1.0.2/spheredata.col', skip_header=1)
nerv_obj = NeRV(random_state=0)
nerv_obj.fit(data)
print('Final cost = %g' % nerv_obj.cost_)
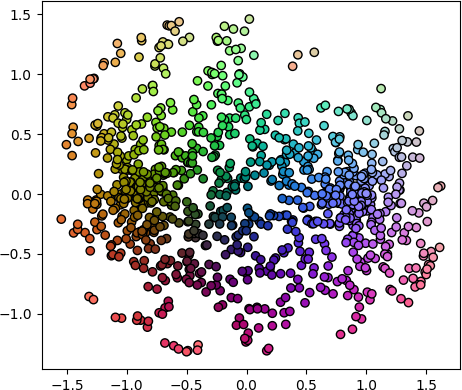
plt.scatter(*nerv_obj.embedding_.T, c=color)
plt.show()

which shows (right)


Reference

@article{venna2010information,
  title={Information retrieval perspective to nonlinear dimensionality reduction for data visualization},
  author={Venna, Jarkko and Peltonen, Jaakko and Nybo, Kristian and Aidos, Helena and Kaski, Samuel},
  journal={Journal of Machine Learning Research},
  volume={11},
  number={Feb},
  pages={451--490},
  year={2010}
}
Tidy data structures, summaries, and visualisations for missing data

naniar naniar provides principled, tidy ways to summarise, visualise, and manipulate missing data with minimal deviations from the workflows in ggplot

Nicholas Tierney 611 Dec 22, 2022
Eulera Dashboard is an easy and intuitive way to get a quick feel of what’s happening on the world’s market.

an easy and intuitive way to get a quick feel of what’s happening on the world’s market ! Eulera dashboard is a tool allows you to monitor historical

Salah Eddine LABIAD 4 Nov 25, 2022
Learn Basic to advanced level Data visualisation techniques from this Repository

Data visualisation Hey, You can learn Basic to advanced level Data visualisation techniques from this Repository. Data visualization is the graphic re

Shashank dwivedi 16 Jan 03, 2023
a robust room presence solution for home automation with nearly no false negatives

Argos Room Presence This project builds a room presence solution on top of Argos. Using just a cheap raspberry pi zero w (plus an attached pi camera,

Angad Singh 46 Sep 18, 2022
A customized interface for single cell track visualisation based on pcnaDeep and napari.

pcnaDeep-napari A customized interface for single cell track visualisation based on pcnaDeep and napari. 👀 Under construction You can get test image

ChanLab 2 Nov 07, 2021
Investment and risk technologies maintained by Fortitudo Technologies.

Fortitudo Technologies Open Source This package allows you to freely explore open-source implementations of some of our fundamental technologies under

Fortitudo Technologies 11 Dec 14, 2022
A TileDB backend for xarray.

TileDB-xarray This library provides a backend engine to xarray using the TileDB Storage Engine. Example usage: import xarray as xr dataset = xr.open_d

TileDB, Inc. 14 Jun 02, 2021
Data-FX is an addon for Blender (2.9) that allows for the visualization of data with different charts

Data-FX Data-FX is an addon for Blender (2.9) that allows for the visualization of data with different charts Currently, there are only 2 chart option

Landon Ferguson 20 Nov 21, 2022
view cool stats related to your discord account.

DiscoStats cool statistics generated using your discord data. How? DiscoStats is not a service that breaks the Discord Terms of Service or Community G

ibrahim hisham 5 Jun 02, 2022
A little word cloud generator in Python

Linux macOS Windows PyPI word_cloud A little word cloud generator in Python. Read more about it on the blog post or the website. The code is tested ag

Andreas Mueller 9.2k Dec 30, 2022
Statistics and Visualization of acceptance rate, main keyword of CVPR 2021 accepted papers for the main Computer Vision conference (CVPR)

Statistics and Visualization of acceptance rate, main keyword of CVPR 2021 accepted papers for the main Computer Vision conference (CVPR)

Hoseong Lee 78 Aug 23, 2022
100 Days of Code The Complete Python Pro Bootcamp for 2022

100-Day-With-Python 100 Days of Code - The Complete Python Pro Bootcamp for 2022. In this course, I spend with python language over 100 days, and I up

Rajdip Das 8 Jun 22, 2022
Data science project for exploratory analysis on the kcse grades dataset (Kamilimu Data Science Track)

Kcse-Data-Analysis Data science project for exploratory analysis on the kcse grades dataset (Kamilimu Data Science Track) Findings The performance of

MUGO BRIAN 1 Feb 23, 2022
Area-weighted venn-diagrams for Python/matplotlib

Venn diagram plotting routines for Python/Matplotlib Routines for plotting area-weighted two- and three-circle venn diagrams. Installation The simples

Konstantin Tretyakov 400 Dec 31, 2022
Parallel t-SNE implementation with Python and Torch wrappers.

Multicore t-SNE This is a multicore modification of Barnes-Hut t-SNE by L. Van der Maaten with python and Torch CFFI-based wrappers. This code also wo

Dmitry Ulyanov 1.7k Jan 09, 2023
UNMAINTAINED! Renders beautiful SVG maps in Python.

Kartograph is not maintained anymore As you probably already guessed from the commit history in this repo, Kartograph.py is not maintained, which mean

1k Dec 09, 2022
Sparkling Pandas

SparklingPandas SparklingPandas aims to make it easy to use the distributed computing power of PySpark to scale your data analysis with Pandas. Sparkl

366 Oct 27, 2022
Example Code Notebooks for Data Visualization in Python

This repository contains sample code scripts for creating awesome data visualizations from scratch using different python libraries (such as matplotli

Javed Ali 27 Jan 04, 2023
Data Visualizer Web-Application

Viz-It Data Visualizer Web-Application If I ask you where most of the data wrangler looses their time ? It is Data Overview and EDA. Presenting "Viz-I

Sagnik Roy 17 Nov 20, 2022
Open-questions - Open questions for Bellingcat technical contributors

Open questions for Bellingcat technical contributors These are difficult, long-term projects that would contribute to open source investigations at Be

Bellingcat 234 Dec 31, 2022