Clustergram - Visualization and diagnostics for cluster analysis in Python

Overview

Clustergram

logo clustergram

Visualization and diagnostics for cluster analysis

DOI

Clustergram is a diagram proposed by Matthias Schonlau in his paper The clustergram: A graph for visualizing hierarchical and nonhierarchical cluster analyses.

In hierarchical cluster analysis, dendrograms are used to visualize how clusters are formed. I propose an alternative graph called a “clustergram” to examine how cluster members are assigned to clusters as the number of clusters increases. This graph is useful in exploratory analysis for nonhierarchical clustering algorithms such as k-means and for hierarchical cluster algorithms when the number of observations is large enough to make dendrograms impractical.

The clustergram was later implemented in R by Tal Galili, who also gives a thorough explanation of the concept.

This is a Python translation of Tal's script written for scikit-learn and RAPIDS cuML implementations of K-Means, Mini Batch K-Means and Gaussian Mixture Model (scikit-learn only) clustering, plus hierarchical/agglomerative clustering using SciPy. Alternatively, you can create clustergram using from_* constructors based on alternative clustering algorithms.

Getting started

You can install clustergram from conda or pip:

conda install clustergram -c conda-forge
pip install clustergram

In any case, you still need to install your selected backend (scikit-learn and scipy or cuML).

The example of clustergram on Palmer penguins dataset:

import seaborn
df = seaborn.load_dataset('penguins')

First we have to select numerical data and scale them.

from sklearn.preprocessing import scale
data = scale(df.drop(columns=['species', 'island', 'sex']).dropna())

And then we can simply pass the data to clustergram.

from clustergram import Clustergram

cgram = Clustergram(range(1, 8))
cgram.fit(data)
cgram.plot()

Default clustergram

Styling

Clustergram.plot() returns matplotlib axis and can be fully customised as any other matplotlib plot.

seaborn.set(style='whitegrid')

cgram.plot(
    ax=ax,
    size=0.5,
    linewidth=0.5,
    cluster_style={"color": "lightblue", "edgecolor": "black"},
    line_style={"color": "red", "linestyle": "-."},
    figsize=(12, 8)
)

Colored clustergram

Mean options

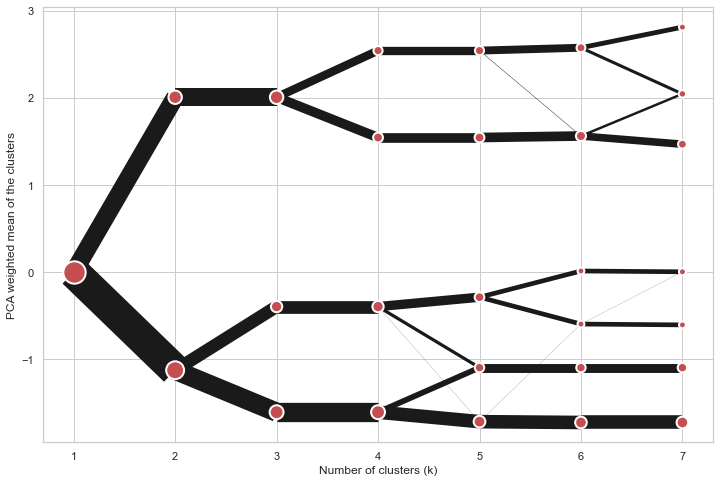
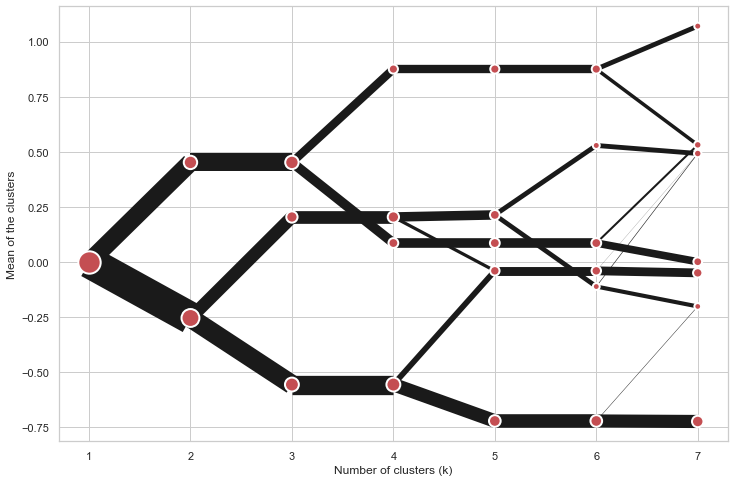
On the y axis, a clustergram can use mean values as in the original paper by Matthias Schonlau or PCA weighted mean values as in the implementation by Tal Galili.

cgram = Clustergram(range(1, 8))
cgram.fit(data)
cgram.plot(figsize=(12, 8), pca_weighted=True)

Default clustergram

cgram = Clustergram(range(1, 8))
cgram.fit(data)
cgram.plot(figsize=(12, 8), pca_weighted=False)

Default clustergram

Scikit-learn, SciPy and RAPIDS cuML backends

Clustergram offers three backends for the computation - scikit-learn and scipy which use CPU and RAPIDS.AI cuML, which uses GPU. Note that all are optional dependencies but you will need at least one of them to generate clustergram.

Using scikit-learn (default):

cgram = Clustergram(range(1, 8), backend='sklearn')
cgram.fit(data)
cgram.plot()

Using cuML:

cgram = Clustergram(range(1, 8), backend='cuML')
cgram.fit(data)
cgram.plot()

data can be all data types supported by the selected backend (including cudf.DataFrame with cuML backend).

Supported methods

Clustergram currently supports K-Means, Mini Batch K-Means, Gaussian Mixture Model and SciPy's hierarchical clustering methods. Note tha GMM and Mini Batch K-Means are supported only for scikit-learn backend and hierarchical methods are supported only for scipy backend.

Using K-Means (default):

cgram = Clustergram(range(1, 8), method='kmeans')
cgram.fit(data)
cgram.plot()

Using Mini Batch K-Means, which can provide significant speedup over K-Means:

cgram = Clustergram(range(1, 8), method='minibatchkmeans', batch_size=100)
cgram.fit(data)
cgram.plot()

Using Gaussian Mixture Model:

cgram = Clustergram(range(1, 8), method='gmm')
cgram.fit(data)
cgram.plot()

Using Ward's hierarchical clustering:

cgram = Clustergram(range(1, 8), method='hierarchical', linkage='ward')
cgram.fit(data)
cgram.plot()

Manual input

Alternatively, you can create clustergram using from_data or from_centers methods based on alternative clustering algorithms.

Using Clustergram.from_data which creates cluster centers as mean or median values:

data = numpy.array([[-1, -1, 0, 10], [1, 1, 10, 2], [0, 0, 20, 4]])
labels = pandas.DataFrame({1: [0, 0, 0], 2: [0, 0, 1], 3: [0, 2, 1]})

cgram = Clustergram.from_data(data, labels)
cgram.plot()

Using Clustergram.from_centers based on explicit cluster centers.:

labels = pandas.DataFrame({1: [0, 0, 0], 2: [0, 0, 1], 3: [0, 2, 1]})
centers = {
            1: np.array([[0, 0]]),
            2: np.array([[-1, -1], [1, 1]]),
            3: np.array([[-1, -1], [1, 1], [0, 0]]),
        }
cgram = Clustergram.from_centers(centers, labels)
cgram.plot(pca_weighted=False)

To support PCA weighted plots you also need to pass data:

cgram = Clustergram.from_centers(centers, labels, data=data)
cgram.plot()

Partial plot

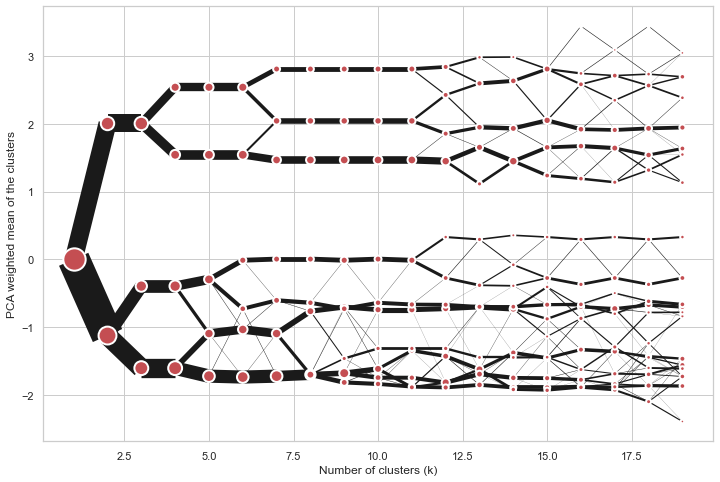
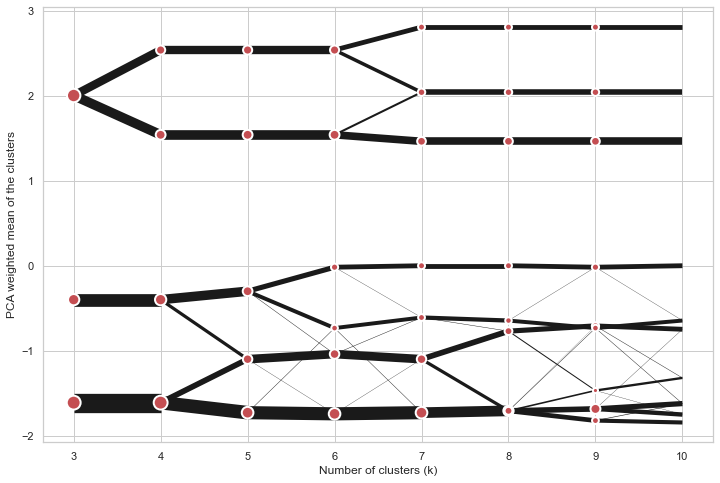
Clustergram.plot() can also plot only a part of the diagram, if you want to focus on a limited range of k.

cgram = Clustergram(range(1, 20))
cgram.fit(data)
cgram.plot(figsize=(12, 8))

Long clustergram

cgram.plot(k_range=range(3, 10), figsize=(12, 8))

Limited clustergram

Additional clustering performance evaluation

Clustergam includes handy wrappers around a selection of clustering performance metrics offered by scikit-learn. Data which were originally computed on GPU are converted to numpy on the fly.

Silhouette score

Compute the mean Silhouette Coefficient of all samples. See scikit-learn documentation for details.

>>> cgram.silhouette_score()
2    0.531540
3    0.447219
4    0.400154
5    0.377720
6    0.372128
7    0.331575
Name: silhouette_score, dtype: float64

Once computed, resulting Series is available as cgram.silhouette. Calling the original method will recompute the score.

Calinski and Harabasz score

Compute the Calinski and Harabasz score, also known as the Variance Ratio Criterion. See scikit-learn documentation for details.

>>> cgram.calinski_harabasz_score()
2    482.191469
3    441.677075
4    400.392131
5    411.175066
6    382.731416
7    352.447569
Name: calinski_harabasz_score, dtype: float64

Once computed, resulting Series is available as cgram.calinski_harabasz. Calling the original method will recompute the score.

Davies-Bouldin score

Compute the Davies-Bouldin score. See scikit-learn documentation for details.

>>> cgram.davies_bouldin_score()
2    0.714064
3    0.943553
4    0.943320
5    0.973248
6    0.950910
7    1.074937
Name: davies_bouldin_score, dtype: float64

Once computed, resulting Series is available as cgram.davies_bouldin. Calling the original method will recompute the score.

Acessing labels

Clustergram stores resulting labels for each of the tested options, which can be accessed as:

>>> cgram.labels
     1  2  3  4  5  6  7
0    0  0  2  2  3  2  1
1    0  0  2  2  3  2  1
2    0  0  2  2  3  2  1
3    0  0  2  2  3  2  1
4    0  0  2  2  0  0  3
..  .. .. .. .. .. .. ..
337  0  1  1  3  2  5  0
338  0  1  1  3  2  5  0
339  0  1  1  1  1  1  4
340  0  1  1  3  2  5  5
341  0  1  1  1  1  1  5

Saving clustergram

You can save both plot and clustergram.Clustergram to a disk.

Saving plot

Clustergram.plot() returns matplotlib axis object and as such can be saved as any other plot:

import matplotlib.pyplot as plt

cgram.plot()
plt.savefig('clustergram.svg')

Saving object

If you want to save your computed clustergram.Clustergram object to a disk, you can use pickle library:

import pickle

with open('clustergram.pickle','wb') as f:
    pickle.dump(cgram, f)

Then loading is equally simple:

with open('clustergram.pickle','rb') as f:
    loaded = pickle.load(f)

References

Schonlau M. The clustergram: a graph for visualizing hierarchical and non-hierarchical cluster analyses. The Stata Journal, 2002; 2 (4):391-402.

Schonlau M. Visualizing Hierarchical and Non-Hierarchical Cluster Analyses with Clustergrams. Computational Statistics: 2004; 19(1):95-111.

https://www.r-statistics.com/2010/06/clustergram-visualization-and-diagnostics-for-cluster-analysis-r-code/

Comments
  • ENH: support interactive bokeh plots

    ENH: support interactive bokeh plots

    Adds Clustergram.bokeh() method which generates clustergram in a form of internactive bokeh plot. On top of an ability to zoom to specific sections shows the count of observations and cluster label (linked to Clustergram.labels).

    To-do:

    • [ ] documentation
    • [x] check RAPIDS compatibility

    I think I'll need to split docs into muliple pages at this point.

    opened by martinfleis 1
  • ENH: from_data and from_centers methods

    ENH: from_data and from_centers methods

    Addind the ability to create clustergram using custom data, without the need to run any cluster algorithm within clustergram itself.

    from_data gets labels and data and creates cluster centers as mean or median values.

    from_centers utilises custom centers when mean/median is not the optimal solution (like in case of GMM for example).

    Closes #10

    opened by martinfleis 1
  • skip k=1 for K-Means

    skip k=1 for K-Means

    k=1 does not need to be modelled, cluster centre is a pure mean of an input array. All the other options require k=1 e.g to fit gaussian.

    Skip k=1 in all k-means implementations to get avoid unnecessary computation.

    opened by martinfleis 0
  • ENH: add bokeh plotting backend

    ENH: add bokeh plotting backend

    With some larger clustergrams it may be quite useful to have the ability to zoom to certain places interactively. I think that bokeh plotting backend would be good for that.

    opened by martinfleis 0
  • ENH: expose labels, refactor plot computation internals, add additional metrics

    ENH: expose labels, refactor plot computation internals, add additional metrics

    Closes #7

    This refactors internals a bit, which in turn allows exposing the actual clustering labels for each tested iteration.

    Aso adding a few additional methods to assess clustering performance on top of clustergram.

    opened by martinfleis 0
  • Support multiple PCAs

    Support multiple PCAs

    The current way of weighting by PCA is hard-coded to use the first one. But it could be useful to see clustergrams weighted by other PCAs as well.

    And it would be super cool to get a 3d version with the first component on one axis and a second one on the other (not sure how useful though :D).

    opened by martinfleis 0
  • Can this work with cluster made by top2vec ?

    Can this work with cluster made by top2vec ?

    Thanks for your interesting package.

    Do you think Clustergram could work with top2vec ? https://github.com/ddangelov/Top2Vec

    I saw that there is the option to create a clustergram from a DataFrame.

    In top2vec, each "document" to cluster is represented as a embedding of a certain dimension, 256 , for example.

    So I could indeed generate a data frame, like this:

    | x0 | x1| ... | x255 | topic | | -----|----|---- | -------| -- | | 0.5| 0.2 | ....| -0.2 | 2 | | 0.7| 0.2 | ....| -0.1 | 2 | | 0.5| 0.2 | ....| -0.2 | 3 |

    Does Clustergram assume anything on the rows of this data frame ? I saw that the from_data method either takes "mean" or "medium" as method to calculate the cluster centers.

    In word vector, we use typically the cosine distance to calculate distances between the vectors. Does this have any influence ?

    top2vec calculates as well the "topic vectors" as a mean of the "document vectors", I believe.

    opened by behrica 17
Releases(v0.6.0)
Owner
Martin Fleischmann
Researcher in geographic data science. Member of @geopandas and @pysal development teams.
Martin Fleischmann
This is a pytorch implementation of the NeurIPS paper GAN Memory with No Forgetting.

GAN Memory for Lifelong learning This is a pytorch implementation of the NeurIPS paper GAN Memory with No Forgetting. Please consider citing our paper

Miaoyun Zhao 43 Dec 27, 2022
PArallel Distributed Deep LEarning: Machine Learning Framework from Industrial Practice (『飞桨』核心框架,深度学习&机器学习高性能单机、分布式训练和跨平台部署)

English | 简体中文 Welcome to the PaddlePaddle GitHub. PaddlePaddle, as the only independent R&D deep learning platform in China, has been officially open

19.4k Jan 04, 2023
A Convolutional Transformer for Keyword Spotting

☢️ Audiomer ☢️ Audiomer: A Convolutional Transformer for Keyword Spotting [ arXiv ] [ Previous SOTA ] [ Model Architecture ] Results on SpeechCommands

49 Jan 27, 2022
Hcaptcha-challenger - Gracefully face hCaptcha challenge with Yolov5(ONNX) embedded solution

hCaptcha Challenger 🚀 Gracefully face hCaptcha challenge with Yolov5(ONNX) embe

593 Jan 03, 2023
PyTorch implementation of Deformable Convolution

Deformable Convolutional Networks in PyTorch This repo is an implementation of Deformable Convolution. Ported from author's MXNet implementation. Buil

411 Dec 16, 2022
Shared Attention for Multi-label Zero-shot Learning

Shared Attention for Multi-label Zero-shot Learning Overview This repository contains the implementation of Shared Attention for Multi-label Zero-shot

dathuynh 26 Dec 14, 2022
Rethinking of Pedestrian Attribute Recognition: A Reliable Evaluation under Zero-Shot Pedestrian Identity Setting

Pytorch Pedestrian Attribute Recognition: A strong PyTorch baseline of pedestrian attribute recognition and multi-label classification.

Jian 79 Dec 18, 2022
Reinforcement learning library(framework) designed for PyTorch, implements DQN, DDPG, A2C, PPO, SAC, MADDPG, A3C, APEX, IMPALA ...

Automatic, Readable, Reusable, Extendable Machin is a reinforcement library designed for pytorch. Build status Platform Status Linux Windows Supported

Iffi 348 Dec 24, 2022
[ICML 2021] Break-It-Fix-It: Learning to Repair Programs from Unlabeled Data

Break-It-Fix-It: Learning to Repair Programs from Unlabeled Data This repo provides the source code & data of our paper: Break-It-Fix-It: Unsupervised

Michihiro Yasunaga 86 Nov 30, 2022
Project for tracking occupancy in Tel-Aviv parking lots.

Ahuzat Dibuk - Tracking occupancy in Tel-Aviv parking lots main.py This module was set-up to be executed on Google Cloud Platform. I run it every 15 m

Geva Kipper 35 Nov 22, 2022
Official PyTorch implementation of "Improving Face Recognition with Large AgeGaps by Learning to Distinguish Children" (BMVC 2021)

Inter-Prototype (BMVC 2021): Official Project Webpage This repository provides the official PyTorch implementation of the following paper: Improving F

Jungsoo Lee 16 Jun 30, 2022
Tensors and Dynamic neural networks in Python with strong GPU acceleration

PyTorch is a Python package that provides two high-level features: Tensor computation (like NumPy) with strong GPU acceleration Deep neural networks b

61.4k Jan 04, 2023
Train Dense Passage Retriever (DPR) with a single GPU

Gradient Cached Dense Passage Retrieval Gradient Cached Dense Passage Retrieval (GC-DPR) - is an extension of the original DPR library. We introduce G

Luyu Gao 92 Jan 02, 2023
Satellite labelling tool for manual labelling of storm top features such as overshooting tops, above-anvil plumes, cold U/Vs, rings etc.

Satellite labelling tool About this app A tool for manual labelling of storm top features such as overshooting tops, above-anvil plumes, cold U/Vs, ri

Czech Hydrometeorological Institute - Satellite Department 10 Sep 14, 2022
Tgbox-bench - Simple TGBOX upload speed benchmark

TGBOX Benchmark This script will benchmark upload speed to TGBOX storage. Build

Non 1 Jan 09, 2022
Understanding Hyperdimensional Computing for Parallel Single-Pass Learning

Understanding Hyperdimensional Computing for Parallel Single-Pass Learning Authors: Tao Yu* Yichi Zhang* Zhiru Zhang Christopher De Sa *: Equal Contri

Cornell RelaxML 4 Sep 08, 2022
Vrcwatch - Supply the local time to VRChat as Avatar Parameters through OSC

English: README-EN.md VRCWatch VRCWatch は、VRChat 内のアバター向けに現在時刻を送信するためのプログラムです。 使

Kosaki Mezumona 17 Nov 30, 2022
A numpy-based implementation of RANSAC for fundamental matrix and homography estimation. The degeneracy updating and local optimization components are included and optional.

Description A numpy-based implementation of RANSAC for fundamental matrix and homography estimation. The degeneracy updating and local optimization co

AoxiangFan 9 Nov 10, 2022
Auto HMM: Automatic Discrete and Continous HMM including Model selection

Auto HMM: Automatic Discrete and Continous HMM including Model selection

Chess_champion 29 Dec 07, 2022
Learning infinite-resolution image processing with GAN and RL from unpaired image datasets, using a differentiable photo editing model.

Exposure: A White-Box Photo Post-Processing Framework ACM Transactions on Graphics (presented at SIGGRAPH 2018) Yuanming Hu1,2, Hao He1,2, Chenxi Xu1,

Yuanming Hu 719 Dec 29, 2022