Personal IMDB Graphs with Bokeh

Overview

Personal IMDB Graphs with Bokeh

Do you like watching movies and also rate all of them in IMDB? Would you like to look at your IMDB stats based on your rated movie data? And also would like to see a bunch of graphs and tables. Come in then, this little script is for you!

Usage

Just start main.py. Also you could start manually (start separetly):

    bokeh serve --show main/ --port 5001
    bokeh serve all_movies/ circles/ directors/ heatmaps/ line_charts/ piecharts/ ratings_with_years/ ratings_with_genres/ stack/ tv_series/ --port 5002

Also, you could start separetly : bokeh serve --show line_charts/

Dependencies

  • Bokeh 2.4
  • Pandas
  • pybase64 (only for reading your .csv file in main/ folder)

Any error? New Ideas?

Please feel free to pull request, If you found any problem. Also you could contact me with [email protected]

Screenshots

All Movies Line Charts Directors Datatable Pie Chart Heatmap Heatmap Stack Circles

For more screenshots, look at Screenshots/ folder.

You might also like...
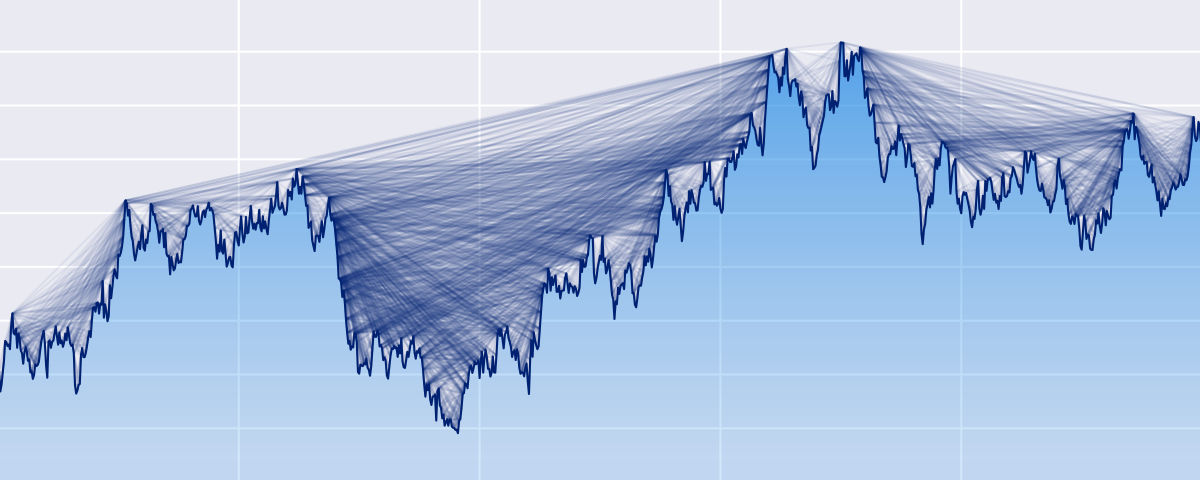
Python ts2vg package provides high-performance algorithm implementations to build visibility graphs from time series data.

ts2vg: Time series to visibility graphs The Python ts2vg package provides high-performance algorithm implementations to build visibility graphs from t

 Flame Graphs visualize profiled code
Flame Graphs visualize profiled code

Flame Graphs visualize profiled code

A simple interpreted language for creating basic mathematical graphs.

graphr Introduction graphr is a small language written to create basic mathematical graphs. It is an interpreted language written in python and essent

Mapomatic - Automatic mapping of compiled circuits to low-noise sub-graphs

mapomatic Automatic mapping of compiled circuits to low-noise sub-graphs Overvie

Kglab - an abstraction layer in Python for building knowledge graphs

Graph Data Science: an abstraction layer in Python for building knowledge graphs, integrated with popular graph libraries – atop Pandas, RDFlib, pySHACL, RAPIDS, NetworkX, iGraph, PyVis, pslpython, pyarrow, etc.

Fully Automated YouTube Channel ▶️with Added Extra Features.

Fully Automated Youtube Channel ▒█▀▀█ █▀▀█ ▀▀█▀▀ ▀▀█▀▀ █░░█ █▀▀▄ █▀▀ █▀▀█ ▒█▀▀▄ █░░█ ░░█░░ ░▒█░░ █░░█ █▀▀▄ █▀▀ █▄▄▀ ▒█▄▄█ ▀▀▀▀ ░░▀░░ ░▒█░░ ░▀▀▀ ▀▀▀░

Bokeh Plotting Backend for Pandas and GeoPandas

Pandas-Bokeh provides a Bokeh plotting backend for Pandas, GeoPandas and Pyspark DataFrames, similar to the already existing Visualization feature of

Bokeh Plotting Backend for Pandas and GeoPandas

Pandas-Bokeh provides a Bokeh plotting backend for Pandas, GeoPandas and Pyspark DataFrames, similar to the already existing Visualization feature of

A real-time financial data streaming pipeline and visualization platform using Apache Kafka, Cassandra, and Bokeh.

Realtime Financial Market Data Visualization and Analysis Introduction This repo shows my project about real-time stock data pipeline. All the code is

Personal Finance Forecaster - An AI tool for forecasting personal expenses

Personal Finance Forecaster - An AI tool for forecasting personal expenses

IMDbPY is a Python package useful to retrieve and manage the data of the IMDb movie database about movies, people, characters and companies

IMDbPY is a Python package for retrieving and managing the data of the IMDb movie database about movies, people and companies. Revamp notice Starting

IMDB film review sentiment classification based on BERT's supervised learning model.

IMDB film review sentiment classification based on BERT's supervised learning model. On the other hand, the model can be extended to other natural language multi-classification tasks.

IMDb + Auto + Unlimited Filter BoT

Telegram Movie Bot Features Auto Filter Manuel Filter IMDB Admin Commands Broadcast Index IMDB search Inline Search Random pics ids and User info Stat

Rottentomatoes, Goodreads and IMDB sites crawler. Semantic Web final project.

Crawler Rottentomatoes, Goodreads and IMDB sites crawler. Crawler written by beautifulsoup, selenium and lxml to gather books and films information an

IMDb + Auto + Unlimited Filter BoT

Telegram Movie Bot Features Auto Filter Manuel Filter IMDB Admin Commands Broadcast Index IMDB search Inline Search Random pics ids and User info Stat

Machine Learning Course Project, IMDB movie review sentiment analysis by lstm, cnn, and transformer

IMDB Sentiment Analysis This is the final project of Machine Learning Courses in Huazhong University of Science and Technology, School of Artificial I

Python IMDB Docker - A docker tutorial to containerize a python script.

Python_IMDB_Docker A docker tutorial to containerize a python script. Build the docker in the current directory: docker build -t python-imdb . Run the

Text classification on IMDB dataset using Keras and Bi-LSTM network

Text classification on IMDB dataset using Keras and Bi-LSTM Text classification on IMDB dataset using Keras and Bi-LSTM network. Usage python3 main.py

Notflix - Notion / Netflix and IMDb to organise your movie dates. Happy Valentine <3 from 0x1za
Notflix - Notion / Netflix and IMDb to organise your movie dates. Happy Valentine 3 from 0x1za

Welcome to notflix 👋 This is a project to help organise shows to watch with my

Releases(v1.0)
  • v1.0(Oct 6, 2021)

    Do you like watching movies and also rate all of them in IMDB? Would you like to look at your IMDB stats based on your rated movie data? And also would like to see a bunch of graphs and tables. Come in then, this little script is for you!

    Source code(tar.gz)
    Source code(zip)
Visualize data of Vietnam's regions with interactive maps.

Plotting Vietnam Development Map This is my personal project that I use plotly to analyse and visualize data of Vietnam's regions with interactive map

1 Jun 26, 2022
Visualizations for machine learning datasets

Introduction The facets project contains two visualizations for understanding and analyzing machine learning datasets: Facets Overview and Facets Dive

PAIR code 7.1k Jan 07, 2023
A set of useful perceptually uniform colormaps for plotting scientific data

Colorcet: Collection of perceptually uniform colormaps Build Status Coverage Latest dev release Latest release Docs What is it? Colorcet is a collecti

HoloViz 590 Dec 31, 2022
Create SVG drawings from vector geodata files (SHP, geojson, etc).

SVGIS Create SVG drawings from vector geodata files (SHP, geojson, etc). SVGIS is great for: creating small multiples, combining lots of datasets in a

Neil Freeman 78 Dec 09, 2022
Python wrapper for Synoptic Data API. Retrieve data from thousands of mesonet stations and networks. Returns JSON from Synoptic as Pandas DataFrame

☁ Synoptic API for Python (unofficial) The Synoptic Mesonet API (formerly MesoWest) gives you access to real-time and historical surface-based weather

Brian Blaylock 23 Jan 06, 2023
Seismic Waveform Inversion Toolbox-1.0

Seismic Waveform Inversion Toolbox (SWIT-1.0)

Haipeng Li 98 Dec 29, 2022
A program that analyzes data from inertia measurement units installed in aircraft and generates g-exceedance curves.

A program that analyzes data from inertia measurement units installed in aircraft and generates g-exceedance curves.

Pooya 1 Dec 02, 2021
Investment and risk technologies maintained by Fortitudo Technologies.

Fortitudo Technologies Open Source This package allows you to freely explore open-source implementations of some of our fundamental technologies under

Fortitudo Technologies 11 Dec 14, 2022
Main repository for Vispy

VisPy: interactive scientific visualization in Python Main website: http://vispy.org VisPy is a high-performance interactive 2D/3D data visualization

vispy 3k Jan 03, 2023
NumPy and Pandas interface to Big Data

Blaze translates a subset of modified NumPy and Pandas-like syntax to databases and other computing systems. Blaze allows Python users a familiar inte

Blaze 3.1k Jan 01, 2023
AB-test-analyzer - Python class to perform AB test analysis

AB-test-analyzer Python class to perform AB test analysis Overview This repo con

13 Jul 16, 2022
Statistical data visualization using matplotlib

seaborn: statistical data visualization Seaborn is a Python visualization library based on matplotlib. It provides a high-level interface for drawing

Michael Waskom 10.2k Dec 30, 2022
📊📈 Serves up Pandas dataframes via the Django REST Framework for use in client-side (i.e. d3.js) visualizations and offline analysis (e.g. Excel)

📊📈 Serves up Pandas dataframes via the Django REST Framework for use in client-side (i.e. d3.js) visualizations and offline analysis (e.g. Excel)

wq framework 1.2k Jan 01, 2023
A site that displays up to date COVID-19 stats, powered by fastpages.

https://covid19dashboards.com This project was built with fastpages Background This project showcases how you can use fastpages to create a static das

GitHub 1.6k Jan 07, 2023
A Bokeh project developed for learning and teaching Bokeh interactive plotting!

Bokeh-Python-Visualization A Bokeh project developed for learning and teaching Bokeh interactive plotting! See my medium blog posts about making bokeh

Will Koehrsen 350 Dec 05, 2022
Simple Inkscape Scripting

Simple Inkscape Scripting Description In the Inkscape vector-drawing program, how would you go about drawing 100 diamonds, each with a random color an

Scott Pakin 140 Dec 27, 2022
ICS-Visualizer is an interactive Industrial Control Systems (ICS) network graph that contains up-to-date ICS metadata

ICS-Visualizer is an interactive Industrial Control Systems (ICS) network graph that contains up-to-date ICS metadata (Name, company, port, user manua

QeeqBox 2 Dec 13, 2021
Pebble is a stat's visualization tool, this will provide a skeleton to develop a monitoring tool.

Pebble is a stat's visualization tool, this will provide a skeleton to develop a monitoring tool.

Aravind Kumar G 2 Nov 17, 2021
Create matplotlib visualizations from the command-line

MatplotCLI Create matplotlib visualizations from the command-line MatplotCLI is a simple utility to quickly create plots from the command-line, levera

Daniel Moura 46 Dec 16, 2022
In-memory Graph Database and Knowledge Graph with Natural Language Interface, compatible with Pandas

CogniPy for Pandas - In-memory Graph Database and Knowledge Graph with Natural Language Interface Whats in the box Reasoning, exploration of RDF/OWL,

Cognitum Octopus 34 Dec 13, 2022