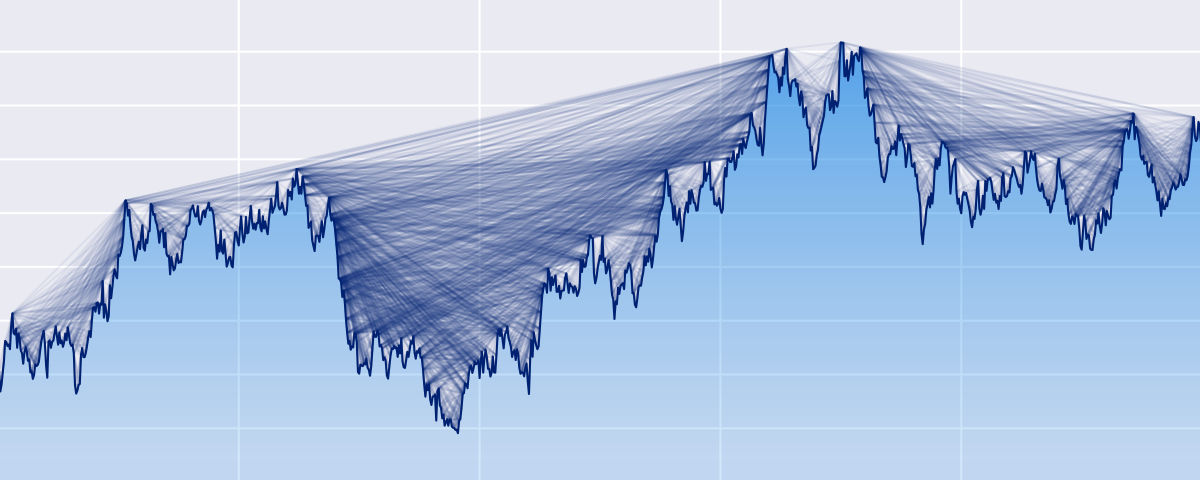
Python ts2vg package provides high-performance algorithm implementations to build visibility graphs from time series data.

Overview

ts2vg: Time series to visibility graphs

pypi pyversions wheel license

Example plot of a visibility graph


The Python ts2vg package provides high-performance algorithm implementations to build visibility graphs from time series data.

The visibility graphs and some of their properties (e.g. degree distributions) are computed quickly and efficiently, even for time series with millions of observations thanks to the use of NumPy and a custom C backend (via Cython) developed for the visibility algorithms.

The visibility graphs are provided according to the mathematical definitions described in:

  • Lucas Lacasa et al., "From time series to complex networks: The visibility graph", 2008.
  • Lucas Lacasa et al., "Horizontal visibility graphs: exact results for random time series", 2009.

An efficient divide-and-conquer algorithm is used to compute the graphs, as described in:

  • Xin Lan et al., "Fast transformation from time series to visibility graphs", 2015.

Installation

The latest released ts2vg version is available at the Python Package Index (PyPI) and can be easily installed by running:

pip install ts2vg

For other advanced uses, to build ts2vg from source Cython is required.

Basic usage

Visibility graph

Building visibility graphs from time series is very simple:

from ts2vg import NaturalVG

ts = [1.0, 0.5, 0.3, 0.7, 1.0, 0.5, 0.3, 0.8]

g = NaturalVG()
g.build(ts)

edges = g.edges

The time series passed can be a list, a tuple, or a numpy 1D array.

Horizontal visibility graph

We can also obtain horizontal visibility graphs in a very similar way:

from ts2vg import HorizontalVG

ts = [1.0, 0.5, 0.3, 0.7, 1.0, 0.5, 0.3, 0.8]

g = HorizontalVG()
g.build(ts)

edges = g.edges

Degree distribution

If we are only interested in the degree distribution of the visibility graph we can pass only_degrees=True to the build method. This will be more efficient in time and memory than computing the whole graph.

g = NaturalVG()
g.build(ts, only_degrees=True)

ks, ps = g.degree_distribution

Directed visibility graph

g = NaturalVG(directed='left_to_right')
g.build(ts)

Weighted visibility graph

g = NaturalVG(weighted='distance')
g.build(ts)

For more information and options see: Examples and API Reference.

Interoperability with other libraries

The graphs obtained can be easily converted to graph objects from other common Python graph libraries such as igraph, NetworkX and SNAP for further analysis.

The following methods are provided:

  • as_igraph()
  • as_networkx()
  • as_snap()

For example:

g = NaturalVG()
g.build(ts)

nx_g = g.as_networkx()

Command line interface

ts2vg can also be used as a command line program directly from the console:

ts2vg ./timeseries.txt -o out.edg

For more help and a list of options run:

ts2vg --help

Contributing

ts2vg can be found on GitHub. Pull requests and issue reports are welcome.

License

ts2vg is licensed under the terms of the MIT License.

You might also like...
The Spectral Diagram (SD) is a new tool for the comparison of time series in the frequency domain

The Spectral Diagram (SD) is a new tool for the comparison of time series in the frequency domain. The SD provides a novel way to display the coherence function, power, amplitude, phase, and skill score of discrete frequencies of two time series. Each SD summarises these quantities in a single plot for multiple targeted frequencies.

The windML framework provides an easy-to-use access to wind data sources within the Python world, building upon numpy, scipy, sklearn, and matplotlib. Renewable Wind Energy, Forecasting, Prediction

windml Build status : The importance of wind in smart grids with a large number of renewable energy resources is increasing. With the growing infrastr

Kglab - an abstraction layer in Python for building knowledge graphs

Graph Data Science: an abstraction layer in Python for building knowledge graphs, integrated with popular graph libraries – atop Pandas, RDFlib, pySHACL, RAPIDS, NetworkX, iGraph, PyVis, pslpython, pyarrow, etc.

Extensible, parallel implementations of t-SNE

openTSNE openTSNE is a modular Python implementation of t-Distributed Stochasitc Neighbor Embedding (t-SNE) [1], a popular dimensionality-reduction al

Extensible, parallel implementations of t-SNE

openTSNE openTSNE is a modular Python implementation of t-Distributed Stochasitc Neighbor Embedding (t-SNE) [1], a popular dimensionality-reduction al

Graphical display tools, to help students debug their class implementations in the Carcassonne family of projects

carcassonne_tools Graphical display tools, to help students debug their class implementations in the Carcassonne family of projects NOTE NOTE NOTE The

Draw interactive NetworkX graphs with Altair

nx_altair Draw NetworkX graphs with Altair nx_altair offers a similar draw API to NetworkX but returns Altair Charts instead. If you'd like to contrib

Draw interactive NetworkX graphs with Altair

nx_altair Draw NetworkX graphs with Altair nx_altair offers a similar draw API to NetworkX but returns Altair Charts instead. If you'd like to contrib

Generate graphs with NetworkX, natively visualize with D3.js and pywebview

webview_d3 This is some PoC code to render graphs created with NetworkX natively using D3.js and pywebview. The main benifit of this approac

Comments
  • help getting started

    help getting started

    I am playing around with ts2vg and I am having a hard time with the plotting using igraph. I try to compute the natural vg for a short time series, but when trying to plot it I get this error:

    Traceback (most recent call last):
      File "\anaconda3\envs\DK_01\lib\site-packages\IPython\core\interactiveshell.py", line 3398, in run_code
        exec(code_obj, self.user_global_ns, self.user_ns)
      File "<ipython-input-1-9a1fdcf342e8>", line 1, in <cell line: 1>
        ig.plot(nx_g, target='graph.pdf')
      File "\anaconda3\envs\DK_01\lib\site-packages\igraph\drawing\__init__.py", line 512, in plot
        result.save()
      File "\anaconda3\envs\DK_01\lib\site-packages\igraph\drawing\__init__.py", line 309, in save
        self._ctx.show_page()
    igraph.drawing.cairo.MemoryError: out of memory
    

    The file created is corrupted.

    Here is my code:

    import numpy as np
    from ts2vg import NaturalVG
    import igraph as ig
    
    import matplotlib.pyplot as plt
    
    # time domain
    t = np.linspace(1, 40)
    dt = np.diff(t)
    
    # build series
    x1 = np.sin(2*np.pi/10*t)
    x2 = np.sin(2*np.pi/15*t)
    
    y = x1 + x2
    
    plt.plot(t, y, '.-')
    plt.show()
    
    # build HVG
    g = NaturalVG()
    g.build(y)
    
    nx_g = g.as_igraph()
    
    # plotting
    ig.plot(nx_g, target='graph.pdf')
    

    I am using ts2vg 1.0.0, igraph 0.9.11, and pycairo 1.21.0

    opened by ACatAC 1
Releases(v1.0.0)
Make your BSC transaction simple.

bsc_trade_history Make your BSC transaction simple. 中文ReadMe Background: inspired by debank ,Practice my hands on this small project Blog:Crypto-BscTr

foolisheddy 7 Jul 06, 2022
2021 grafana arbitrary file read

2021_grafana_arbitrary_file_read base on pocsuite3 try 40 default plugins of grafana alertlist annolist barchart cloudwatch dashlist elasticsearch gra

ATpiu 5 Nov 09, 2022
🐍PyNode Next allows you to easily create beautiful graph visualisations and animations

PyNode Next A complete rewrite of PyNode for the modern era. Up to five times faster than the original PyNode. PyNode Next allows you to easily create

ehne 3 Feb 12, 2022
Jupyter notebook and datasets from the pandas Q&A video series

Python pandas Q&A video series Read about the series, and view all of the videos on one page: Easier data analysis in Python with pandas. Jupyter Note

Kevin Markham 2k Jan 05, 2023
Monochromatic colorscheme for matplotlib with opinionated sensible default

Monochromatic colorscheme for matplotlib with opinionated sensible default If you need a simple monochromatic colorscheme for your matplotlib figures,

Aria Ghora Prabono 2 May 06, 2022
A high-level plotting API for pandas, dask, xarray, and networkx built on HoloViews

hvPlot A high-level plotting API for the PyData ecosystem built on HoloViews. Build Status Coverage Latest dev release Latest release Docs What is it?

HoloViz 694 Jan 04, 2023
Make sankey, alluvial and sankey bump plots in ggplot

The goal of ggsankey is to make beautiful sankey, alluvial and sankey bump plots in ggplot2

David Sjoberg 156 Jan 03, 2023
Glue is a python project to link visualizations of scientific datasets across many files.

Glue Glue is a python project to link visualizations of scientific datasets across many files. Click on the image for a quick demo: Features Interacti

675 Dec 09, 2022
finds grocery stores and stuff next to route (gpx)

Route-Report Route report is a command-line utility that can be used to locate points-of-interest near your planned route (gpx). The results are based

Clemens Mosig 5 Oct 10, 2022
A streamlit component for bi-directional communication with bokeh plots.

Streamlit Bokeh Events A streamlit component for bi-directional communication with bokeh plots. Its just a workaround till streamlit team releases sup

Ashish Shukla 123 Dec 25, 2022
A Python package that provides evaluation and visualization tools for the DexYCB dataset

DexYCB Toolkit DexYCB Toolkit is a Python package that provides evaluation and visualization tools for the DexYCB dataset. The dataset and results wer

NVIDIA Research Projects 107 Dec 26, 2022
Drag’n’drop Pivot Tables and Charts for Jupyter/IPython Notebook, care of PivotTable.js

pivottablejs: the Python module Drag’n’drop Pivot Tables and Charts for Jupyter/IPython Notebook, care of PivotTable.js Installation pip install pivot

Nicolas Kruchten 512 Dec 26, 2022
Python & Julia port of codes in excellent R books

X4DS This repo is a collection of Python & Julia port of codes in the following excellent R books: An Introduction to Statistical Learning (ISLR) Stat

Gitony 5 Jun 21, 2022
Python support for Godot 🐍🐍🐍

Godot Python, because you want Python on Godot ! The goal of this project is to provide Python language support as a scripting module for the Godot ga

Emmanuel Leblond 1.4k Jan 04, 2023
又一个云探针

ServerStatus-Murasame 感谢ServerStatus-Hotaru,又一个云探针诞生了(大雾 本项目在ServerStatus-Hotaru的基础上使用fastapi重构了服务端,部分修改了客户端与前端 项目还在非常原始的阶段,可能存在严重的问题 演示站:https://stat

6 Oct 19, 2021
Interactive chemical viewer for 2D structures of small molecules

👀 mols2grid mols2grid is an interactive chemical viewer for 2D structures of small molecules, based on RDKit. ➡️ Try the demo notebook on Google Cola

Cédric Bouysset 154 Dec 26, 2022
A declarative (epi)genomics visualization library for Python

gos is a declarative (epi)genomics visualization library for Python. It is built on top of the Gosling JSON specification, providing a simplified interface for authoring interactive genomic visualiza

Gosling 107 Dec 14, 2022
Simulation du problème de Monty Hall avec Python et matplotlib

Le problème de Monty Hall C'est un jeu télévisé où il y a trois portes sur le plateau de jeu. Seule une de ces portes cache un trésor. Il n'y a rien d

ETCHART YANG 1 Jan 06, 2022
A curated list of awesome Dash (plotly) resources

Awesome Dash A curated list of awesome Dash (plotly) resources Dash is a productive Python framework for building web applications. Written on top of

Luke Singham 1.7k Dec 26, 2022
A Python package for caclulations and visualizations in geological sciences.

geo_calcs A Python package for caclulations and visualizations in geological sciences. Free software: MIT license Documentation: https://geo-calcs.rea

Drew Heasman 1 Jul 12, 2022