A game theoretic approach to explain the output of any machine learning model.

Overview


Binder Documentation Status

SHAP (SHapley Additive exPlanations) is a game theoretic approach to explain the output of any machine learning model. It connects optimal credit allocation with local explanations using the classic Shapley values from game theory and their related extensions (see papers for details and citations).

Install

SHAP can be installed from either PyPI or conda-forge:

pip install shap
or
conda install -c conda-forge shap

Tree ensemble example (XGBoost/LightGBM/CatBoost/scikit-learn/pyspark models)

While SHAP can explain the output of any machine learning model, we have developed a high-speed exact algorithm for tree ensemble methods (see our Nature MI paper). Fast C++ implementations are supported for XGBoost, LightGBM, CatBoost, scikit-learn and pyspark tree models:

import xgboost
import shap

# train an XGBoost model
X, y = shap.datasets.boston()
model = xgboost.XGBRegressor().fit(X, y)

# explain the model's predictions using SHAP
# (same syntax works for LightGBM, CatBoost, scikit-learn, transformers, Spark, etc.)
explainer = shap.Explainer(model)
shap_values = explainer(X)

# visualize the first prediction's explanation
shap.plots.waterfall(shap_values[0])

The above explanation shows features each contributing to push the model output from the base value (the average model output over the training dataset we passed) to the model output. Features pushing the prediction higher are shown in red, those pushing the prediction lower are in blue. Another way to visualize the same explanation is to use a force plot (these are introduced in our Nature BME paper):

# visualize the first prediction's explanation with a force plot
shap.plots.force(shap_values[0])

If we take many force plot explanations such as the one shown above, rotate them 90 degrees, and then stack them horizontally, we can see explanations for an entire dataset (in the notebook this plot is interactive):

# visualize all the training set predictions
shap.plots.force(shap_values)

To understand how a single feature effects the output of the model we can plot the SHAP value of that feature vs. the value of the feature for all the examples in a dataset. Since SHAP values represent a feature's responsibility for a change in the model output, the plot below represents the change in predicted house price as RM (the average number of rooms per house in an area) changes. Vertical dispersion at a single value of RM represents interaction effects with other features. To help reveal these interactions we can color by another feature. If we pass the whole explanation tensor to the color argument the scatter plot will pick the best feature to color by. In this case it picks RAD (index of accessibility to radial highways) since that highlights that the average number of rooms per house has less impact on home price for areas with a high RAD value.

# create a dependence scatter plot to show the effect of a single feature across the whole dataset
shap.plots.scatter(shap_values[:,"RM"], color=shap_values)

To get an overview of which features are most important for a model we can plot the SHAP values of every feature for every sample. The plot below sorts features by the sum of SHAP value magnitudes over all samples, and uses SHAP values to show the distribution of the impacts each feature has on the model output. The color represents the feature value (red high, blue low). This reveals for example that a high LSTAT (% lower status of the population) lowers the predicted home price.

# summarize the effects of all the features
shap.plots.beeswarm(shap_values)

We can also just take the mean absolute value of the SHAP values for each feature to get a standard bar plot (produces stacked bars for multi-class outputs):

shap.plots.bar(shap_values)

Natural language example (transformers)

SHAP has specific support for natural language models like those in the Hugging Face transformers library. By adding coalitional rules to traditional Shapley values we can form games that explain large modern NLP model using very few function evaluations. Using this functionality is as simple as passing a supported transformers pipeline to SHAP:

import transformers
import shap

# load a transformers pipeline model
model = transformers.pipeline('sentiment-analysis', return_all_scores=True)

# explain the model on two sample inputs
explainer = shap.Explainer(model) 
shap_values = explainer(["What a great movie! ...if you have no taste."])

# visualize the first prediction's explanation for the POSITIVE output class
shap.plots.text(shap_values[0, :, "POSITIVE"])

Deep learning example with DeepExplainer (TensorFlow/Keras models)

Deep SHAP is a high-speed approximation algorithm for SHAP values in deep learning models that builds on a connection with DeepLIFT described in the SHAP NIPS paper. The implementation here differs from the original DeepLIFT by using a distribution of background samples instead of a single reference value, and using Shapley equations to linearize components such as max, softmax, products, divisions, etc. Note that some of these enhancements have also been since integrated into DeepLIFT. TensorFlow models and Keras models using the TensorFlow backend are supported (there is also preliminary support for PyTorch):

# ...include code from https://github.com/keras-team/keras/blob/master/examples/mnist_cnn.py

import shap
import numpy as np

# select a set of background examples to take an expectation over
background = x_train[np.random.choice(x_train.shape[0], 100, replace=False)]

# explain predictions of the model on four images
e = shap.DeepExplainer(model, background)
# ...or pass tensors directly
# e = shap.DeepExplainer((model.layers[0].input, model.layers[-1].output), background)
shap_values = e.shap_values(x_test[1:5])

# plot the feature attributions
shap.image_plot(shap_values, -x_test[1:5])

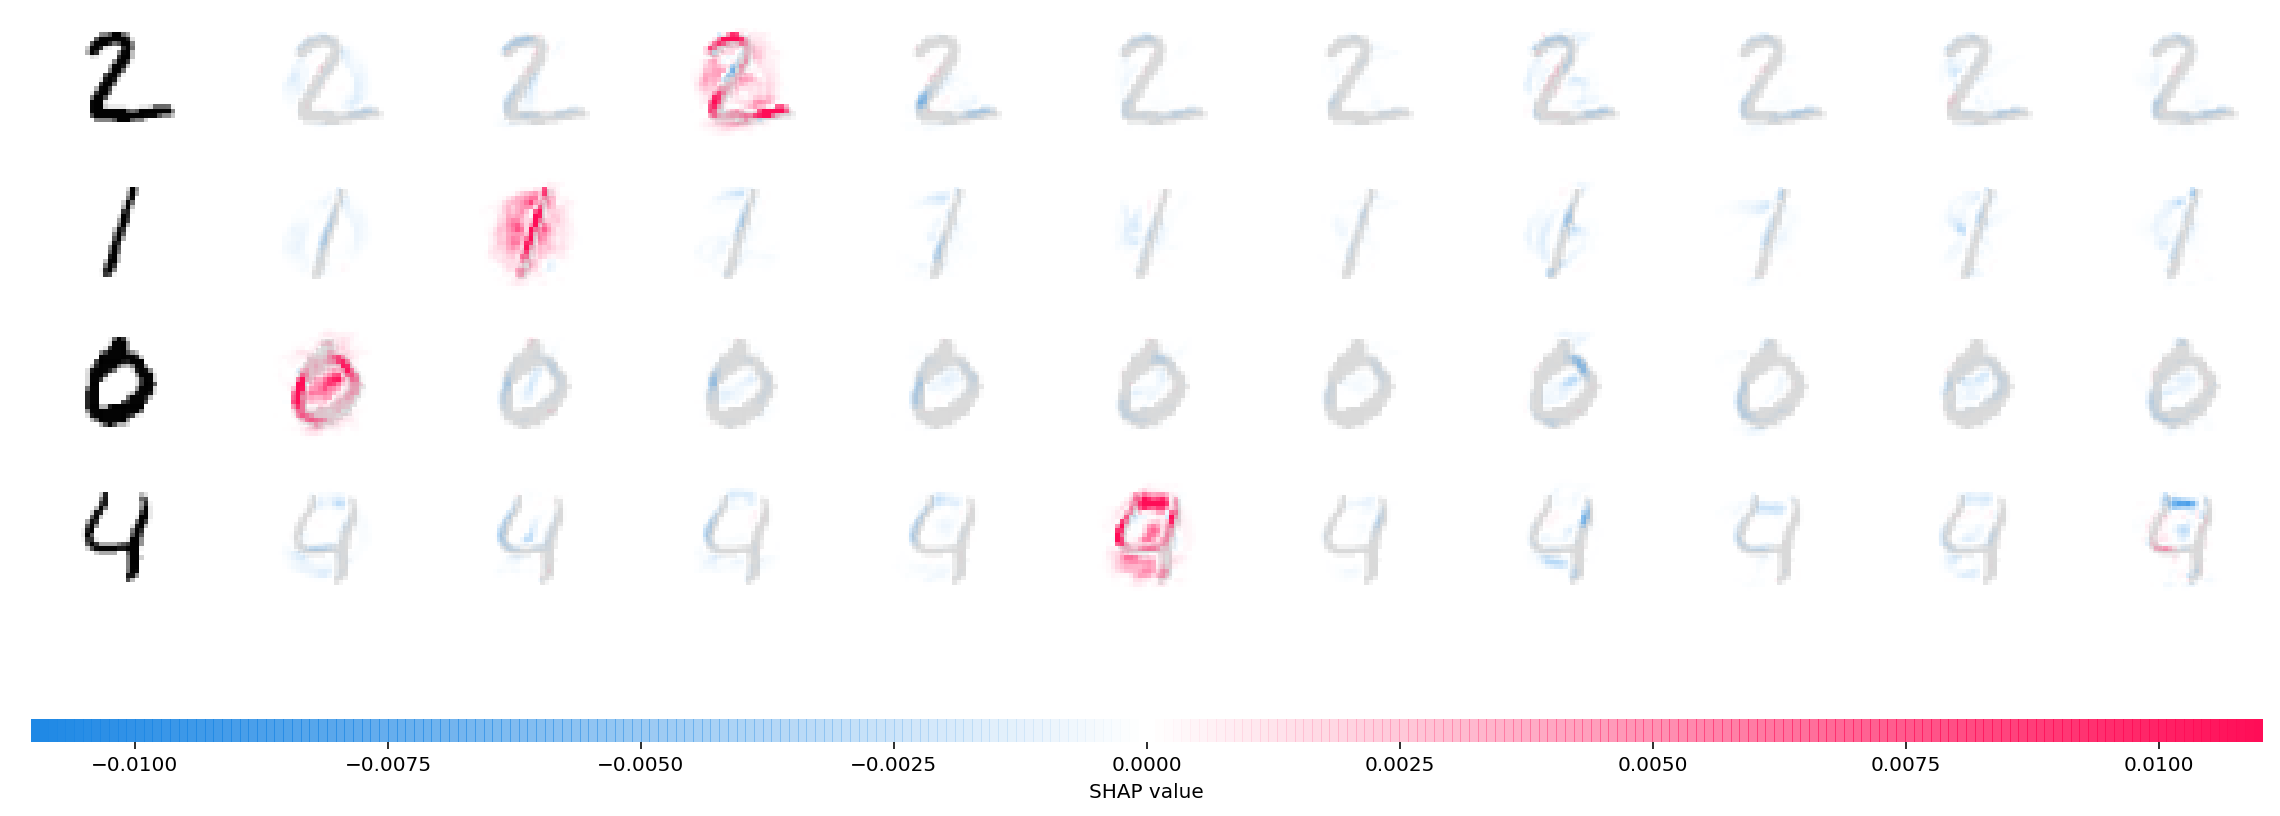
The plot above explains ten outputs (digits 0-9) for four different images. Red pixels increase the model's output while blue pixels decrease the output. The input images are shown on the left, and as nearly transparent grayscale backings behind each of the explanations. The sum of the SHAP values equals the difference between the expected model output (averaged over the background dataset) and the current model output. Note that for the 'zero' image the blank middle is important, while for the 'four' image the lack of a connection on top makes it a four instead of a nine.

Deep learning example with GradientExplainer (TensorFlow/Keras/PyTorch models)

Expected gradients combines ideas from Integrated Gradients, SHAP, and SmoothGrad into a single expected value equation. This allows an entire dataset to be used as the background distribution (as opposed to a single reference value) and allows local smoothing. If we approximate the model with a linear function between each background data sample and the current input to be explained, and we assume the input features are independent then expected gradients will compute approximate SHAP values. In the example below we have explained how the 7th intermediate layer of the VGG16 ImageNet model impacts the output probabilities.

from keras.applications.vgg16 import VGG16
from keras.applications.vgg16 import preprocess_input
import keras.backend as K
import numpy as np
import json
import shap

# load pre-trained model and choose two images to explain
model = VGG16(weights='imagenet', include_top=True)
X,y = shap.datasets.imagenet50()
to_explain = X[[39,41]]

# load the ImageNet class names
url = "https://s3.amazonaws.com/deep-learning-models/image-models/imagenet_class_index.json"
fname = shap.datasets.cache(url)
with open(fname) as f:
    class_names = json.load(f)

# explain how the input to the 7th layer of the model explains the top two classes
def map2layer(x, layer):
    feed_dict = dict(zip([model.layers[0].input], [preprocess_input(x.copy())]))
    return K.get_session().run(model.layers[layer].input, feed_dict)
e = shap.GradientExplainer(
    (model.layers[7].input, model.layers[-1].output),
    map2layer(X, 7),
    local_smoothing=0 # std dev of smoothing noise
)
shap_values,indexes = e.shap_values(map2layer(to_explain, 7), ranked_outputs=2)

# get the names for the classes
index_names = np.vectorize(lambda x: class_names[str(x)][1])(indexes)

# plot the explanations
shap.image_plot(shap_values, to_explain, index_names)

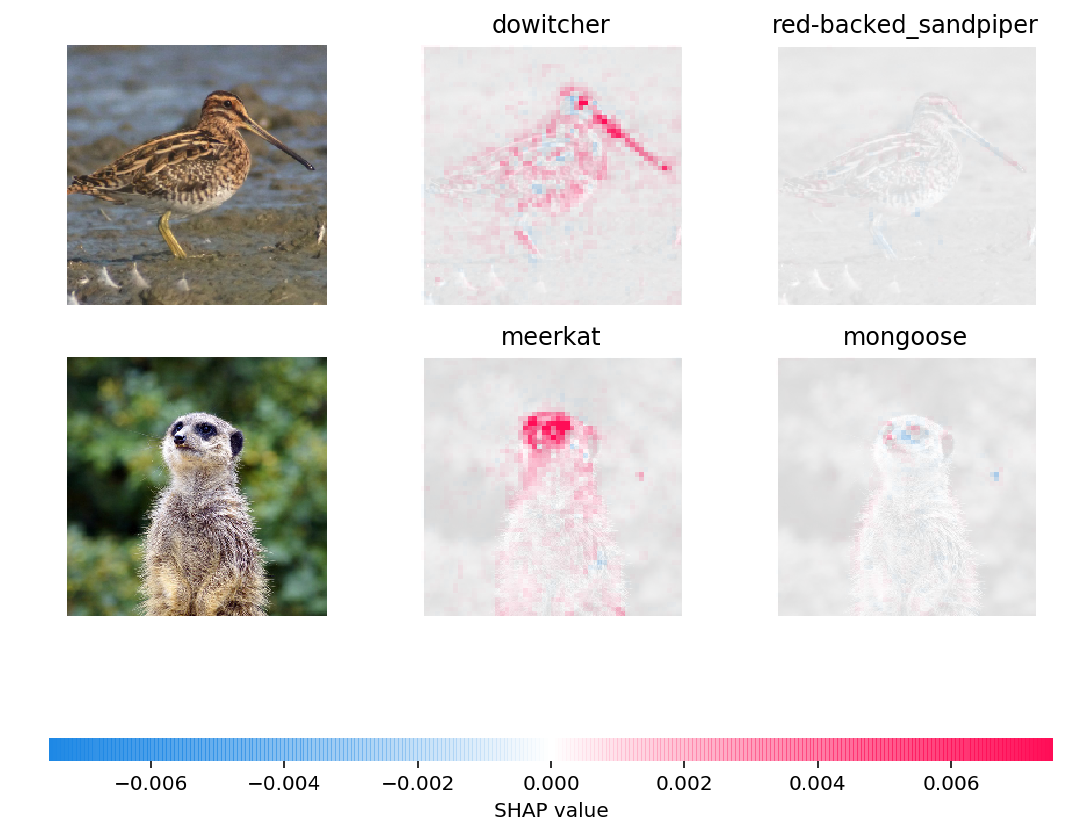
Predictions for two input images are explained in the plot above. Red pixels represent positive SHAP values that increase the probability of the class, while blue pixels represent negative SHAP values the reduce the probability of the class. By using ranked_outputs=2 we explain only the two most likely classes for each input (this spares us from explaining all 1,000 classes).

Model agnostic example with KernelExplainer (explains any function)

Kernel SHAP uses a specially-weighted local linear regression to estimate SHAP values for any model. Below is a simple example for explaining a multi-class SVM on the classic iris dataset.

import sklearn
import shap
from sklearn.model_selection import train_test_split

# print the JS visualization code to the notebook
shap.initjs()

# train a SVM classifier
X_train,X_test,Y_train,Y_test = train_test_split(*shap.datasets.iris(), test_size=0.2, random_state=0)
svm = sklearn.svm.SVC(kernel='rbf', probability=True)
svm.fit(X_train, Y_train)

# use Kernel SHAP to explain test set predictions
explainer = shap.KernelExplainer(svm.predict_proba, X_train, link="logit")
shap_values = explainer.shap_values(X_test, nsamples=100)

# plot the SHAP values for the Setosa output of the first instance
shap.force_plot(explainer.expected_value[0], shap_values[0][0,:], X_test.iloc[0,:], link="logit")

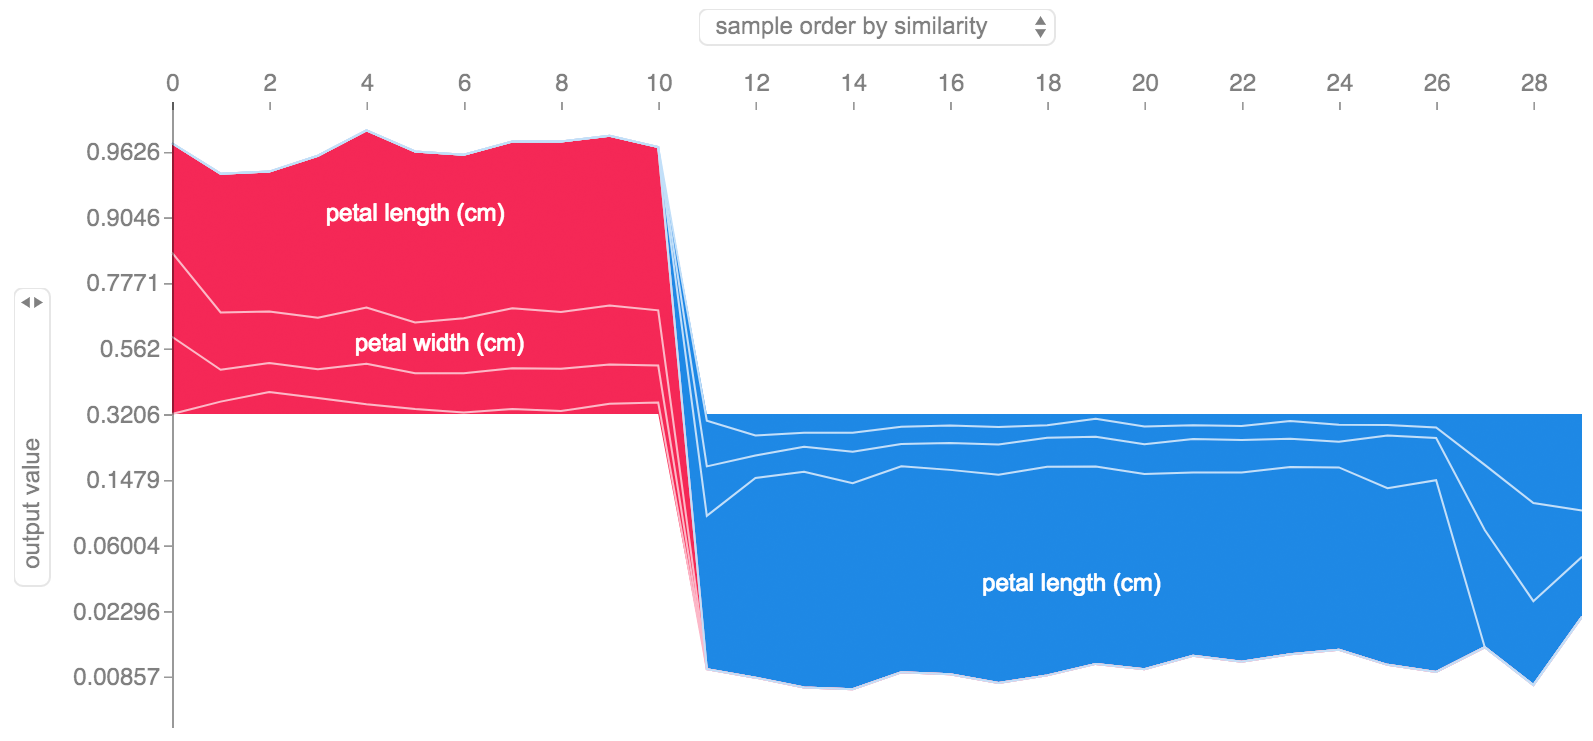
The above explanation shows four features each contributing to push the model output from the base value (the average model output over the training dataset we passed) towards zero. If there were any features pushing the class label higher they would be shown in red.

If we take many explanations such as the one shown above, rotate them 90 degrees, and then stack them horizontally, we can see explanations for an entire dataset. This is exactly what we do below for all the examples in the iris test set:

# plot the SHAP values for the Setosa output of all instances
shap.force_plot(explainer.expected_value[0], shap_values[0], X_test, link="logit")

SHAP Interaction Values

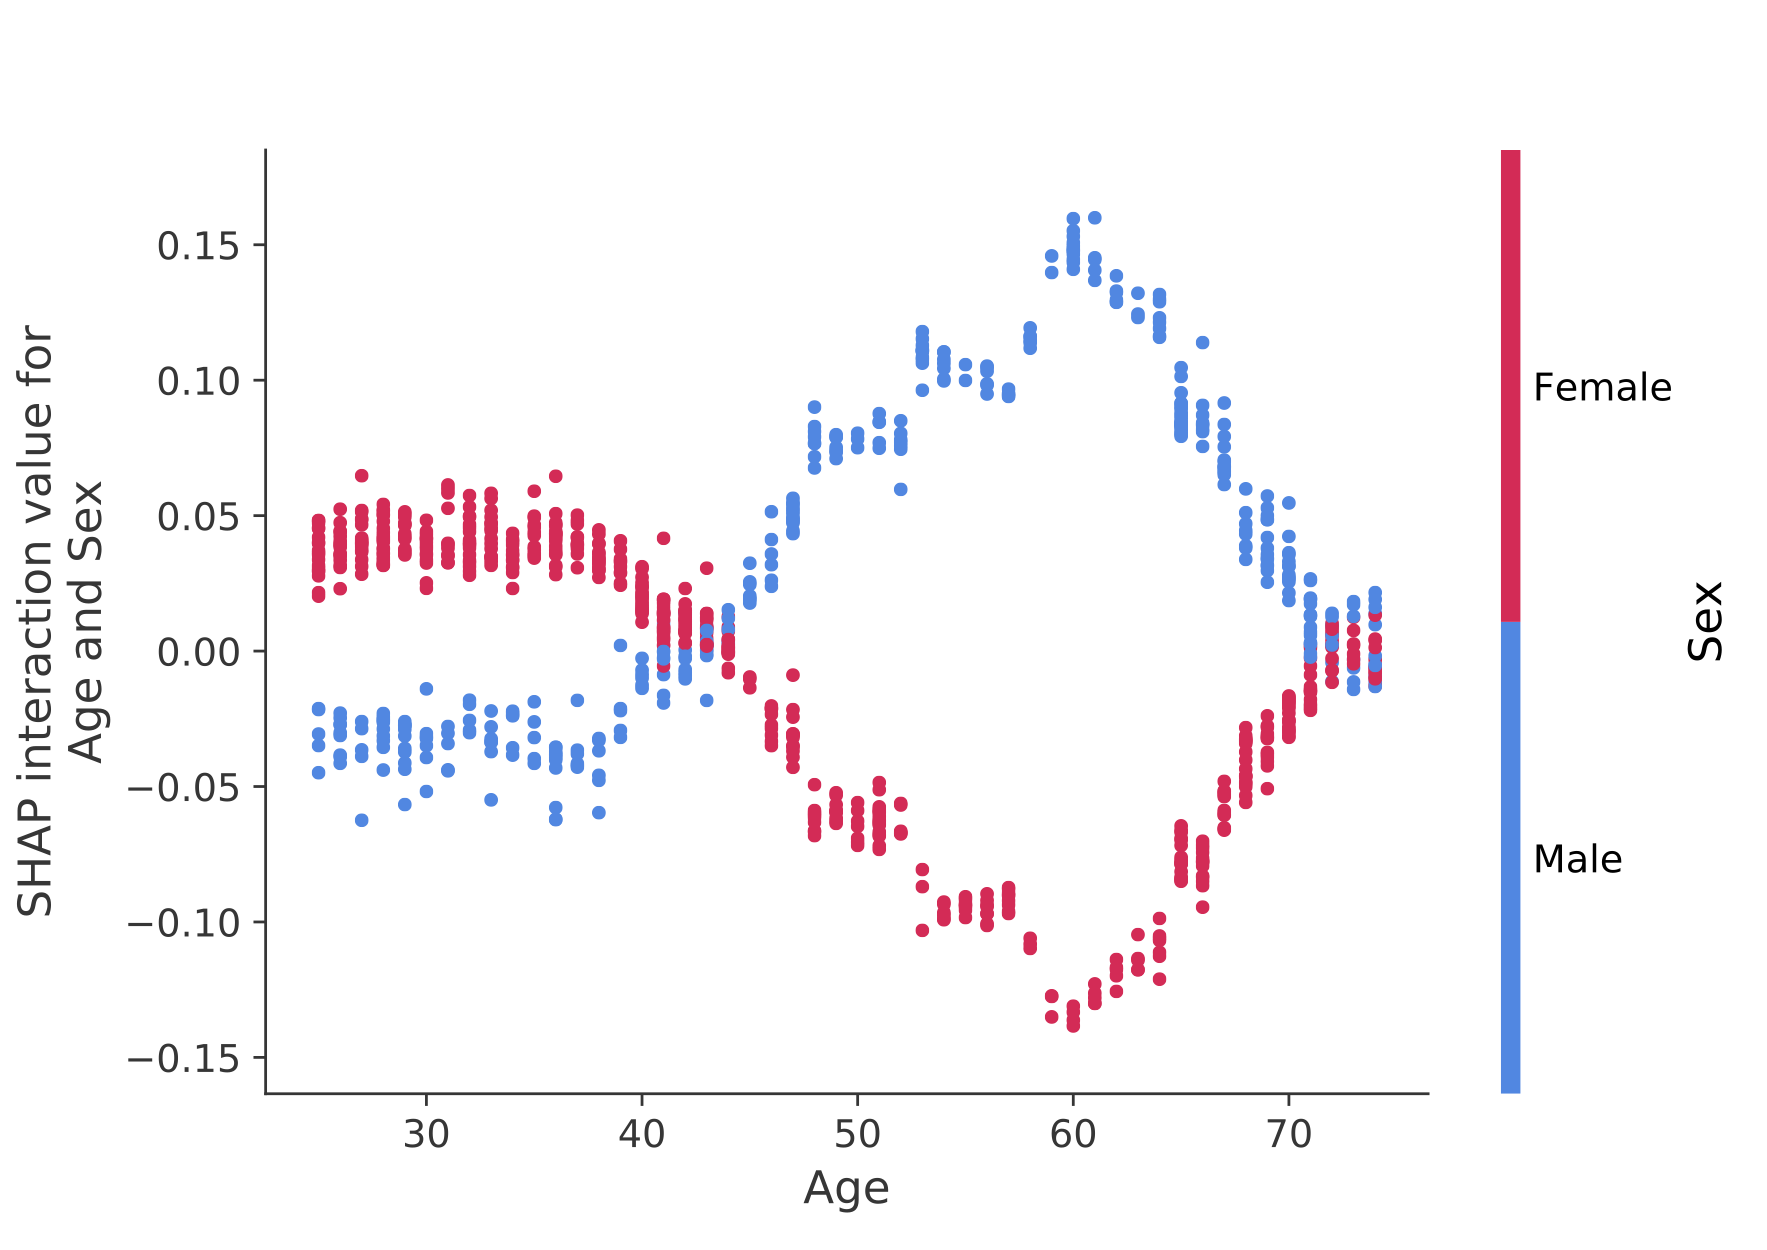
SHAP interaction values are a generalization of SHAP values to higher order interactions. Fast exact computation of pairwise interactions are implemented for tree models with shap.TreeExplainer(model).shap_interaction_values(X). This returns a matrix for every prediction, where the main effects are on the diagonal and the interaction effects are off-diagonal. These values often reveal interesting hidden relationships, such as how the increased risk of death peaks for men at age 60 (see the NHANES notebook for details):

Sample notebooks

The notebooks below demonstrate different use cases for SHAP. Look inside the notebooks directory of the repository if you want to try playing with the original notebooks yourself.

TreeExplainer

An implementation of Tree SHAP, a fast and exact algorithm to compute SHAP values for trees and ensembles of trees.

DeepExplainer

An implementation of Deep SHAP, a faster (but only approximate) algorithm to compute SHAP values for deep learning models that is based on connections between SHAP and the DeepLIFT algorithm.

GradientExplainer

An implementation of expected gradients to approximate SHAP values for deep learning models. It is based on connections between SHAP and the Integrated Gradients algorithm. GradientExplainer is slower than DeepExplainer and makes different approximation assumptions.

LinearExplainer

For a linear model with independent features we can analytically compute the exact SHAP values. We can also account for feature correlation if we are willing to estimate the feature covaraince matrix. LinearExplainer supports both of these options.

KernelExplainer

An implementation of Kernel SHAP, a model agnostic method to estimate SHAP values for any model. Because it makes not assumptions about the model type, KernelExplainer is slower than the other model type specific algorithms.

  • Census income classification with scikit-learn - Using the standard adult census income dataset, this notebook trains a k-nearest neighbors classifier using scikit-learn and then explains predictions using shap.

  • ImageNet VGG16 Model with Keras - Explain the classic VGG16 convolutional nerual network's predictions for an image. This works by applying the model agnostic Kernel SHAP method to a super-pixel segmented image.

  • Iris classification - A basic demonstration using the popular iris species dataset. It explains predictions from six different models in scikit-learn using shap.

Documentation notebooks

These notebooks comprehensively demonstrate how to use specific functions and objects.

Methods Unified by SHAP

  1. LIME: Ribeiro, Marco Tulio, Sameer Singh, and Carlos Guestrin. "Why should i trust you?: Explaining the predictions of any classifier." Proceedings of the 22nd ACM SIGKDD International Conference on Knowledge Discovery and Data Mining. ACM, 2016.

  2. Shapley sampling values: Strumbelj, Erik, and Igor Kononenko. "Explaining prediction models and individual predictions with feature contributions." Knowledge and information systems 41.3 (2014): 647-665.

  3. DeepLIFT: Shrikumar, Avanti, Peyton Greenside, and Anshul Kundaje. "Learning important features through propagating activation differences." arXiv preprint arXiv:1704.02685 (2017).

  4. QII: Datta, Anupam, Shayak Sen, and Yair Zick. "Algorithmic transparency via quantitative input influence: Theory and experiments with learning systems." Security and Privacy (SP), 2016 IEEE Symposium on. IEEE, 2016.

  5. Layer-wise relevance propagation: Bach, Sebastian, et al. "On pixel-wise explanations for non-linear classifier decisions by layer-wise relevance propagation." PloS one 10.7 (2015): e0130140.

  6. Shapley regression values: Lipovetsky, Stan, and Michael Conklin. "Analysis of regression in game theory approach." Applied Stochastic Models in Business and Industry 17.4 (2001): 319-330.

  7. Tree interpreter: Saabas, Ando. Interpreting random forests. http://blog.datadive.net/interpreting-random-forests/

Citations

The algorithms and visualizations used in this package came primarily out of research in Su-In Lee's lab at the University of Washington, and Microsoft Research. If you use SHAP in your research we would appreciate a citation to the appropriate paper(s):

Comments
  • Output value in binary classification task is outside [0, 1] range

    Output value in binary classification task is outside [0, 1] range

    Hi @slundberg,

    I've been playing with a binary classification task using XGBoost and I noticed an unexpected (for me at least) behaviour. I replicated it using the adult dataset you're providing.

    So, after training a binary classfication XGBoost model and plotting the SHAP values for a case, I'm getting the following:

    image

    Both the base value and the output value are outside the [0, 1] range. Is this the expected bahavior? If so, how can someone interpret this?

    opened by asstergi 40
  • Reshap error for SHAP calculation

    Reshap error for SHAP calculation

    Hi Scott,

    We got a reshape error when trying to test SHAP on our data. Have you seen something similar? ValueError: cannot reshape array of size 207506055 into shape (255235,0,815)

    Also please see similar errors reported here https://github.com/dmlc/xgboost/issues/4276 https://discuss.xgboost.ai/t/scala-spark-xgboost-v0-81-shap-problem/817/2

    Let me know if you need to more information to investigate.

    Best, Wei

    bug 
    opened by kongwei9901 32
  • Saving SHAP plots programmatically in Python

    Saving SHAP plots programmatically in Python

    First off, thanks a lot for such an awesome tool!

    I think I might be missing something obvious, but I'm trying to save SHAP plots from Python, that I'm displaying with the shap plotting functions. I tried a couple ways:

    import matplotlib.pyplot as plt
    ...
    shap.summary_plot(shap_values, final_model_features)
    plt.savefig('scratch.png')
    

    and...

    import matplotlib.pyplot as plt
    ...
    fig = shap.summary_plot(shap_values, final_model_features)
    plt.savefig('scratch.png')
    

    but each just saves a blank image. Is there something obvious I'm missing to programmatically save these awesome plots from Python? Or should I just be re-generating them in matplotlib off the SHAP values matrix to do that? Thanks!

    opened by MaxPowerWasTaken 31
  • TreeExplainer with xgboost model trained on GPU dies.

    TreeExplainer with xgboost model trained on GPU dies.

    Hi, I've train quite a huge model using GPU, and save/load it before using with TreeExplainer(). The problem is the jupyter kernel dies when I call TreeExplainer(model).

    I supposed that it's because the model is too big to fit GPU memory, so I tried to change the model's parameter to 'cpu_predictor' using set_params method, so that the SHAP internally use CPU & RAM for the calculation.

    But it doesn't work as I expected. Even if I changed the predictor to use CPU, the jupyter kernel still dies. There's no error log so I couldn't attach here. The program just dies. What can I do with this?

    Here's my code

    def load_model(fname):
        model = xgb.XGBClassifier()
        model.load_model(fname)
        with open(fname.replace('.xgboost', '.json'), encoding='utf-8') as fin:
            params = json.load(fin)
        model.set_params(**params)
        return model
    
    model = load_model('./model/model_2-gram_2019-02-20T15-10-38.xgboost')
    
    params = {
         'tree_method': 'hist',
         'nthread': 4,
         'predictor': 'cpu_predictor', 
         'n_gpus': 1
    }
    model.set_params(**params)
    
    # compute the SHAP values for every prediciton in the validation dataset
    # DIES HERE!
    explainer = shap.TreeExplainer(model)
    
    todo 
    opened by kyoungrok0517 28
  • How to speed up SHAP computation

    How to speed up SHAP computation

    Hi,

    The package itself is really interesting and intuitive to use. I notice however it takes quite long time to run on neural network with practical feature & sample size using KernelExplainer. Question, is there any document to explain how to properly choose

    1. sample size fed into shap.KernelExplainer, and what is the guiding principal to choose these samples;
    2. number of samples fed into function explainer.shap_values, I would assume it has something to do with number of features(columns)

    For example, I have over 1 million record with 400 raw features (continuous + unencoded categorical). Any suggestion would be appreciated.

    screen shot 2018-05-08 at 2 50 41 pm

    Above screen shot is the example using 50 samples in KernelExplainer as typical feature values and 2000 case with 500 repeats in shap_values perturbation.

    opened by bingojojstu 28
  • shap.summary_plot displaying gray plot

    shap.summary_plot displaying gray plot

    screen shot 2019-01-23 at 8 56 37 pm

    I'm facing this issue where the features are not getting the expected blue and red colors. Does anyone have any idea why this might be so? Thank you!

    opened by terryyylim 23
  • IndexError: list index out of range

    IndexError: list index out of range

    I am running the following code:

    from catboost.datasets import *
    train_df, _ = catboost.datasets.amazon()
    ix = 100
    X_train = train_df.drop('ACTION', axis=1)[:ix]
    y_train = train_df.ACTION[:ix]
    X_val = train_df.drop('ACTION', axis=1)[ix:ix+20]
    y_val = train_df.ACTION[ix:ix+20]
    model = CatBoostClassifier(iterations=100, learning_rate=0.5, random_seed=12)
    model.fit(X_train, y_train, eval_set=(X_val, y_val), verbose=False, plot=False)
    shap.TreeExplainer(model)
    

    I get the following error:

    ---------------------------------------------------------------------------
    IndexError                                Traceback (most recent call last)
    <ipython-input-2-6d52aef09dc8> in <module>
          8 model = CatBoostClassifier(iterations=100, learning_rate=0.5, random_seed=12)
          9 model.fit(X_train, y_train, eval_set=(X_val, y_val), verbose=False, plot=False)
    ---> 10 shap.TreeExplainer(model)
    
    ~/prb/anaconda3/lib/python3.6/site-packages/shap/explainers/tree.py in __init__(self, model, data, model_output, feature_dependence)
         94         self.feature_dependence = feature_dependence
         95         self.expected_value = None
    ---> 96         self.model = TreeEnsemble(model, self.data, self.data_missing)
         97 
         98         assert feature_dependence in feature_dependence_codes, "Invalid feature_dependence option!"
    
    ~/prb/anaconda3/lib/python3.6/site-packages/shap/explainers/tree.py in __init__(self, model, data, data_missing)
        594             self.dtype = np.float32
        595             cb_loader = CatBoostTreeModelLoader(model)
    --> 596             self.trees = cb_loader.get_trees(data=data, data_missing=data_missing)
        597             self.tree_output = "log_odds"
        598             self.objective = "binary_crossentropy"
    
    ~/prb/anaconda3/lib/python3.6/site-packages/shap/explainers/tree.py in get_trees(self, data, data_missing)
       1120 
       1121             # load the per-tree params
    -> 1122             depth = len(self.loaded_cb_model['oblivious_trees'][tree_index]['splits'])
       1123 
       1124             # load the nodes
    
    IndexError: list index out of range
    

    This error was spotted with Catboost version 0.15.2, I upgraded to the latest version (0.16.4 as of today), but the error persists. I have Shap version: '0.29.3'

    opened by ibuda 22
  • initial distributed summary plot

    initial distributed summary plot

    As per #16, plus a few additions to support scatter, and a few tweaks. @slundberg - it's not finished yet, but can you give some initial feedback:

    • function call: I put all the arguments at the end so as to be backward compatible, but it's not as clean
    • do you have any idea about the sum of individual kdes not equalling the overall kde?
    • any comments on the visuals and changes, including code style etc.

    Examples below. Note that the 2nd and 7th from bottom have only two unique values (i.e. one-hot encoding). These two don't quite seem to match the scatterplot, which makes me somewhat suspicious.

    hidden_names = [str(i) for i in range(len(X_train.columns))]
    summary_plot(shap_values, hidden_names, max_display=20, features=X_train.as_matrix())
    summary_plot(shap_values, hidden_names, color="#cccccc", max_display=20, features=X_train.as_matrix())
    summary_plot(shap_values, hidden_names, max_display=10, violin=False, features=X_train.as_matrix(), alpha=0.01)
    summary_plot(shap_values, hidden_names, max_display=10, violin=False, features=X_train.as_matrix(), width=0., alpha=0.01)
    

    image image image image

    opened by kodonnell 22
  • Compute shap value with tweedie objective function in xgboost

    Compute shap value with tweedie objective function in xgboost

    Following: /issues/454

    Tested to see if I could get back the prediction with the shap values computed and it works.

    only works with feature_perturbation = "interventional"

    Would be nice to have it working with "tree_path_dependent".

    opened by jfrery 20
  • SHAP Values for ensemble of XGBoost models

    SHAP Values for ensemble of XGBoost models

    First, thank for all your work for this very excellent package! It's very easy to use and produces insightful plots that have been proving useful in my day-to-day work.

    I'm currently working on a model that is an ensemble of 10 XGBoost models. What's the best way to obtain SHAP values for this ensemble? Is it even sensible to get 10 sets of SHAP values and then average them? Or is there a better way?

    opened by sergeyf 19
  • #38 add support for pyspark trees in shap explainer

    #38 add support for pyspark trees in shap explainer

    This pull request add support for pyspark Decision Trees (Random Forest and GBT) in the explainer. It doesn't use spark to explain the model, big dataset still need to be reduced and converted as panda DF in order to run the explainer.

    Limitations:

    • Categorical split aren't supported, I haven't seen this feature being supported in SHAP, if it is I'd be happy to add it but I don't see a simple way to add it
    • Variance impurity isn't supported
    • the .predict() function doesn't support prediction with spark
    opened by QuentinAmbard 18
  • ABOUT SHAP

    ABOUT SHAP

    Does SHAP retrain the model for each subset of features? How are the output parts of the model needed for calculating the Shapley value obtained for the subsets?

    image

    Also, is there a documentation I can use for RandomForestClassifier? I am getting many errors in rendering Shap charts.

    opened by salihai 0
  • support for sparkxgb xgboost models

    support for sparkxgb xgboost models

    Hello all, as some context- SHAP calculations have had a great contribution towards ML modele explanability. Yet, not all models seem to be supported, till date. One of those being: spark-xgboost's XGBoostClassificationModel, which is basically a python wrapper over Scala API of xgboost4j-spark, available as following JARs:

    • https://mvnrepository.com/artifact/ml.dmlc/xgboost4j
    • https://mvnrepository.com/artifact/ml.dmlc/xgboost4j-spark while the python wrapper's installation works by:
    git clone [email protected]:sllynn/spark-xgboost.git
    cd spark-xgboost
    python3 setup.py install
    

    there's a NB available for you to learn how the model is trained/formed: https://github.com/sllynn/spark-xgboost/blob/master/examples/spark-xgboost_adultdataset.ipynb

    albeit it is simply running the following to spark-submit:

    ./bin/spark-submit --master local[*] --jars /home/sumit/Downloads/xgboost4j-spark_2.12-1.4.1.jar,/home/sumit/Downloads/xgboost4j_2.12-1.4.1.jar <your-snippet-for-above-NB>.py
    

    disclaimer: I know one has to be the change one wants to say, ie "contribute", but the acumen and bandwidth for the same shall be unlikely

    opened by bohemia420 0
  • Pytorch DeepExplainer register_full_backward_hook fix

    Pytorch DeepExplainer register_full_backward_hook fix

    I got the following warning for computing the shap_values with a pytorch model:

    Using a non-full backward hook when the forward contains multiple autograd Nodes is deprecated and will be removed in future versions. This hook will be missing some grad_input. Please use register_full_backward_hook to get the documented behavior.
    

    Changing register_backward_hook to the register_full_backward_hook method fixed this warning and should now receive all grad_input.

    opened by helgehr 0
  • TypeError: list indices must be integers or slices, not tuple when creating scatter plot of binary classification model

    TypeError: list indices must be integers or slices, not tuple when creating scatter plot of binary classification model

    I have a binary classification problem for which I have developed a LightGBM classifier. I would like to plot global SHAP contributions for the X most important features, as in the scatter plot documentation the code shap.plots.scatter(shap_values[:, shap_values.abs.mean(0).argsort[-1]]) produces image

    My attempt is as follows:

    clf_final = lightgbm.LGBMClassifier(**RSCV.best_estimator_.get_params())
    clf_final.fit(X_train, y_train)
    
    # compute SHAP values
    explainer_LGB = shap.TreeExplainer(clf_final)
    shap_values_LGB = explainer_LGB.shap_values(X_train)
    shap.plots.scatter(shap_values_LGB[0:,"pet_mean_lag_t-6"])
    

    But it produces the error message: TypeError: list indices must be integers or slices, not tuple

    How could I get the desired plot for some of my features?

    opened by michiel98fjhsad 0
  • Import shap causes UnknownError raised (Fail to find the dnn implementation)

    Import shap causes UnknownError raised (Fail to find the dnn implementation)

    Error

    Simple lstm model constructed by tensorflow 2.10. Everything was fine without shap imported. BUT, if "import shap" was added, it throw an exception.

    {{function_node _wrapped__CudnnRNNV3_device/job:localhost/replica:0/task:0/device:GPU:0}} Fail to find the dnn implementation. [[{{node CudnnRNNV3}}]] [Op:CudnnRNNV3]

    Code

    import argparse
    import numpy as np
    import shap
    import tensorflow as tf
    from tensorflow import keras
    from data import load_data
    
    parser = argparse.ArgumentParser(description='Deep Knowledge tracing model')
    parser.add_argument('-epsilon', type=float, default=0.1, help='Epsilon value for Adam Optimizer')
    parser.add_argument('-l2_lambda', type=float, default=0.3, help='Lambda for l2 loss')
    parser.add_argument('-learning_rate', type=float, default=0.1, help='Learning rate')
    parser.add_argument('-max_grad_norm', type=float, default=20, help='Clip gradients to this norm')
    parser.add_argument('-keep_prob', type=float, default=0.6, help='Keep probability for dropout')
    parser.add_argument('-hidden_layer_num', type=int, default=1, help='The number of hidden layers')
    parser.add_argument('-hidden_size', type=int, default=200, help='The number of hidden nodes')
    parser.add_argument('-evaluation_interval', type=int, default=1, help='Evalutaion and print result every x epochs')
    parser.add_argument('-batch_size', type=int, default=32, help='Batch size for training')
    parser.add_argument('-epochs', type=int, default=150, help='Number of epochs to train')
    parser.add_argument('-allow_soft_placement', type=bool, default=True, help='Allow device soft device placement')
    parser.add_argument('-log_device_placement', type=bool, default=False, help='Log placement ofops on devices')
    parser.add_argument('-train_data_path', type=str, default='data/0910_b_train.csv', help='Path to the training dataset')
    parser.add_argument('-test_data_path', type=str, default='data/0910_b_test.csv',help='Path to the testing dataset')
    
    args = parser.parse_args()
    print(args)
    
    
    train_data_path = args.train_data_path
    test_data_path = args.test_data_path
    batch_size = args.batch_size
    train_students, train_max_num_problems, train_max_skill_num = load_data(train_data_path)
    num_steps = train_max_num_problems
    num_skills = train_max_skill_num
    num_layers = 1
    test_students, test_max_num_problems, test_max_skill_num = load_data(test_data_path)
    seq_len = 50
    
    
    class DKT(keras.Model):
    	def __init__(self, num_skills, seq_len, hidden_size, dropout_rate):
    		super(DKT, self).__init__()
    		self.num_skills = num_skills
    		self.seq_len = seq_len
    		self.hidden_size = hidden_size
    		self.dropout_rate = dropout_rate
    		self.embedding = keras.layers.Embedding(num_skills+1, hidden_size, input_length=seq_len, mask_zero=True)
    		self.lstm = keras.layers.LSTM(self.hidden_size, return_sequences=True, return_state=True)
    		self.dropout = keras.layers.Dropout(self.dropout_rate)
    		self.dense = keras.layers.Dense(1, activation='sigmoid')
    
    	def call(self, inputs, training=True):
    		x = self.embedding(inputs)
    		x = self.dropout(x, training=training)
    		x, _, _ = self.lstm(x)
    		x = self.dropout(x, training=training)
    		x = self.dense(x)
    		return x
    
    # Eager execution is an imperative programming environment that evaluates operations immediately, without building graphs
    tf.config.run_functions_eagerly(True)
    
    model = DKT(num_skills, seq_len, 128, 0.1)
    model.compile(optimizer='adam', loss='binary_crossentropy', metrics=['accuracy', 'AUC'])
    
    problems = []
    corrects = []
    for i in range(len(train_students)):
    	problems.append(train_students[i][1])
    	corrects.append(train_students[i][2])
    
    
    train_students_problems = np.reshape(tf.keras.preprocessing.sequence.pad_sequences(problems, padding="post", maxlen=seq_len), [-1, seq_len])
    train_students_corrects = np.reshape(tf.keras.preprocessing.sequence.pad_sequences(corrects, padding="post", maxlen=seq_len, value=2), [-1,seq_len,1])
    
    problems = []
    corrects = []
    for i in range(len(test_students)):
    	problems.append(test_students[i][1])
    	corrects.append(test_students[i][2])
    
    test_students_problems = np.reshape(tf.keras.preprocessing.sequence.pad_sequences(problems, padding="post", maxlen=seq_len), [-1,seq_len])
    test_students_corrects = np.reshape(tf.keras.preprocessing.sequence.pad_sequences(corrects, padding="post", maxlen=seq_len, value=2), [-1,seq_len,1])
    
    
    model.fit(train_students_problems, train_students_corrects, epochs=1, batch_size=batch_size, validation_data=(test_students_problems, test_students_corrects))
    model.evaluate(test_students_problems, test_students_corrects, batch_size=batch_size)
    
    
    ## SHAP
    shap.initjs()
    shap_values = explainer.shap_values(do_test, check_additivity=False)
    w = shap.force_plot(explainer.expected_value[13], shap_values[13][1], [str(it) for it in do_test[1]])
    shap.save_html(f"shap_pd_single%d.html" % 0, w, False)
    

    Detail

    Connected to pydev debugger (build 213.6461.77)
    Namespace(allow_soft_placement=True, batch_size=32, epochs=150, epsilon=0.1, evaluation_interval=1, hidden_layer_num=1, hidden_size=200, keep_prob=0.6, l2_lambda=0.3, learning_rate=0.1, log_device_placement=False, max_grad_norm=20, test_data_path='data/0910_b_test.csv', train_data_path='data/0910_b_train.csv')
    the number of rows is 10116
    The number of students is  3134
    Finish reading data
    the number of rows is 2532
    The number of students is  786
    Finish reading data
    2022-12-20 10:06:13.160514: I tensorflow/core/platform/cpu_feature_guard.cc:193] This TensorFlow binary is optimized with oneAPI Deep Neural Network Library (oneDNN) to use the following CPU instructions in performance-critical operations:  AVX AVX2
    To enable them in other operations, rebuild TensorFlow with the appropriate compiler flags.
    2022-12-20 10:06:13.748946: I tensorflow/core/common_runtime/gpu/gpu_device.cc:1616] Created device /job:localhost/replica:0/task:0/device:GPU:0 with 1930 MB memory:  -> device: 0, name: NVIDIA GeForce GTX 970M, pci bus id: 0000:01:00.0, compute capability: 5.2
    Even though the `tf.config.experimental_run_functions_eagerly` option is set, this option does not apply to tf.data functions. To force eager execution of tf.data functions, please use `tf.data.experimental.enable_debug_mode()`.
    2022-12-20 10:06:14.658000: E tensorflow/stream_executor/cuda/cuda_dnn.cc:377] Loaded runtime CuDNN library: 8.0.5 but source was compiled with: 8.1.0.  CuDNN library needs to have matching major version and equal or higher minor version. If using a binary install, upgrade your CuDNN library.  If building from sources, make sure the library loaded at runtime is compatible with the version specified during compile configuration.
    2022-12-20 10:06:14.660336: W tensorflow/core/framework/op_kernel.cc:1780] OP_REQUIRES failed at cudnn_rnn_ops.cc:1557 : UNKNOWN: Fail to find the dnn implementation.
    Traceback (most recent call last):
      File "f:\anaconda3\lib\site-packages\keras\utils\traceback_utils.py", line 70, in error_handler
        raise e.with_traceback(filtered_tb) from None
      File "F:/Work/xxx/LearningModel/DKT-explian/dkt.py", line 57, in call
        x, _, _ = self.lstm(x)
    tensorflow.python.framework.errors_impl.UnknownError: Exception encountered when calling layer "lstm" "                 f"(type LSTM).
    
    {{function_node __wrapped__CudnnRNNV3_device_/job:localhost/replica:0/task:0/device:GPU:0}} Fail to find the dnn implementation.
    	 [[{{node CudnnRNNV3}}]] [Op:CudnnRNNV3]
    
    Call arguments received by layer "lstm" "                 f"(type LSTM):
      • inputs=tf.Tensor(shape=(32, 50, 128), dtype=float32)
      • mask=tf.Tensor(shape=(32, 50), dtype=bool)
      • training=True
      • initial_state=None
    python-BaseException
    
    Process finished with exit code -1073741510 (0xC000013A: interrupted by Ctrl+C)
    

    Env

    Tensorflow-2.10.1 shap-0.41.0 numpy-1.20.3

    opened by mxdlzg 0
  • AttributeError: 'tuple' object has no attribute 'device' for tuple output

    AttributeError: 'tuple' object has no attribute 'device' for tuple output

    I've been running a Deep Survival machines (Pytorch model) and have the model object after training. I use e = shap.DeepExplainer(best_model_obj, torch.tensor(x_train[:100,:], dtype=torch.double, device=torch.device('cpu')) ) and get the error: AttributeError: 'tuple' object has no attribute 'device'

    My x_train is of type numpy array. When I run: best_model_obj.device I get: device(type='cpu')

    I looked in the deep_pytorch.py script and seems like, the device attribute is read from the outputs:

     with torch.no_grad():
                outputs = model(*data)
    
                # also get the device everything is running on
                self.device = outputs.device
    

    This obviously is not working as my outputs is a tuple (of multiple tensors) and no device attribute. Can you adjust this to read .device from outputs[0] or each element?

    I don't know how to resolve this issue. can anyone guide me on how?

    opened by mahyahemmat 0
Releases(v0.41.0)
  • v0.41.0(Jun 16, 2022)

    Lots of bugs fixes and API improvements.

    • Fixed rare bug with XGBoost model loading by @TheZL @lrjball
    • Fixed the beeswarm plot so it does not modify the passed explanation object, @ravwojdyla
    • Automatic wheel building using GH actions by @quantumtec
    • GC collection for memory in KernelExplainer by @Qingtian-Zou
    • Fixed max_evals params for PartitionExplainer
    • JIT optimize the PartitionExplainer
    • Fix colorbar formatting issues @SleepyPepperHead
    • New benchmark notebooks
    • Use display_data for plotting when possible @yuuuxt
    • Improved GPUTreeShap compilation and params @RAMitchell
    • Fix TF API change in DeepExplainer @filusn
    • Add torch tensor support for plots @alexander-pv
    • Switch to Github actions for testing instead of Travis
    • New California demo dataset @swalsh1123
    • Fix waterfall plot bug @RichardScottOZ
    • Handle missing matplotlib installation @klieret
    • Add linearize link support for Additive explainer (Nandish Gupta)
    • Fix exceptions to be more specific @alexisdrakopoulos @collinb9
    • Add color map option for plotting @tlabarta
    • Release fixed numpy version requirement @rmehyde
    • And many other contributions kindly made by @WeichenXu123 @imatiach-msft @zeshengli @nkthiebaut @songololo @GiovannaNicora @joshzwiebel @Ashishbodla @navdeep-G @smathewmanuel @ycouble @anubhavmaity @adityasaini70 @ngupta20 @jckkvs @abs428 @JulesCollenne @Tiagosf00 @javirandor and @Thuener
    Source code(tar.gz)
    Source code(zip)
  • v0.40.0(Oct 20, 2021)

    This release contains many bugs fixes and lots of new functionality, specifically for transformer based NLP models. Some highlights include:

    • New plots, bug fixes, docs, and features for NLP model explanations (see docs for details).
    • important permutation explainer performance fix by @sander-sn
    • New joint scatter plots to plot many at once on the same y-scale
    • better tree model memory usage by @morriskurz
    • new docs by @coryroyce
    • new wheel building by @PrimozGodec
    • dark mode improvements for the docs by @gialmisi
    • api tweaks by @c56pony @nsorros @jebarb
    Source code(tar.gz)
    Source code(zip)
  • v0.39.0(Mar 3, 2021)

    Lots of new text explainer work courtesy of @ryserrao and serialization courtesy of @vivekchettiar! (will note all the other changes later)

    Source code(tar.gz)
    Source code(zip)
  • v0.38.1(Jan 15, 2021)

  • v0.38.0(Jan 14, 2021)

    This release contains improved support for explanations of transformer text models and support for the new Explanation object based API. Specific improvements include:

    • Transformer model support in the Text explainer courtesy of @ryserrao
    • Interventional Tree explainer GPU support courtesy of @RAMitchell
    • Image captioning model support courtesy of @anusham1990
    • Benchmarking improvements courtesy of @maggiewu19
    • New text and image visualizations courtesy of @vivekchettiar
    • New explainer serialization support courtesy of @vivekchettiar
    • Bug fixes for Linear explainer and the new API courtesy of @heimengqi
    • Fix for categorical plots courtesy of @jeffreyftang
    • CUDA support improvements courtesy of @JohnZed
    • Support for econML model courtesy of @vasilismsr
    • Many other bug fixes and API improvements.
    Source code(tar.gz)
    Source code(zip)
  • v0.37.0(Nov 4, 2020)

    This release contains more support for the new API, many bug fixes, and preliminary model agnostic text/image explainer support (still beta). Specific contributions include:

    • Fix Sampling explainer sample counting issue courtesy of @tcbegley
    • Add multi-bar plotting support.
    • Preliminary support for cohorts.
    • Fixed an import error courtesy of @suragnair
    • Fix Tree explainer issues with isolation forests with max_features < 1 courtesy of @zhanjiezhu
    • Huge documentation cleanup and update courtesy of @lrjball
    • Typo fix courtesy of @anusham1990
    • Added a documentation notebook for the Exact explainer.
    • Text and Image explainers courtesy of @anusham1990 and Ryan Serrao
    • Bug fix for shap.utils.hclust
    • Initial support for InterpretML EBM models.
    • Added column grouping functionality to Explainer objects.
    • Fix for loop index bug in Deep explainer for PyTorch courtesy of @quentinRaq
    • Initial text to text visualization concepts courtesy of @vivekchettiar
    • Color conversion warning fix courtesy of @wangjoshuah
    • Fix invertibility issues in Kernel explainer with the pseudoinverse courtesy of @PrimozGodec
    • New benchmark code courtesy of @maggiewu19 and @vivekchettiar
    • Other small bug fixes and enhancements.
    Source code(tar.gz)
    Source code(zip)
  • v0.36.0(Aug 27, 2020)

    This version contains a significant refactoring of the SHAP code base into a new (cleaner) API. Full backwards compatibility should be retained, but most things are now available in locations with the new API. Note that this API is still in a beta form, so refrain from depending on it for production code until the next release. Highlights include:

    • A new shap.Explainer object that auto-chooses the explainer based on the given model and masking dataset.
    • A new shap.Explanation object that allows for parallel slicing of data, SHAP values, base values (expected values), and other explanation-specific elements.
    • A new shap.maskers.* module that separates the various ways to mask (i.e. perturb/hide) features from the algorithms themselves.
    • A new shap.explainers.Partition explainer that can explain any text or image models very quickly.
    • A new shap.maskers.Partition masker that ensures tightly grouped features are perturbed in unison, so preventing "unrealistic" model inputs from inappropriately influencing the model prediction. It also allows for the exact quadratic time computation of SHAP values for the 'structured games' (with coalitions structured according to a hierarchical clustering).
    • A new shap.plots.* module with revamped plot types that all support the new API. Plots are now named more directly, so summary_plot (default) becomes beeswarm, and dependent_plot becomes scatter. Not all the plots have been ported over to the new API, but most have.
    • A new notebooks/plots/* directory given examples of how to use the new plotting functions.
    • A new shap.plots.bar function to directly create bar plots and also display hierarchical clustering structures to group redundant features together, and show the structure used by a Partition explainer (that relied on Owen values, which are an extension of Shapley values).
    • Equally check fixes courtesy of @jameslamb
    • Sparse kmeans support courtesy of @PrimozGodec
    • Pytorch bug fixes courtesy of @rightx2
    • NPM JS code clean up courtesy of @SachinVarghese
    • Fix logit force plot bug courtesy of @ehuijzer
    • Decision plot documentation updates courtesy of @floidgilbert
    • sklearn GBM fix courtesy of @ChemEngDataSci
    • XGBoost 1.1 fix courtesy of @lrjball
    • Make SHAP spark serializable courtesy of @QuentinAmbard
    • Custom summary plot color maps courtesy of @nasir-bhanpuri
    • Support string inputs for KernelSHAP courtesy of @YotamElor
    • Doc fixes courtesy of @imatiach-msft
    • Support for GPBoost courtesy of @fabsig
    • Import bug fix courtesy of @gracecarrillo and @aokeson
    Source code(tar.gz)
    Source code(zip)
  • 0.35.0(Feb 27, 2020)

    This release includes:

    • Better support for TensorFlow 2 (thanks @imatiach-msft)
    • Support for NGBoost models in TreeExplainer (thanks @zhiruiwang)
    • TreeExplainer support for the new sklearn.ensemble.HistGradientBoosting model.
    • New improved versions of PartitionExplainer for images and text.
    • IBM zOS compatibility courtesy of @DorianCzichotzki.
    • Support for XGBoost 1.0
    • Many bug fixes courtesy of Ivan, Christian Paul, @RandallJEllis, and @ibuda.
    Source code(tar.gz)
    Source code(zip)
  • 0.34.0(Dec 27, 2019)

    This release includes:

    • Many small bug fixes.
    • Better matplotlib text alignment during rotation courtesy of @koomie
    • Cleaned up the C++ transformer code to allow easier PRs.
    • Fixed a too tight check_additivity tolerance in TreeExplainer #950
    • Updated the LinearExplainer API to match TreeExplainer
    • Allow custom class ordering in a summary_plot courtesy of @SimonStreicher
    Source code(tar.gz)
    Source code(zip)
  • 0.33.0(Dec 11, 2019)

    This release contains various bug fixes and new features including:

    • Added PySpark support for TreeExplainer courtesy of @QuentinAmbard
    • A new type of plot that is an alternative to the force_plot, a waterfall_plot
    • A new PermutationExplainer that is an alternative to KernelExplainer and SamplingExplainer.
    • Added return_variances to GradientExplainer for PyTorch courtesy of @s6juncheng
    • Now we use exceptions rather than assertions in TreeExplainer courtesy of @ssaamm
    • Fixed image_plot transpose issue courtesy of @Jimbotsai
    • Fix color bar axis attachment issue courtesy of Lasse Valentini Jensen
    • Fix tensor attachment issue in PyTorch courtesy of @gabrieltseng
    • Fix color clipping ranges in summary_pot courtesy of @joelostblom
    • Address sklearn 0.22 API changes courtesy of @lemon-yellow
    • Ensure matplotlib is optional courtesy of @imatiach-msft
    Source code(tar.gz)
    Source code(zip)
  • 0.32.1(Nov 6, 2019)

  • 0.32.0(Nov 6, 2019)

    This release includes:

    • Support for sklearn isolation forest courtesy of @JiechengZhao
    • New check_additivity tests to ensure no errors in DeepExplainer and TreeExplainer
    • Fix #861, #860
    • Fix missing readme example html file
    • Support for spark decision tree regressor courtesy of @QuentinAmbard
    • Better safe isinstance checking courtesy of @parsatorb
    • Fix eager execution in TF < 2 courtesy of @bottydim
    Source code(tar.gz)
    Source code(zip)
  • 0.31.0(Oct 21, 2019)

    This release contains several new features and bug fixes:

    • GradientExplainer now supports TensorFlow 2.0.
    • We now do a lazy load of the plotting dependencies, which means a pip install no longer needs to also pull in matplotlib, skimage, and ipython. This should make installs much lighter, especially those that don't need plotting :)
    • Added a new BruteForceExplainer for easy testing and comparison on small problems.
    • Added a new partial_dependence_plot function. This function will be used to illustrate the close connections between partial dependence plots and SHAP values in future example notebooks.
    • Handle the multiclass case with no intercept in LinearExplainer courtesy of @gabrieltseng
    • Some extras_require options during the pip install courtesy of @AbdealiJK
    • Other small bug fixes and updates
    Source code(tar.gz)
    Source code(zip)
  • 0.30.2(Oct 9, 2019)

    This release is primarily to remove a dependency on dill that was not in setup.py. It also includes:

    • A typo fix in force.py courtesy of @jonlwowski012
    • Test code cleanup courtesy of @jorgecarleitao
    Source code(tar.gz)
    Source code(zip)
  • 0.30.1(Sep 9, 2019)

    • Fix floating point rounding mismatches in recent sklearn versions of tree models
    • An update to allow easier loading of custom tree ensemble models by TreeExplainer.
    • decision_plot documentation updates courtesy of @floidgilbert
    Source code(tar.gz)
    Source code(zip)
  • 0.30.0(Aug 31, 2019)

    • New decision_plot function courtesy of @floidgilbert
    • Add alpha version of the new model agnostic PartitionExplainer
    • ensure data is all on the same device for pytorch in DeepExplainer courtesy of @gabrieltseng
    • fix lightgbm edge case issue courtesy of @imatiach-msft
    • create binder setup for shap courtesy of @jamesmyatt
    • Allow for multiple inputs in the gradient explainer courtesy of @gabrieltseng
    • New KernelExplainer unit tests courtesy of @jorgecarleitao
    • Add python 2/3 trove classifiers courtesy of @proinsias
    • support for pyspark trees courtesy of @QuentinAmbard
    • many other bug fixes courtesy of @Rygu, @Kylecrif, @trams, @imatiach-msft, @yunchuankong, @invokermain, @lupusomniator, @satyarta, @jotsif, @parkerzf, @jaller94, @gabrieltseng, and others
    Source code(tar.gz)
    Source code(zip)
  • 0.29.3(Jun 19, 2019)

  • 0.29.2(Jun 19, 2019)

    Various bug fixes and improvements including:

    • adding SHAP values for binary classification to CatBoost courtesy of @dvpolyakov
    • Integer division fix for plots courtesy of @pmeier-tiplu
    • Support passing in an Axes object to dependence_plot courtesy of @mqk
    • Add adaptive average pooling and conv transpose layers courtesy of of @gabrieltseng
    • fix import errors on a missing matplotlib backend courtesy of @hchandola
    • fix TreeExplainer GradientBoostingClassifier bug courtesy of @prempiyush
    • make tqdm play nicer with notebooks courtesy of @KOLANICH
    • Allow deep_pytorch to use cuda models courtesy of @juliusbierk
    • Fix sklearn GradientBoostingRegressor bug courtesy of @nasir-bhanpuri
    • adding sparse support to shap linear explainer courtesy of @imatiach-msft
    Source code(tar.gz)
    Source code(zip)
  • 0.29.1(May 15, 2019)

  • 0.29.0(May 14, 2019)

    A few contribution highlights of this release (in chronological order)

    • Better testing courtesy of @jorgecarleitao
    • Image plot customizations courtesy of @verdimrc
    • Batch norm support for PyTorch in DeepExplainer courtesy of @JiechengZhao
    • Leaky ReLU and other conv layer support for pytorch deep explainer courtesy of @gabrieltseng
    • Fixed keras multi input in gradient explainer and improved random seeds courtesy of @moritzaugustin
    • Support for catBoost ranker courtesy of @doramir
    • Added XGBRanker and LGBMRanker to TreeExplainer courtesy of @imatiach-msft
    • Fix embedding lookup with tf.keras in DeepExplainer courtesy of @andriy-nikolov
    • Custom dependence_plot colors maps courtesy of @rcarneva
    • Fix divide by zero issues possible with CatBoost models courtesy of @dvpolyakov
    • Lots of other bug fixes/improvements!
    Source code(tar.gz)
    Source code(zip)
  • 0.28.5(Feb 16, 2019)

  • 0.28.4(Feb 16, 2019)

    • Fixes memory corruption error from TreeExplainer (courtesy of @imatiach-msft)
    • Adds support for skopt Random Forest and ExtraTrees Regressors (courtesy of @Bacoknight)
    • Adds support for matplotlib forceplot with text rotation (courtesy of @vatsan)
    • Adds a save_html function
    Source code(tar.gz)
    Source code(zip)
  • 0.28.3(Jan 24, 2019)

  • 0.28.2(Jan 23, 2019)

  • 0.28.1(Jan 23, 2019)

    • Fixes a byte-alignment issue on Windows when loading XGBoost models.
    • Now matches tree_limit use in XGBoost models courtesy of @HughChen
    • Fix an issue with the expected_value of transformed model outputs in TreeExplainer
    Source code(tar.gz)
    Source code(zip)
  • 0.28.0(Jan 21, 2019)

    • Add support for rank-based feature selection in KernelExplainer.
    • Depreciate l1_reg="auto" in KernelExplainer in favor of eventually defaulting to l1_reg="num_features(10)"
    • New color scales based on the Lch color space.
    • Better auto-color choices for multi-class summary plots.
    • Better plotting of NaN values in dependence_plots
    • Updates for Pytorch 1.0 courtesy of @gabrieltseng
    • Fix the sklearn DecisionTreeClassifier handling to correctly normalize to a probability output
    • Enable multi-output model support for TreeExplainer when feature_dependence="independent"
    • Correctly load the objective of LightGBM models for use in explaining the model loss.
    • Fix numerical precision mismatch with sklearn models.
    • Fix numerical precision mismatch with XGBoost models by now directly loading from memory instead of JSON.
    Source code(tar.gz)
    Source code(zip)
  • 0.27.0(Jan 1, 2019)

    • Better hierarchal clustering orderings that now rotate subtrees to give more continuity.
    • Work around XGBoost JSON issue.
    • Account for NaNs when doing auto interaction detection.
    • PyTorch fixes.
    • Updated LinearExplainer.
    Source code(tar.gz)
    Source code(zip)
  • 0.26.0(Dec 12, 2018)

    • Complete refactor of TreeExplainer to support deeper C++ integration
    • The ability to explain transformed outputs of tree models in TreeExplainer, including the loss. In collaboration with @HughChen
    • Allow for a dynamic reference value in DeepExplainer courtesy of @AvantiShri
    • Add x_jitter option for categorical dependence plots courtesy of @ihopethiswillfi
    • Added support for GradientBoostingRegressor with quantile loss courtesy of @dmilad
    • Better plotting support for NaN values
    • Fixes several bugs.
    Source code(tar.gz)
    Source code(zip)
  • 0.25.2(Nov 9, 2018)

    • Allows ordering_keys to be given to force_plot courtesy of @JasonTam
    • Fixes sparse nonzero background issue with KernelExplainer courtesy of @imatiach-msft
    • Fix to support tf.concat in DeepExplainer.
    Source code(tar.gz)
    Source code(zip)
  • 0.25.1(Nov 8, 2018)

Owner
Scott Lundberg
Scott Lundberg
TorchDrug is a PyTorch-based machine learning toolbox designed for drug discovery

A powerful and flexible machine learning platform for drug discovery

MilaGraph 1.1k Jan 08, 2023
The easy way to combine mlflow, hydra and optuna into one machine learning pipeline.

mlflow_hydra_optuna_the_easy_way The easy way to combine mlflow, hydra and optuna into one machine learning pipeline. Objective TODO Usage 1. build do

shibuiwilliam 9 Sep 09, 2022
About Solve CTF offline disconnection problem - based on python3's small crawler

About Solve CTF offline disconnection problem - based on python3's small crawler, support keyword search and local map bed establishment, currently support Jianshu, xianzhi,anquanke,freebuf,seebug

天河 32 Oct 25, 2022
Predict the income for each percentile of the population (Python) - FRENCH

05.income-prediction Predict the income for each percentile of the population (Python) - FRENCH Effectuez une prédiction de revenus Prérequis Pour ce

1 Feb 13, 2022
Bayesian Modeling and Computation in Python

Bayesian Modeling and Computation in Python Open access and Code This repository contains the open access version of the text and the code examples in

Bayesian Modeling and Computation in Python 339 Jan 02, 2023
A Python Module That Uses ANN To Predict A Stocks Price And Also Provides Accurate Technical Analysis With Many High Potential Implementations!

Stox A Module to predict the "close price" for the next day and give "technical analysis". It uses a Neural Network and the LSTM algorithm to predict

Stox 31 Dec 16, 2022
Python package for concise, transparent, and accurate predictive modeling

Python package for concise, transparent, and accurate predictive modeling. All sklearn-compatible and easy to use. 📚 docs • 📖 demo notebooks Modern

Chandan Singh 983 Jan 01, 2023
Repository for DCA0305, an undergraduate course about Machine Learning Workflows and Pipelines

Federal University of Rio Grande do Norte Technology Center Department of Computer Engineering and Automation Machine Learning Based Systems Design Re

Ivanovitch Silva 81 Oct 18, 2022
Falken provides developers with a service that allows them to train AI that can play their games

Falken provides developers with a service that allows them to train AI that can play their games. Unlike traditional RL frameworks that learn through rewards or batches of offline training, Falken is

Google Research 223 Jan 03, 2023
CVXPY is a Python-embedded modeling language for convex optimization problems.

CVXPY The CVXPY documentation is at cvxpy.org. We are building a CVXPY community on Discord. Join the conversation! For issues and long-form discussio

4.3k Jan 08, 2023
Upgini : data search library for your machine learning pipelines

Automated data search library for your machine learning pipelines → find & deliver relevant external data & features to boost ML accuracy :chart_with_upwards_trend:

Upgini 175 Jan 08, 2023
Combines Bayesian analyses from many datasets.

PosteriorStacker Combines Bayesian analyses from many datasets. Introduction Method Tutorial Output plot and files Introduction Fitting a model to a d

Johannes Buchner 19 Feb 13, 2022
SPCL 48 Dec 12, 2022
Simple linear model implementations from scratch.

Hand Crafted Models Simple linear model implementations from scratch. Table of contents Overview Project Structure Getting started Citing this project

Jonathan Sadighian 2 Sep 13, 2021
Simulation of early COVID-19 using SIR model and variants (SEIR ...).

COVID-19-simulation Simulation of early COVID-19 using SIR model and variants (SEIR ...). Made by the Laboratory of Sustainable Life Assessment (GYRO)

José Paulo Pereira das Dores Savioli 1 Nov 17, 2021
Python module for data science and machine learning users.

dsnk-distributions package dsnk distribution is a Python module for data science and machine learning that was created with the goal of reducing calcu

Emmanuel ASIFIWE 1 Nov 23, 2021
This handbook accompanies the course: Machine Learning with Hung-Yi Lee

This handbook accompanies the course: Machine Learning with Hung-Yi Lee

RenChu Wang 472 Dec 31, 2022
Implementation of linesearch Optimization Algorithms in Python

Nonlinear Optimization Algorithms During my time as Scientific Assistant at the Karlsruhe Institute of Technology (Germany) I implemented various Opti

Paul 3 Dec 06, 2022
Apple-voice-recognition - Machine Learning

Apple-voice-recognition Machine Learning How does Siri work? Siri is based on large-scale Machine Learning systems that employ many aspects of data sc

Harshith VH 1 Oct 22, 2021
Mosec is a high-performance and flexible model serving framework for building ML model-enabled backend and microservices

Mosec is a high-performance and flexible model serving framework for building ML model-enabled backend and microservices. It bridges the gap between any machine learning models you just trained and t

164 Jan 04, 2023