International Space Station data with Python research 🌎

Related tags

Data AnalysisISS_data
Overview

espaciador

International Space Station data with Python research 🌎

Plotting ISS trajectory, calculating the velocity over the earth and more.


Plotting trajectory:

We are going to make a graph of the trajectory of the ISS that is N minutes long. The N will be chosen by the user according to their preferences. This means that the program will run and keep points in a list for N minutes.
We will use an API to retrieve ISS current position in latitude and longitude:

http://open-notify.org/Open-Notify-API/ISS-Location-Now/

First we need to import the following python modules:

Pandas to read json data from ISS API, plotly to make the plot of the trajectory and time to time.sleep function
import pandas as pd
import plotly.express as px
import time

Second we must initialize the list that will preserve the latitude and longitude points (every sixty seconds). You also have to initialize the N variable with time in minutes

latitudes = []
longitudes = []
N = 60 # Sixty for one hour trajectory

Then we will create the following for loop to keep recording latitude-longitude points separated by one minute

We use for i in range(N), which is the time that the script will keep running (in hours) because we have a time.sleep(60) at the end
for i in range(N):  
    url = "http://api.open-notify.org/iss-now.json" # API URL

    df = pd.read_json(url) # Pandas read JSON data from API
    
    latitudes.append(df["iss_position"]["latitude"])  # We append latitude ISS position to latitudes list
    longitudes.append(df["iss_position"]["longitude"]) # We append longitude ISS position to longitudes list
    
    time.sleep(60) # This is used to separate de point records with one minute

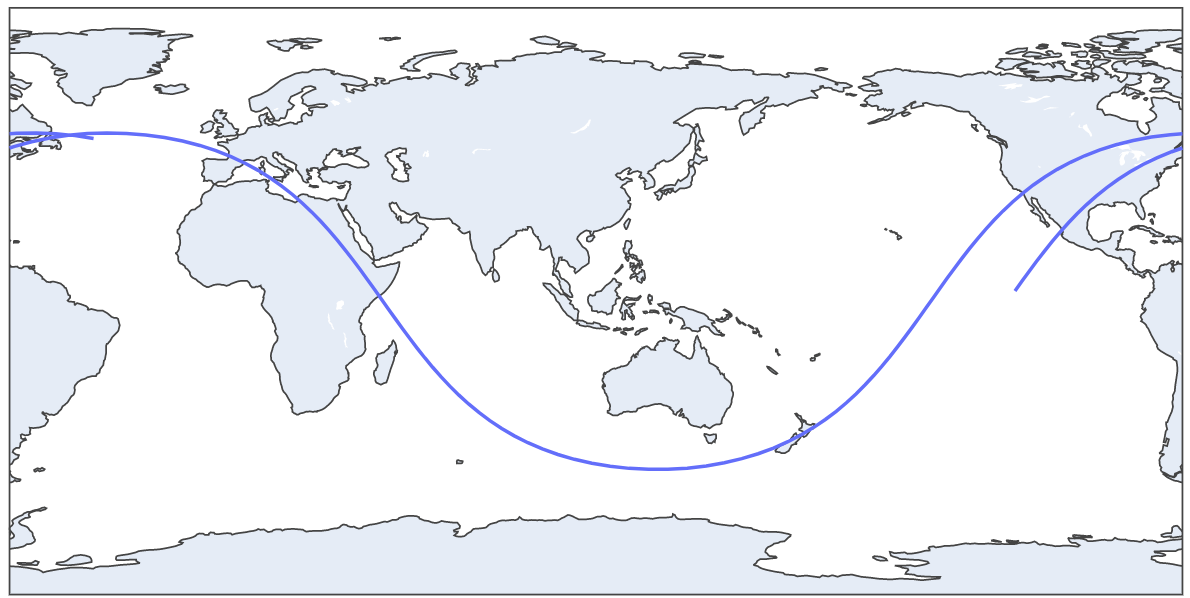
When the for loop finish the iterating we will have a record of N minutes ISS trajectory. Now we can plot this with Plotly (px.line_geo):

px.line_geo will create a plot with earth map
fig = px.line_geo(lat=latitudes, lon=longitudes) # Passing our latitudes and longitudes list as parameter
fig.show()  

image

This is a two hours trajectory plot

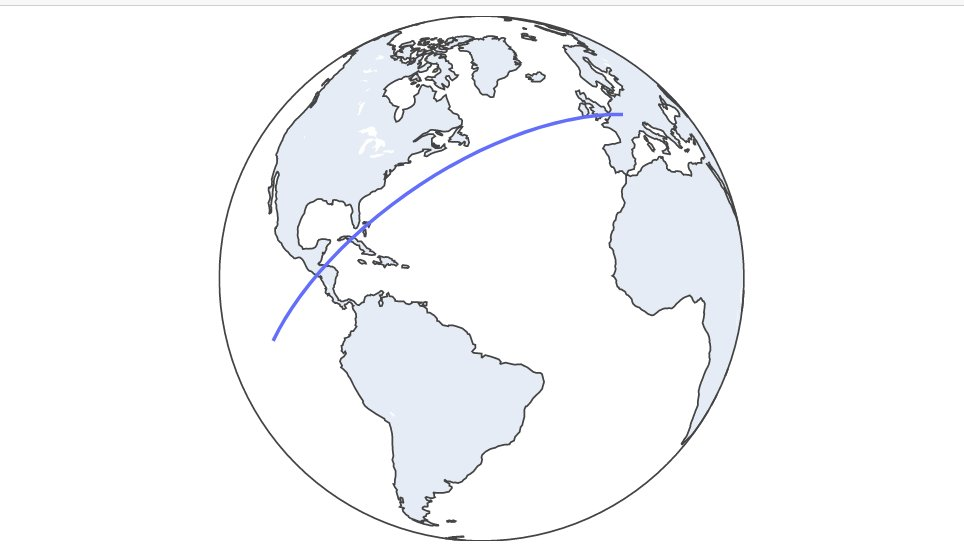
We can update our plot to orthographic projection with this code:

fig.update_geos(projection_type="orthographic")
fig.update_layout(height=300, margin={"r":0,"t":0,"l":0,"b":0})
fig.show()  

image

30 minutes trajectory plot

image

2 Hours trajectory plot GIF

Estimating ISS velocity:

We will estimate the ISS velocity using two diferent latitude-longitude points separated by one minute (sixty seconds). We can get the distance between that two points and then use phisics formula velocity(m/s) = distance(in meters)/time(in seconds)

First import the following python modules

import pandas as pd # Pandas to read API data
import time # Time for time.sleep
import geopy.distance # Geopy to get distance between two lat-lon points
import requests # Get another API data
import json # Read that data
We need to initialize two empty list to save latitudes and longitudes
lat = []
long = []
Next we will use a for loop to get the two latitude-longitude points separated by 60 seconds (time.sleep(60))
for i in range(2):  # for in range(2) because we want two lat-lon points

    url = "http://api.open-notify.org/iss-now.json" # API url

    df = pd.read_json(url) # Read API Json data with Pandas

    lat.append(df["iss_position"]["latitude"]) # Append latitude to lat list
    long.append(df["iss_position"]["longitude"]) # Append longitude to long list

    time.sleep(60) # Wait 60 seconds to record the second lat-lon point
When this for loop finish we will have a lat list with two latitude positions and one long list with two longitude positions. In conjuntion of this 4 numbers we have two lat-lon points in different time moments (separated by one minute)

Then we must get the distance between this points:

We create the two different points. The first one with lat[0] index and long[0]. The second one with lat[1] and long[0]
coords_1 = (lat[0], long[0]) 
coords_2 = (lat[1], long[1])
Then calculate distance with geopy library:
distance = (
geopy.distance.distance(coords_1, coords_2).m
) # Distance between the points in meters
But we must make a litle correction. Because ISS isn't moving in earth surface. It's orbiting aproximately 400Km above earth surface. So the radius is greater. The distance traveled is a litle bit more. To do this, we need to get ISS current altitud. Use the following code:

image

iss_alt_url = "https://api.wheretheiss.at/v1/satellites/25544"
r = requests.get(iss_alt_url)
r = r.text
r = json.loads(r)

iss_alt = int(r["altitude"]) # IN KM
Now apply phisics formula to make the correction
earth_radius = 6371 # in KM
distance_corrected = (distance * (earth_radius+iss_alt)/earth_radius)
Now finish the calculation with speed formula already explained:
speed = distancia_corrected/60 


print(round(speed*3.6, 3), "KM/H") # Multiplied by 3.6 to convert from m/s to km/h. Rounded by 3.

Output:

26367.118 KM/h
Owner
Facundo Pedaccio
Studying computer engineering and economics. I like computer science, physics, astrophysics, rocket science. Or rather the perfect combination of them.
Facundo Pedaccio
Autopsy Module to analyze Registry Hives based on bookmarks provided by EricZimmerman for his tool RegistryExplorer

Autopsy Module to analyze Registry Hives based on bookmarks provided by EricZimmerman for his tool RegistryExplorer

Mohammed Hassan 13 Mar 31, 2022
This project is the implementation template for HW 0 and HW 1 for both the programming and non-programming tracks

This project is the implementation template for HW 0 and HW 1 for both the programming and non-programming tracks

Donald F. Ferguson 4 Mar 06, 2022
Reading streams of Twitter data, save them to Kafka, then process with Kafka Stream API and Spark Streaming

Using Streaming Twitter Data with Kafka and Spark Reading streams of Twitter data, publishing them to Kafka topic, process message using Kafka Stream

Rustam Zokirov 1 Dec 06, 2021
Synthetic data need to preserve the statistical properties of real data in terms of their individual behavior and (inter-)dependences

Synthetic data need to preserve the statistical properties of real data in terms of their individual behavior and (inter-)dependences. Copula and functional Principle Component Analysis (fPCA) are st

32 Dec 20, 2022
Created covid data pipeline using PySpark and MySQL that collected data stream from API and do some processing and store it into MYSQL database.

Created covid data pipeline using PySpark and MySQL that collected data stream from API and do some processing and store it into MYSQL database.

2 Nov 20, 2021
Python package for analyzing behavioral data for Brain Observatory: Visual Behavior

Allen Institute Visual Behavior Analysis package This repository contains code for analyzing behavioral data from the Allen Brain Observatory: Visual

Allen Institute 16 Nov 04, 2022
BIGDATA SIMULATION ONE PIECE WORLD CENSUS

ONE PIECE is a Japanese manga of great international success. The story turns inhabited in a fictional world, tells the adventures of a young man whose body gained rubber properties after accidentall

Maycon Cypriano 3 Jun 30, 2022
AptaMat is a simple script which aims to measure differences between DNA or RNA secondary structures.

AptaMAT Purpose AptaMat is a simple script which aims to measure differences between DNA or RNA secondary structures. The method is based on the compa

GEC UTC 3 Nov 03, 2022
Karate Club: An API Oriented Open-source Python Framework for Unsupervised Learning on Graphs (CIKM 2020)

Karate Club is an unsupervised machine learning extension library for NetworkX. Please look at the Documentation, relevant Paper, Promo Video, and Ext

Benedek Rozemberczki 1.8k Jan 09, 2023
A Python adaption of Augur to prioritize cell types in perturbation analysis.

A Python adaption of Augur to prioritize cell types in perturbation analysis.

Theis Lab 2 Mar 29, 2022
yt is an open-source, permissively-licensed Python library for analyzing and visualizing volumetric data.

The yt Project yt is an open-source, permissively-licensed Python library for analyzing and visualizing volumetric data. yt supports structured, varia

The yt project 367 Dec 25, 2022
Jupyter notebooks for the book "The Elements of Statistical Learning".

This repository contains Jupyter notebooks implementing the algorithms found in the book and summary of the textbook.

Madiyar 369 Dec 30, 2022
A computer algebra system written in pure Python

SymPy See the AUTHORS file for the list of authors. And many more people helped on the SymPy mailing list, reported bugs, helped organize SymPy's part

SymPy 9.9k Dec 31, 2022
Code for the DH project "Dhimmis & Muslims – Analysing Multireligious Spaces in the Medieval Muslim World"

Damast This repository contains code developed for the digital humanities project "Dhimmis & Muslims – Analysing Multireligious Spaces in the Medieval

University of Stuttgart Visualization Research Center 2 Jul 01, 2022
πŸ’¬ Python scripts to parse Messenger, Hangouts, WhatsApp and Telegram chat logs into DataFrames.

Chatistics Python 3 scripts to convert chat logs from various messaging platforms into Pandas DataFrames. Can also generate histograms and word clouds

Florian 893 Jan 02, 2023
Feature Detection Based Template Matching

Feature Detection Based Template Matching The classification of the photos was made using the OpenCv template Matching method. Installation Use the pa

Muhammet Erem 2 Nov 18, 2021
An Integrated Experimental Platform for time series data anomaly detection.

Curve Sorry to tell contributors and users. We decided to archive the project temporarily due to the employee work plan of collaborators. There are no

Baidu 486 Dec 21, 2022
Making the DAEN information accessible.

The purpose of this repository is to make the information on Australian COVID-19 adverse events accessible. The Therapeutics Goods Administration (TGA) keeps a database of adverse reactions to medica

10 May 10, 2022
Projeto para realizar o RPA Challenge . Utilizando Python e as bibliotecas Selenium e Pandas.

RPA Challenge in Python Projeto para realizar o RPA Challenge (www.rpachallenge.com), utilizando Python. O objetivo deste desafio Γ© criar um fluxo de

Henrique A. LourenΓ§o 1 Apr 12, 2022
Create HTML profiling reports from pandas DataFrame objects

Pandas Profiling Documentation | Slack | Stack Overflow Generates profile reports from a pandas DataFrame. The pandas df.describe() function is great

10k Jan 01, 2023