DAT8 Course Repository
Course materials for General Assembly's Data Science course in Washington, DC (8/18/15 - 10/29/15).
Instructor: Kevin Markham (Data School blog, email newsletter, YouTube channel)
| Tuesday | Thursday |
|---|---|
| 8/18: Introduction to Data Science | 8/20: Command Line, Version Control |
| 8/25: Data Reading and Cleaning | 8/27: Exploratory Data Analysis |
| 9/1: Visualization | 9/3: Machine Learning |
| 9/8: Getting Data | 9/10: K-Nearest Neighbors |
| 9/15: Basic Model Evaluation | 9/17: Linear Regression |
| 9/22: First Project Presentation | 9/24: Logistic Regression |
| 9/29: Advanced Model Evaluation | 10/1: Naive Bayes and Text Data |
| 10/6: Natural Language Processing | 10/8: Kaggle Competition |
| 10/13: Decision Trees | 10/15: Ensembling |
| 10/20: Advanced scikit-learn, Clustering | 10/22: Regularization, Regex |
| 10/27: Course Review | 10/29: Final Project Presentation |
Python Resources
- Codecademy's Python course: Good beginner material, including tons of in-browser exercises.
- Dataquest: Uses interactive exercises to teach Python in the context of data science.
- Google's Python Class: Slightly more advanced, including hours of useful lecture videos and downloadable exercises (with solutions).
- Introduction to Python: A series of IPython notebooks that do a great job explaining core Python concepts and data structures.
- Python for Informatics: A very beginner-oriented book, with associated slides and videos.
- A Crash Course in Python for Scientists: Read through the Overview section for a very quick introduction to Python.
- Python 2.7 Quick Reference: My beginner-oriented guide that demonstrates Python concepts through short, well-commented examples.
- Beginner and intermediate workshop code: Useful for review and reference.
- Python Tutor: Allows you to visualize the execution of Python code.
Course project
Comparison of machine learning models
Comparison of model evaluation procedures and metrics
Advice for getting better at data science
Additional resources
Class 1: Introduction to Data Science
- Course overview (slides)
- Introduction to data science (slides)
- Discuss the course project: requirements and example projects
- Types of data (slides) and public data sources
- Welcome from General Assembly staff
Homework:
- Work through GA's friendly command line tutorial using Terminal (Linux/Mac) or Git Bash (Windows).
- Read through this command line reference, and complete the pre-class exercise at the bottom. (There's nothing you need to submit once you're done.)
- Watch videos 1 through 8 (21 minutes) of Introduction to Git and GitHub, or read sections 1.1 through 2.2 of Pro Git.
- If your laptop has any setup issues, please work with us to resolve them by Thursday. If your laptop has not yet been checked, you should come early on Thursday, or just walk through the setup checklist yourself (and let us know you have done so).
Resources:
- For a useful look at the different types of data scientists, read Analyzing the Analyzers (32 pages).
- For some thoughts on what it's like to be a data scientist, read these short posts from Win-Vector and Datascope Analytics.
- Quora has a data science topic FAQ with lots of interesting Q&A.
- Keep up with local data-related events through the Data Community DC event calendar or weekly newsletter.
Class 2: Command Line and Version Control
- Slack tour
- Review the command line pre-class exercise (code)
- Git and GitHub (slides)
- Intermediate command line
Homework:
- Complete the command line homework assignment with the Chipotle data.
- Review the code from the beginner and intermediate Python workshops. If you don't feel comfortable with any of the content (excluding the "requests" and "APIs" sections), you should spend some time this weekend practicing Python:
- Introduction to Python does a great job explaining Python essentials and includes tons of example code.
- If you like learning from a book, Python for Informatics has useful chapters on strings, lists, and dictionaries.
- If you prefer interactive exercises, try these lessons from Codecademy: "Python Lists and Dictionaries" and "A Day at the Supermarket".
- If you have more time, try missions 2 and 3 from DataQuest's Learning Python course.
- If you've already mastered these topics and want more of a challenge, try solving Python Challenge number 1 (decoding a message) and send me your code in Slack.
- To give you a framework for thinking about your project, watch What is machine learning, and how does it work? (10 minutes). (This is the IPython notebook shown in the video.) Alternatively, read A Visual Introduction to Machine Learning, which focuses on a specific machine learning model called decision trees.
- Optional: Browse through some more example student projects, which may help to inspire your own project!
Git and Markdown Resources:
- Pro Git is an excellent book for learning Git. Read the first two chapters to gain a deeper understanding of version control and basic commands.
- If you want to practice a lot of Git (and learn many more commands), Git Immersion looks promising.
- If you want to understand how to contribute on GitHub, you first have to understand forks and pull requests.
- GitRef is my favorite reference guide for Git commands, and Git quick reference for beginners is a shorter guide with commands grouped by workflow.
- Cracking the Code to GitHub's Growth explains why GitHub is so popular among developers.
- Markdown Cheatsheet provides a thorough set of Markdown examples with concise explanations. GitHub's Mastering Markdown is a simpler and more attractive guide, but is less comprehensive.
Command Line Resources:
- If you want to go much deeper into the command line, Data Science at the Command Line is a great book. The companion website provides installation instructions for a "data science toolbox" (a virtual machine with many more command line tools), as well as a long reference guide to popular command line tools.
- If you want to do more at the command line with CSV files, try out csvkit, which can be installed via
pip.
Class 3: Data Reading and Cleaning
Homework:
- Complete the Python homework assignment with the Chipotle data, add a commented Python script to your GitHub repo, and submit a link using the homework submission form. You have until Tuesday (9/1) to complete this assignment. (Note: Pandas, which is covered in class 4, should not be used for this assignment.)
Resources:
- Want to understand Python's comprehensions? Think in Excel or SQL may be helpful if you are still confused by list comprehensions.
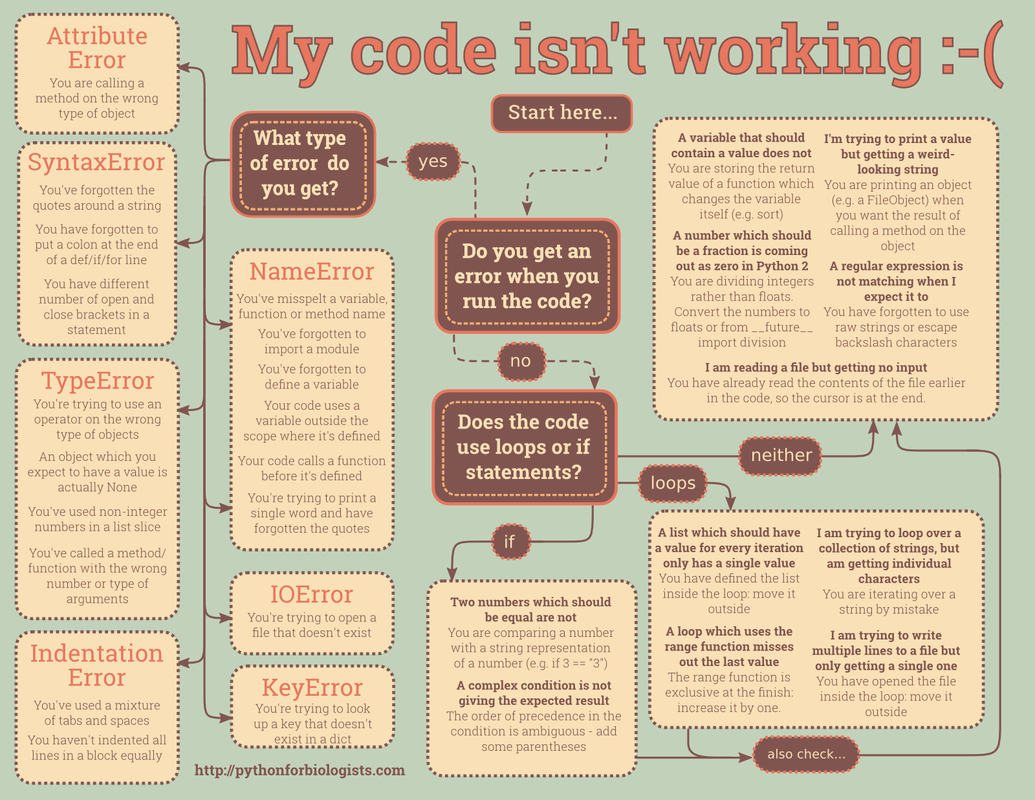
- My code isn't working is a great flowchart explaining how to debug Python errors.
- PEP 8 is Python's "classic" style guide, and is worth a read if you want to write readable code that is consistent with the rest of the Python community.
- If you want to understand Python at a deeper level, Ned Batchelder's Loop Like A Native and Python Names and Values are excellent presentations.
Class 4: Exploratory Data Analysis
- Pandas (code):
- Project question exercise
Homework:
- The deadline for discussing your project ideas with an instructor is Tuesday (9/1), and your project question write-up is due Thursday (9/3).
- Read How Software in Half of NYC Cabs Generates $5.2 Million a Year in Extra Tips for an excellent example of exploratory data analysis.
- Read Anscombe's Quartet, and Why Summary Statistics Don't Tell the Whole Story for a classic example of why visualization is useful.
Resources:
- Browsing or searching the Pandas API Reference is an excellent way to locate a function even if you don't know its exact name.
- What I do when I get a new data set as told through tweets is a fun (yet enlightening) look at the process of exploratory data analysis.
Class 5: Visualization
- Python homework with the Chipotle data due (solution, detailed explanation)
- Part 2 of Exploratory Data Analysis with Pandas (code)
- Visualization with Pandas and Matplotlib (notebook)
Homework:
- Your project question write-up is due on Thursday.
- Complete the Pandas homework assignment with the IMDb data. You have until Tuesday (9/8) to complete this assignment.
- If you're not using Anaconda, install the Jupyter Notebook (formerly known as the IPython Notebook) using
pip. (The Jupyter or IPython Notebook is included with Anaconda.)
Pandas Resources:
- To learn more Pandas, read this three-part tutorial, or review these two excellent (but extremely long) notebooks on Pandas: introduction and data wrangling.
- If you want to go really deep into Pandas (and NumPy), read the book Python for Data Analysis, written by the creator of Pandas.
- This notebook demonstrates the different types of joins in Pandas, for when you need to figure out how to merge two DataFrames.
- This is a nice, short tutorial on pivot tables in Pandas.
- For working with geospatial data in Python, GeoPandas looks promising. This tutorial uses GeoPandas (and scikit-learn) to build a "linguistic street map" of Singapore.
Visualization Resources:
- Watch Look at Your Data (18 minutes) for an excellent example of why visualization is useful for understanding your data.
- For more on Pandas plotting, read this notebook or the visualization page from the official Pandas documentation.
- To learn how to customize your plots further, browse through this notebook on matplotlib or this similar notebook.
- Read Overview of Python Visualization Tools for a useful comparison of Matplotlib, Pandas, Seaborn, ggplot, Bokeh, Pygal, and Plotly.
- To explore different types of visualizations and when to use them, Choosing a Good Chart and The Graphic Continuum are nice one-page references, and the interactive R Graph Catalog has handy filtering capabilities.
- This PowerPoint presentation from Columbia's Data Mining class contains lots of good advice for properly using different types of visualizations.
- Harvard's Data Science course includes an excellent lecture on Visualization Goals, Data Types, and Statistical Graphs (83 minutes), for which the slides are also available.
Class 6: Machine Learning
- Part 2 of Visualization with Pandas and Matplotlib (notebook)
- Brief introduction to the Jupyter/IPython Notebook
- "Human learning" exercise:
- Iris dataset hosted by the UCI Machine Learning Repository
- Iris photo
- Notebook
- Introduction to machine learning (slides)
Homework:
- Optional: Complete the bonus exercise listed in the human learning notebook. It will take the place of any one homework you miss, past or future! This is due on Tuesday (9/8).
- If you're not using Anaconda, install requests and Beautiful Soup 4 using
pip. (Both of these packages are included with Anaconda.)
Machine Learning Resources:
- For a very quick summary of the key points about machine learning, watch What is machine learning, and how does it work? (10 minutes) or read the associated notebook.
- For a more in-depth introduction to machine learning, read section 2.1 (14 pages) of Hastie and Tibshirani's excellent book, An Introduction to Statistical Learning. (It's a free PDF download!)
- The Learning Paradigms video (13 minutes) from Caltech's Learning From Data course provides a nice comparison of supervised versus unsupervised learning, as well as an introduction to "reinforcement learning".
- Real-World Active Learning is a readable and thorough introduction to "active learning", a variation of machine learning in which humans label only the most "important" observations.
- For a preview of some of the machine learning content we will cover during the course, read Sebastian Raschka's overview of the supervised learning process.
- Data Science, Machine Learning, and Statistics: What is in a Name? discusses the differences between these (and other) terms.
- The Emoji Translation Project is a really fun application of machine learning.
- Look up the characteristics of your zip code, and then read about the 67 distinct segments in detail.
IPython Notebook Resources:
- For a recap of the IPython Notebook introduction (and a preview of scikit-learn), watch scikit-learn and the IPython Notebook (15 minutes) or read the associated notebook.
- If you would like to learn the IPython Notebook, the official Notebook tutorials are useful.
- This Reddit discussion compares the relative strengths of the IPython Notebook and Spyder.
Class 7: Getting Data
- Pandas homework with the IMDb data due (solution)
- Optional "human learning" exercise with the iris data due (solution)
- APIs (code)
- Web scraping (code)
Homework:
- Optional: Complete the homework exercise listed in the web scraping code. It will take the place of any one homework you miss, past or future! This is due on Tuesday (9/15).
- Optional: If you're not using Anaconda, install Seaborn using
pip. If you're using Anaconda, install Seaborn by runningconda install seabornat the command line. (Note that some students in past courses have had problems with Anaconda after installing Seaborn.)
API Resources:
- This Python script to query the U.S. Census API was created by a former DAT student. It's a bit more complicated than the example we used in class, it's very well commented, and it may provide a useful framework for writing your own code to query APIs.
- Mashape and Apigee allow you to explore tons of different APIs. Alternatively, a Python API wrapper is available for many popular APIs.
- The Data Science Toolkit is a collection of location-based and text-related APIs.
- API Integration in Python provides a very readable introduction to REST APIs.
- Microsoft's Face Detection API, which powers How-Old.net, is a great example of how a machine learning API can be leveraged to produce a compelling web application.
Web Scraping Resources:
- The Beautiful Soup documentation is incredibly thorough, but is hard to use as a reference guide. However, the section on specifying a parser may be helpful if Beautiful Soup appears to be parsing a page incorrectly.
- For more Beautiful Soup examples and tutorials, see Web Scraping 101 with Python, a former DAT student's well-commented notebook on scraping Craigslist, this notebook from Stanford's Text As Data course, and this notebook and associated video from Harvard's Data Science course.
- For a much longer web scraping tutorial covering Beautiful Soup, lxml, XPath, and Selenium, watch Web Scraping with Python (3 hours 23 minutes) from PyCon 2014. The slides and code are also available.
- For more complex web scraping projects, Scrapy is a popular application framework that works with Python. It has excellent documentation, and here's a tutorial with detailed slides and code.
- robotstxt.org has a concise explanation of how to write (and read) the
robots.txtfile. - import.io and Kimono claim to allow you to scrape websites without writing any code.
- How a Math Genius Hacked OkCupid to Find True Love and How Netflix Reverse Engineered Hollywood are two fun examples of how web scraping has been used to build interesting datasets.
Class 8: K-Nearest Neighbors
- Brief review of Pandas (notebook)
- K-nearest neighbors and scikit-learn (notebook)
- Exercise with NBA player data (notebook, data, data dictionary)
- Exploring the bias-variance tradeoff (notebook)
Homework:
- Reading assignment on the bias-variance tradeoff
- Read Kevin's introduction to reproducibility, read Jeff Leek's guide to creating a reproducible analysis, and watch this related Colbert Report video (8 minutes).
- Work on your project... your first project presentation is in less than two weeks!
KNN Resources:
- For a recap of the key points about KNN and scikit-learn, watch Getting started in scikit-learn with the famous iris dataset (15 minutes) and Training a machine learning model with scikit-learn (20 minutes).
- KNN supports distance metrics other than Euclidean distance, such as Mahalanobis distance, which takes the scale of the data into account.
- A Detailed Introduction to KNN is a bit dense, but provides a more thorough introduction to KNN and its applications.
- This lecture on Image Classification shows how KNN could be used for detecting similar images, and also touches on topics we will cover in future classes (hyperparameter tuning and cross-validation).
- Some applications for which KNN is well-suited are object recognition, satellite image enhancement, document categorization, and gene expression analysis.
Seaborn Resources:
- To get started with Seaborn for visualization, the official website has a series of detailed tutorials and an example gallery.
- Data visualization with Seaborn is a quick tour of some of the popular types of Seaborn plots.
- Visualizing Google Forms Data with Seaborn and How to Create NBA Shot Charts in Python are both good examples of Seaborn usage on real-world data.
Class 9: Basic Model Evaluation
- Optional web scraping homework due (solution)
- Reproducibility
- Discuss assigned readings: introduction, Colbert Report video, cabs article, Tweet, creating a reproducible analysis
- Examples: Classic rock, student project 1, student project 2
- Discuss the reading assignment on the bias-variance tradeoff
- Model evaluation using train/test split (notebook)
- Exploring the scikit-learn documentation: module reference, user guide, class and function documentation
Homework:
- Watch Data science in Python (35 minutes) for an introduction to linear regression (and a review of other course content), or at the very least, read through the associated notebook.
- Optional: For another introduction to linear regression, watch The Easiest Introduction to Regression Analysis (14 minutes).
Model Evaluation Resources:
- For a recap of some of the key points from today's lesson, watch Comparing machine learning models in scikit-learn (27 minutes).
- For another explanation of training error versus testing error, the bias-variance tradeoff, and train/test split (also known as the "validation set approach"), watch Hastie and Tibshirani's video on estimating prediction error (12 minutes, starting at 2:34).
- Caltech's Learning From Data course includes a fantastic video on visualizing bias and variance (15 minutes).
- Random Test/Train Split is Not Always Enough explains why random train/test split may not be a suitable model evaluation procedure if your data has a significant time element.
Reproducibility Resources:
- What We've Learned About Sharing Our Data Analysis includes tips from BuzzFeed News about how to publish a reproducible analysis.
- Software development skills for data scientists discusses the importance of writing functions and proper code comments (among other skills), which are highly useful for creating a reproducible analysis.
- Data science done well looks easy - and that is a big problem for data scientists explains how a reproducible analysis demonstrates all of the work that goes into proper data science.
Class 10: Linear Regression
- Machine learning exercise (article)
- Linear regression (notebook)
- Capital Bikeshare dataset used in a Kaggle competition
- Data dictionary
- Feature engineering example: Predicting User Engagement in Corporate Collaboration Network
Homework:
- Your first project presentation is on Tuesday (9/22)! Please submit a link to your project repository (with slides, code, data, and visualizations) by 6pm on Tuesday.
- Complete the homework assignment with the Yelp data. This is due on Thursday (9/24).
Linear Regression Resources:
- To go much more in-depth on linear regression, read Chapter 3 of An Introduction to Statistical Learning. Alternatively, watch the related videos or read my quick reference guide to the key points in that chapter.
- This introduction to linear regression is more detailed and mathematically thorough, and includes lots of good advice.
- This is a relatively quick post on the assumptions of linear regression.
- Setosa has an interactive visualization of linear regression.
- For a brief introduction to confidence intervals, hypothesis testing, p-values, and R-squared, as well as a comparison between scikit-learn code and Statsmodels code, read my DAT7 lesson on linear regression.
- Here is a useful explanation of confidence intervals from Quora.
- Hypothesis Testing: The Basics provides a nice overview of the topic, and John Rauser's talk on Statistics Without the Agonizing Pain (12 minutes) gives a great explanation of how the null hypothesis is rejected.
- Earlier this year, a major scientific journal banned the use of p-values:
- Scientific American has a nice summary of the ban.
- This response to the ban in Nature argues that "decisions that are made earlier in data analysis have a much greater impact on results".
- Andrew Gelman has a readable paper in which he argues that "it's easy to find a p < .05 comparison even if nothing is going on, if you look hard enough".
- Science Isn't Broken includes a neat tool that allows you to "p-hack" your way to "statistically significant" results.
- Accurately Measuring Model Prediction Error compares adjusted R-squared, AIC and BIC, train/test split, and cross-validation.
Other Resources:
- Section 3.3.1 of An Introduction to Statistical Learning (4 pages) has a great explanation of dummy encoding for categorical features.
- Kaggle has some nice visualizations of the bikeshare data we used today.
Class 11: First Project Presentation
- Project presentations!
Homework:
- Watch Rahul Patwari's videos on probability (5 minutes) and odds (8 minutes) if you're not comfortable with either of those terms.
- Read these excellent articles from BetterExplained: An Intuitive Guide To Exponential Functions & e and Demystifying the Natural Logarithm (ln). Then, review this brief summary of exponential functions and logarithms.
Class 12: Logistic Regression
- Yelp votes homework due (solution)
- Logistic regression (notebook)
- Exercise with Titanic data (notebook, data, data dictionary)
- Confusion matrix (slides, notebook)
Homework:
- If you aren't yet comfortable with all of the confusion matrix terminology, watch Rahul Patwari's videos on Intuitive sensitivity and specificity (9 minutes) and The tradeoff between sensitivity and specificity (13 minutes).
- Video/reading assignment on ROC curves and AUC
- Video/reading assignment on cross-validation
Logistic Regression Resources:
- To go deeper into logistic regression, read the first three sections of Chapter 4 of An Introduction to Statistical Learning, or watch the first three videos (30 minutes) from that chapter.
- For a math-ier explanation of logistic regression, watch the first seven videos (71 minutes) from week 3 of Andrew Ng's machine learning course, or read the related lecture notes compiled by a student.
- For more on interpreting logistic regression coefficients, read this excellent guide by UCLA's IDRE and these lecture notes from the University of New Mexico.
- The scikit-learn documentation has a nice explanation of what it means for a predicted probability to be calibrated.
- Supervised learning superstitions cheat sheet is a very nice comparison of four classifiers we cover in the course (logistic regression, decision trees, KNN, Naive Bayes) and one classifier we do not cover (Support Vector Machines).
Confusion Matrix Resources:
- My simple guide to confusion matrix terminology may be useful to you as a reference.
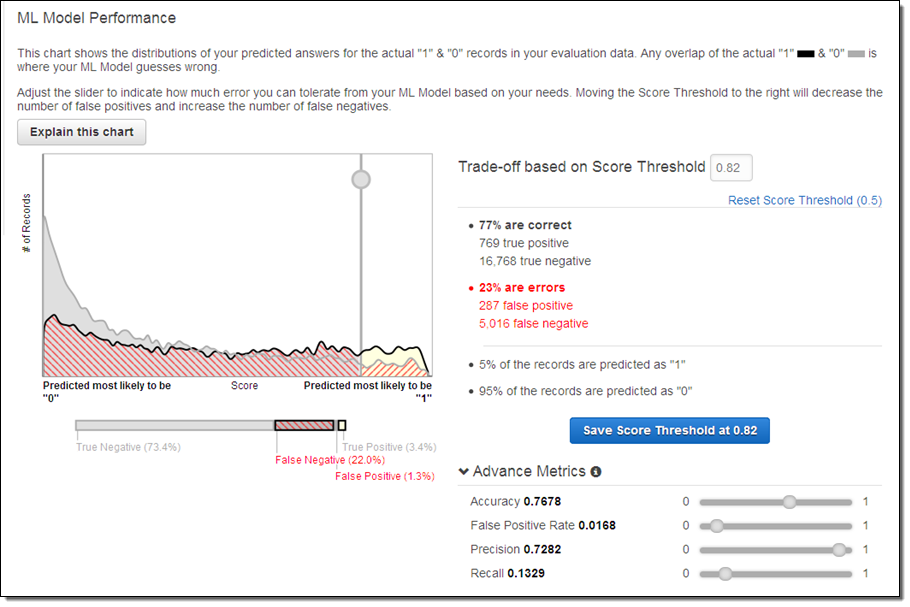
- This blog post about Amazon Machine Learning contains a neat graphic showing how classification threshold affects different evaluation metrics.
- This notebook (from another DAT course) explains how to calculate "expected value" from a confusion matrix by treating it as a cost-benefit matrix.
Class 13: Advanced Model Evaluation
- Data preparation (notebook)
- Handling missing values
- Handling categorical features (review)
- ROC curves and AUC
- Discuss the video/reading assignment
- Exercise: drawing an ROC curve (slides)
- Return to the main notebook
- Cross-validation
- Discuss the video/reading assignment and associated notebook
- Return to the main notebook
- Exercise with bank marketing data (notebook, data, data dictionary)
Homework:
- Reading assignment on spam filtering
- Read these Introduction to Probability slides, or skim section 2.1 of the OpenIntro Statistics textbook (12 pages). Pay specific attention to the following terms: probability, mutually exclusive, sample space, independent.
- Optional: Try to gain an understanding of conditional probability from this visualization.
- Optional: For an intuitive introduction to Bayes' theorem, read these posts on wealth and happiness, ducks, or legos.
ROC Resources:
- Rahul Patwari has a great video on ROC Curves (12 minutes).
- An introduction to ROC analysis is a very readable paper on the topic.
- ROC curves can be used across a wide variety of applications, such as comparing different feature sets for detecting fraudulent Skype users, and comparing different classifiers on a number of popular datasets.
Cross-Validation Resources:
- For more on cross-validation, read section 5.1 of An Introduction to Statistical Learning (11 pages) or watch the related videos: K-fold and leave-one-out cross-validation (14 minutes), cross-validation the right and wrong ways (10 minutes).
- If you want to understand the different variations of cross-validation, this paper examines and compares them in detail.
- To learn how to use GridSearchCV and RandomizedSearchCV for parameter tuning, watch How to find the best model parameters in scikit-learn (28 minutes) or read the associated notebook.
Other Resources:
- scikit-learn has extensive documentation on model evaluation.
- Counterfactual evaluation of machine learning models (45 minutes) is an excellent talk about the sophisticated way in which Stripe evaluates its fraud detection model. (These are the associated slides.)
- Visualizing Machine Learning Thresholds to Make Better Business Decisions demonstrates how visualizing precision, recall, and "queue rate" at different thresholds can help you to maximize the business value of your classifier.
Class 14: Naive Bayes and Text Data
- Conditional probability and Bayes' theorem
- Slides (adapted from Visualizing Bayes' theorem)
- Applying Bayes' theorem to iris classification (notebook)
- Naive Bayes classification
- Applying Naive Bayes to text data in scikit-learn (notebook)
- CountVectorizer documentation
- SMS messages: data, data dictionary
Homework:
- Complete another homework assignment with the Yelp data. This is due on Tuesday (10/6).
- Confirm that you have TextBlob installed by running
import textblobfrom within your preferred Python environment. If it's not installed, runpip install textblobat the command line (not from within Python).
Resources:
- Sebastian Raschka's article on Naive Bayes and Text Classification covers the conceptual material from today's class in much more detail.
- For more on conditional probability, read these slides, or read section 2.2 of the OpenIntro Statistics textbook (15 pages).
- For an intuitive explanation of Naive Bayes classification, read this post on airport security.
- For more details on Naive Bayes classification, Wikipedia has two excellent articles (Naive Bayes classifier and Naive Bayes spam filtering), and Cross Validated has a good Q&A.
- When applying Naive Bayes classification to a dataset with continuous features, it is better to use GaussianNB rather than MultinomialNB. This notebook compares their performances on such a dataset. Wikipedia has a short description of Gaussian Naive Bayes, as well as an excellent example of its usage.
- These slides from the University of Maryland provide more mathematical details on both logistic regression and Naive Bayes, and also explain how Naive Bayes is actually a "special case" of logistic regression.
- Andrew Ng has a paper comparing the performance of logistic regression and Naive Bayes across a variety of datasets.
- If you enjoyed Paul Graham's article, you can read his follow-up article on how he improved his spam filter and this related paper about state-of-the-art spam filtering in 2004.
- Yelp has found that Naive Bayes is more effective than Mechanical Turks at categorizing businesses.
Class 15: Natural Language Processing
- Yelp review text homework due (solution)
- Natural language processing (notebook)
- Introduction to our Kaggle competition
- Create a Kaggle account, join the competition using the invitation link, download the sample submission, and then submit the sample submission (which will require SMS account verification).
Homework:
- Your draft paper is due on Thursday (10/8)! Please submit a link to your project repository (with paper, code, data, and visualizations) before class.
- Watch Kaggle: How it Works (4 minutes) for a brief overview of the Kaggle platform.
- Download the competition files, move them to the
DAT8/datadirectory, and make sure you can open the CSV files using Pandas. If you have any problems opening the files, you probably need to turn off real-time virus scanning (especially Microsoft Security Essentials). - Optional: Come up with some theories about which features might be relevant to predicting the response, and then explore the data to see if those theories appear to be true.
- Optional: Watch my project presentation video (16 minutes) for a tour of the end-to-end machine learning process for a Kaggle competition, including feature engineering. (Or, just read through the slides.)
NLP Resources:
- If you want to learn a lot more NLP, check out the excellent video lectures and slides from this Coursera course (which is no longer being offered).
- This slide deck defines many of the key NLP terms.
- Natural Language Processing with Python is the most popular book for going in-depth with the Natural Language Toolkit (NLTK).
- A Smattering of NLP in Python provides a nice overview of NLTK, as does this notebook from DAT5.
- spaCy is a newer Python library for text processing that is focused on performance (unlike NLTK).
- If you want to get serious about NLP, Stanford CoreNLP is a suite of tools (written in Java) that is highly regarded.
- When working with a large text corpus in scikit-learn, HashingVectorizer is a useful alternative to CountVectorizer.
- Automatically Categorizing Yelp Businesses discusses how Yelp uses NLP and scikit-learn to solve the problem of uncategorized businesses.
- Modern Methods for Sentiment Analysis shows how "word vectors" can be used for more accurate sentiment analysis.
- Identifying Humorous Cartoon Captions is a readable paper about identifying funny captions submitted to the New Yorker Caption Contest.
- DC Natural Language Processing is an active Meetup group in our local area.
Class 16: Kaggle Competition
- Overview of how Kaggle works (slides)
- Kaggle In-Class competition: Predict whether a Stack Overflow question will be closed
- Complete code file
- Minimal code file: excludes all exploratory code
- Explanations of log loss
Homework:
- You will be assigned to review the project drafts of two of your peers. You have until Tuesday 10/20 to provide them with feedback, according to the peer review guidelines.
- Read A Visual Introduction to Machine Learning for a brief overview of decision trees.
- Download and install Graphviz, which will allow you to visualize decision trees in scikit-learn.
- Windows users should also add Graphviz to your path: Go to Control Panel, System, Advanced System Settings, Environment Variables. Under system variables, edit "Path" to include the path to the "bin" folder, such as:
C:\Program Files (x86)\Graphviz2.38\bin
- Windows users should also add Graphviz to your path: Go to Control Panel, System, Advanced System Settings, Environment Variables. Under system variables, edit "Path" to include the path to the "bin" folder, such as:
- Optional: Keep working on our Kaggle competition! You can make up to 5 submissions per day, and the competition doesn't close until 6:30pm ET on Tuesday 10/27 (class 21).
Resources:
- Specialist Knowledge Is Useless and Unhelpful is a brief interview with Jeremy Howard (past president of Kaggle) in which he argues that data science skills are much more important than domain expertise for creating effective predictive models.
- Getting in Shape for the Sport of Data Science (74 minutes), also by Jeremy Howard, contains a lot of tips for competitive machine learning.
- Learning from the best is an excellent blog post covering top tips from Kaggle Masters on how to do well on Kaggle.
- Feature Engineering Without Domain Expertise (17 minutes), a talk by Kaggle Master Nick Kridler, provides some simple advice about how to iterate quickly and where to spend your time during a Kaggle competition.
- These examples may help you to better understand the process of feature engineering: predicting the number of passengers at a train station, identifying fraudulent users of an online store, identifying bots in an online auction, predicting who will subscribe to the next season of an orchestra, and evaluating the quality of e-commerce search engine results.
- Our perfect submission is a fun read about how great performance on the public leaderboard does not guarantee that a model will generalize to new data.
Class 17: Decision Trees
- Decision trees (notebook)
- Exercise with Capital Bikeshare data (notebook, data, data dictionary)
Homework:
- Read the "Wisdom of the crowds" section from MLWave's post on Human Ensemble Learning.
- Optional: Read the abstract from Do We Need Hundreds of Classifiers to Solve Real World Classification Problems?, as well as Kaggle CTO Ben Hamner's comment about the paper, paying attention to the mentions of "Random Forests".
Resources:
- scikit-learn's documentation on decision trees includes a nice overview of trees as well as tips for proper usage.
- For a more thorough introduction to decision trees, read section 4.3 (23 pages) of Introduction to Data Mining. (Chapter 4 is available as a free download.)
- If you want to go deep into the different decision tree algorithms, this slide deck contains A Brief History of Classification and Regression Trees.
- The Science of Singing Along contains a neat regression tree (page 136) for predicting the percentage of an audience at a music venue that will sing along to a pop song.
- Decision trees are common in the medical field for differential diagnosis, such as this classification tree for identifying psychosis.
Class 18: Ensembling
- Finish decision trees lesson (notebook)
- Ensembling (notebook)
- Major League Baseball player data from 1986-87
- Data dictionary (page 7)
Resources:
- scikit-learn's documentation on ensemble methods covers both "averaging methods" (such as bagging and Random Forests) as well as "boosting methods" (such as AdaBoost and Gradient Tree Boosting).
- MLWave's Kaggle Ensembling Guide is very thorough and shows the many different ways that ensembling can take place.
- Browse the excellent solution paper from the winner of Kaggle's CrowdFlower competition for an example of the work and insight required to win a Kaggle competition.
- Interpretable vs Powerful Predictive Models: Why We Need Them Both is a short post on how the tactics useful in a Kaggle competition are not always useful in the real world.
- Not Even the People Who Write Algorithms Really Know How They Work argues that the decreased interpretability of state-of-the-art machine learning models has a negative impact on society.
- For an intuitive explanation of Random Forests, read Edwin Chen's answer to How do random forests work in layman's terms?
- Large Scale Decision Forests: Lessons Learned is an excellent post from Sift Science about their custom implementation of Random Forests.
- Unboxing the Random Forest Classifier describes a way to interpret the inner workings of Random Forests beyond just feature importances.
- Understanding Random Forests: From Theory to Practice is an in-depth academic analysis of Random Forests, including details of its implementation in scikit-learn.
Class 19: Advanced scikit-learn and Clustering
- Advanced scikit-learn (notebook)
- StandardScaler: standardizing features
- Pipeline: chaining steps
- Clustering (slides, notebook)
- K-means: documentation, visualization 1, visualization 2
- DBSCAN: documentation, visualization
Homework:
- Reread Understanding the Bias-Variance Tradeoff. (The "answers" to the guiding questions have been posted and may be helpful to you.)
- Optional: Watch these two excellent (and related) videos from Caltech's Learning From Data course: bias-variance tradeoff (15 minutes) and regularization (8 minutes).
scikit-learn Resources:
- This is a longer example of feature scaling in scikit-learn, with additional discussion of the types of scaling you can use.
- Practical Data Science in Python is a long and well-written notebook that uses a few advanced scikit-learn features: pipelining, plotting a learning curve, and pickling a model.
- To learn how to use GridSearchCV and RandomizedSearchCV for parameter tuning, watch How to find the best model parameters in scikit-learn (28 minutes) or read the associated notebook.
- Sebastian Raschka has a number of excellent resources for scikit-learn users, including a repository of tutorials and examples, a library of machine learning tools and extensions, a new book, and a semi-active blog.
- scikit-learn has an incredibly active mailing list that is often much more useful than Stack Overflow for researching functions and asking questions.
- If you forget how to use a particular scikit-learn function that we have used in class, don't forget that this repository is fully searchable!
Clustering Resources:
- For a very thorough introduction to clustering, read chapter 8 (69 pages) of Introduction to Data Mining (available as a free download), or browse through the chapter 8 slides.
- scikit-learn's user guide compares many different types of clustering.
- This PowerPoint presentation from Columbia's Data Mining class provides a good introduction to clustering, including hierarchical clustering and alternative distance metrics.
- An Introduction to Statistical Learning has useful videos on K-means clustering (17 minutes) and hierarchical clustering (15 minutes).
- This is an excellent interactive visualization of hierarchical clustering.
- This is a nice animated explanation of mean shift clustering.
- The K-modes algorithm can be used for clustering datasets of categorical features without converting them to numerical values. Here is a Python implementation.
- Here are some fun examples of clustering: A Statistical Analysis of the Work of Bob Ross (with data and Python code), How a Math Genius Hacked OkCupid to Find True Love, and characteristics of your zip code.
Class 20: Regularization and Regular Expressions
- Regularization (notebook)
- Regression: Ridge, RidgeCV, Lasso, LassoCV
- Classification: LogisticRegression
- Helper functions: Pipeline, GridSearchCV
- Regular expressions
- Baltimore homicide data
- Regular expressions 101: real-time testing of regular expressions
- Reference guide
- Exercise
Homework:
- Your final project is due next week!
- Optional: Make your final submissions to our Kaggle competition! It closes at 6:30pm ET on Tuesday 10/27.
- Optional: Read this classic paper, which may help you to connect many of the topics we have studied throughout the course: A Few Useful Things to Know about Machine Learning.
Regularization Resources:
- The scikit-learn user guide for Generalized Linear Models explains different variations of regularization.
- Section 6.2 of An Introduction to Statistical Learning (14 pages) introduces both lasso and ridge regression. Or, watch the related videos on ridge regression (13 minutes) and lasso regression (15 minutes).
- For more details on lasso regression, read Tibshirani's original paper.
- For a math-ier explanation of regularization, watch the last four videos (30 minutes) from week 3 of Andrew Ng's machine learning course, or read the related lecture notes compiled by a student.
- This notebook from chapter 7 of Building Machine Learning Systems with Python has a nice long example of regularized linear regression.
- There are some special considerations when using dummy encoding for categorical features with a regularized model. This Cross Validated Q&A debates whether the dummy variables should be standardized (along with the rest of the features), and a comment on this blog post recommends that the baseline level should not be dropped.
Regular Expressions Resources:
- Google's Python Class includes an excellent introductory lesson on regular expressions (which also has an associated video).
- Python for Informatics has a nice chapter on regular expressions. (If you want to run the examples, you'll need to download mbox.txt and mbox-short.txt.)
- Breaking the Ice with Regular Expressions is an interactive Code School course, though only the first "level" is free.
- If you want to go really deep with regular expressions, RexEgg includes endless articles and tutorials.
- 5 Tools You Didn't Know That Use Regular Expressions demonstrates how regular expressions can be used with Excel, Word, Google Spreadsheets, Google Forms, text editors, and other tools.
- Exploring Expressions of Emotions in GitHub Commit Messages is a fun example of how regular expressions can be used for data analysis, and Emojineering explains how Instagram uses regular expressions to detect emoji in hashtags.
Class 21: Course Review and Final Project Presentation
- Project presentations!
- Data science review
Resources:
- scikit-learn's machine learning map may help you to choose the "best" model for your task.
- Choosing a Machine Learning Classifier is a short and highly readable comparison of several classification models, Classifier comparison is scikit-learn's visualization of classifier decision boundaries, Comparing supervised learning algorithms is a model comparison table that I created, and Supervised learning superstitions cheat sheet is a more thorough comparison (with links to lots of useful resources).
- Machine Learning Done Wrong, Machine Learning Gremlins (31 minutes), Clever Methods of Overfitting, and Common Pitfalls in Machine Learning all offer thoughtful advice on how to avoid common mistakes in machine learning.
- Practical machine learning tricks from the KDD 2011 best industry paper and Andrew Ng's Advice for applying machine learning include slightly more advanced advice than the resources above.
- An Empirical Comparison of Supervised Learning Algorithms is a readable research paper from 2006, which was also presented as a talk (77 minutes).
Class 22: Final Project Presentation
- Project presentations!
- What's next?
Additional Resources
Tidy Data
- Good Data Management Practices for Data Analysis briefly summarizes the principles of "tidy data".
- Hadley Wickham's paper explains tidy data in detail and includes lots of good examples.
- Example of a tidy dataset: Bob Ross
- Examples of untidy datasets: NFL ticket prices, airline safety, Jets ticket prices, Chipotle orders
- If your co-workers tend to create spreadsheets that are unreadable by computers, they may benefit from reading these tips for releasing data in spreadsheets. (There are some additional suggestions in this answer from Cross Validated.)
Databases and SQL
- This GA slide deck provides a brief introduction to databases and SQL. The Python script from that lesson demonstrates basic SQL queries, as well as how to connect to a SQLite database from Python and how to query it using Pandas.
- The repository for this SQL Bootcamp contains an extremely well-commented SQL script that is suitable for walking through on your own.
- This GA notebook provides a shorter introduction to databases and SQL that helpfully contrasts SQL queries with Pandas syntax.
- SQLZOO, Mode Analytics, Khan Academy, Codecademy, Datamonkey, and Code School all have online beginner SQL tutorials that look promising. Code School also offers an advanced tutorial, though it's not free.
- w3schools has a sample database that allows you to practice SQL from your browser. Similarly, Kaggle allows you to query a large SQLite database of Reddit Comments using their online "Scripts" application.
- What Every Data Scientist Needs to Know about SQL is a brief series of posts about SQL basics, and Introduction to SQL for Data Scientists is a paper with similar goals.
- 10 Easy Steps to a Complete Understanding of SQL is a good article for those who have some SQL experience and want to understand it at a deeper level.
- SQLite's article on Query Planning explains how SQL queries "work".
- A Comparison Of Relational Database Management Systems gives the pros and cons of SQLite, MySQL, and PostgreSQL.
- If you want to go deeper into databases and SQL, Stanford has a well-respected series of 14 mini-courses.
- Blaze is a Python package enabling you to use Pandas-like syntax to query data living in a variety of data storage systems.
Recommendation Systems
- This GA slide deck provides a brief introduction to recommendation systems, and the Python script from that lesson demonstrates how to build a simple recommender.
- Chapter 9 of Mining of Massive Datasets (36 pages) is a more thorough introduction to recommendation systems.
- Chapters 2 through 4 of A Programmer's Guide to Data Mining (165 pages) provides a friendlier introduction, with lots of Python code and exercises.
- The Netflix Prize was the famous competition for improving Netflix's recommendation system by 10%. Here are some useful articles about the Netflix Prize:
- Netflix Recommendations: Beyond the 5 stars: Two posts from the Netflix blog summarizing the competition and their recommendation system
- Winning the Netflix Prize: A Summary: Overview of the models and techniques that went into the winning solution
- A Perspective on the Netflix Prize: A summary of the competition by the winning team
- This paper summarizes how Amazon.com's recommendation system works, and this Stack Overflow Q&A has some additional thoughts.
- Facebook and Etsy have blog posts about how their recommendation systems work.
- The Global Network of Discovery provides some neat recommenders for music, authors, and movies.
- The People Inside Your Machine (23 minutes) is a Planet Money podcast episode about how Amazon Mechanical Turks can assist with recommendation engines (and machine learning in general).
- Coursera has a course on recommendation systems, if you want to go even deeper into the material.

 11 Dec 30, 2022
 24 Nov 29, 2022
 13 Nov 26, 2022
 2k Dec 29, 2022
 3 Dec 14, 2022
 16 Nov 04, 2022
 86 Dec 25, 2022
 1 Jan 16, 2022
 2 Aug 21, 2022
 2 Nov 18, 2022
 20 Jan 05, 2023
 34 Nov 18, 2022
 15.7k Jan 07, 2023
 81 Dec 26, 2022
 17 Jul 09, 2022
 27 Dec 28, 2022
 4 Jan 12, 2022
 1 Jan 24, 2022
 2.8k Dec 31, 2022
 73 Jan 03, 2023