Peloton Stats to Google Sheets with Data Visualization through Seaborn and Plotly

Overview

Peloton Stats to Google Sheets with Data Visualization through Seaborn and Plotly

Problem: 2 peloton users were looking for a way to track their metrics in a way that was readable and available

Solution: this script. I personally run this at set intervals on a raspberry pi, so access to their data is usable at virtually all hours.

Here's how it works. The code relies on first having built a csv file which contains the headings of 'name', 'username', 'email', and 'password' (for Peloton). The script pulls data from this file and then logs into peloton. From there, it downloads the users CSV data with all of their workout data. For my specific needs, we only cared about cycling data (which you will notice in the code). Several calculations are performed and some clean up is completed on the dataframes. That data is then passed into the user's assigned Google Sheet (which also includes their interactive 'goal' cell used for pace calculations [this resets on the first of each year]. Since I am running on a raspberry pi, I use SMTP to send an email to each user at the end of the day with a daily wrap email.

The script utilizes several dependencies (noted in the code itself). One of the dependencies is based on the google sheets API. Information can be found here: https://developers.google.com/sheets/api

You might also like...
Productivity Tools for Plotly + Pandas

Cufflinks This library binds the power of plotly with the flexibility of pandas for easy plotting. This library is available on https://github.com/san

Custom Plotly Dash components based on Mantine React Components library

Dash Mantine Components Dash Mantine Components is a Dash component library based on Mantine React Components Library. It makes it easier to create go

 A Simple Flask-Plotly Example for NTU 110-1 DSSI Class
A Simple Flask-Plotly Example for NTU 110-1 DSSI Class

A Simple Flask-Plotly Example for NTU 110-1 DSSI Class Live Demo Prerequisites We will use Flask and Ploty to build a Flask application. If you haven'

A shimmer pre-load component for Plotly Dash

dash-loading-shimmer A shimmer pre-load component for Plotly Dash Installation Get it with pip: pip install dash-loading-extras Or maybe you prefer Pi

3D plotting and mesh analysis through a streamlined interface for the Visualization Toolkit (VTK)

PyVista Deployment Build Status Metrics Citation License Community 3D plotting and mesh analysis through a streamlined interface for the Visualization

3D plotting and mesh analysis through a streamlined interface for the Visualization Toolkit (VTK)

PyVista Deployment Build Status Metrics Citation License Community 3D plotting and mesh analysis through a streamlined interface for the Visualization

Create Badges with stats of Scratch User, Project and Studio. Use those badges in Github readmes, etc.

Scratch-Stats-Badge Create customized Badges with stats of Scratch User, Studio or Project. Use those badges in Github readmes, etc. Examples Document

 GitHub Stats Visualizations : Transparent
GitHub Stats Visualizations : Transparent

GitHub Stats Visualizations : Transparent Generate visualizations of GitHub user and repository statistics using GitHub Actions. ⚠️ Disclaimer The pro

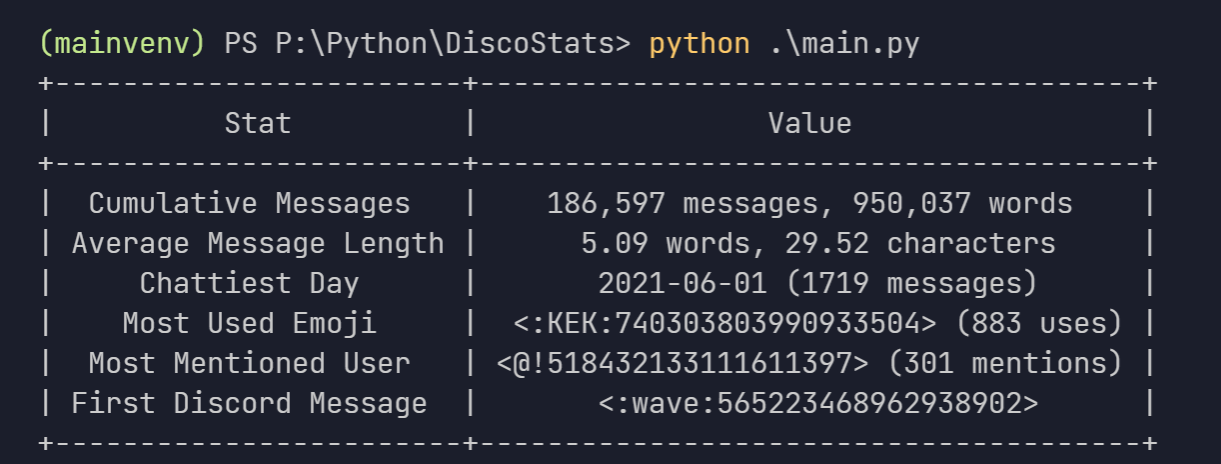
view cool stats related to your discord account.

DiscoStats cool statistics generated using your discord data. How? DiscoStats is not a service that breaks the Discord Terms of Service or Community G

Releases(v2.1.2)
  • v2.1.2(Feb 1, 2022)

    1. added a '--pause' arg to the script to facilitate the pausing for service account quota exceeded errors
    2. Initial push of a google sheet builder

    What's Changed

    • Sheet Build Initial Push by @tychaney in https://github.com/tychaney/Peloton-Data-to-Google-Sheets/pull/3

    Full Changelog: https://github.com/tychaney/Peloton-Data-to-Google-Sheets/compare/v2.1.1...v2.1.2

    Source code(tar.gz)
    Source code(zip)
  • v2.1.1(Jan 31, 2022)

    Minor bug fix from 2.1.0 Corrected the monthly pace calculation

    What's Changed

    • v 2.1.0 by @tychaney in https://github.com/tychaney/Peloton-Data-to-Google-Sheets/pull/2

    Full Changelog: https://github.com/tychaney/Peloton-Data-to-Google-Sheets/compare/v2.1.0...v2.1.1

    Source code(tar.gz)
    Source code(zip)
100 Days of Code The Complete Python Pro Bootcamp for 2022

100-Day-With-Python 100 Days of Code - The Complete Python Pro Bootcamp for 2022. In this course, I spend with python language over 100 days, and I up

Rajdip Das 8 Jun 22, 2022
Fastest Gephi's ForceAtlas2 graph layout algorithm implemented for Python and NetworkX

ForceAtlas2 for Python A port of Gephi's Force Atlas 2 layout algorithm to Python 2 and Python 3 (with a wrapper for NetworkX and igraph). This is the

Bhargav Chippada 227 Jan 05, 2023
Make visual music sheets for thatskygame (graphical representations of the Sky keyboard)

sky-python-music-sheet-maker This program lets you make visual music sheets for Sky: Children of the Light. It will ask you a few questions, and does

21 Aug 26, 2022
Rockstar - Makes you a Rockstar C++ Programmer in 2 minutes

Rockstar Rockstar is one amazing library, which will make you a Rockstar Programmer in just 2 minutes. In last decade, people learned C++ in 21 days.

4k Jan 05, 2023
GD-UltraHack - A Mod Menu for Geometry Dash. Specifically a MegahackV5 clone in Python. Only for Windows

GD UltraHack: The Mod Menu that Nobody asked for. This is a mod menu for the gam

zeo 1 Jan 05, 2022
FairLens is an open source Python library for automatically discovering bias and measuring fairness in data

FairLens FairLens is an open source Python library for automatically discovering bias and measuring fairness in data. The package can be used to quick

Synthesized 69 Dec 15, 2022
A simple Monte Carlo simulation using Python and matplotlib library

Monte Carlo python simulation Install linux dependencies sudo apt update sudo apt install build-essential \ software-properties-commo

Samuel Terra 2 Dec 13, 2021
Drag’n’drop Pivot Tables and Charts for Jupyter/IPython Notebook, care of PivotTable.js

pivottablejs: the Python module Drag’n’drop Pivot Tables and Charts for Jupyter/IPython Notebook, care of PivotTable.js Installation pip install pivot

Nicolas Kruchten 512 Dec 26, 2022
A curated list of awesome Dash (plotly) resources

Awesome Dash A curated list of awesome Dash (plotly) resources Dash is a productive Python framework for building web applications. Written on top of

Luke Singham 1.7k Dec 26, 2022
Pretty Confusion Matrix

Pretty Confusion Matrix Why pretty confusion matrix? We can make confusion matrix by using matplotlib. However it is not so pretty. I want to make con

Junseo Ko 5 Nov 22, 2022
Python code for solving 3D structural problems using the finite element method

3DFEM Python 3D finite element code This python code allows for solving 3D structural problems using the finite element method. New features will be a

Rémi Capillon 6 Sep 29, 2022
Use Perspective to create the chart for the trader’s dashboard

Task Overview | Installation Instructions | Link to Module 3 Introduction Experience Technology at JP Morgan Chase Try out what real work is like in t

Abdulazeez Jimoh 1 Jan 22, 2022
Blender addon that creates a temporary window of any type from the 3D View.

CreateTempWindow2.8 Blender addon that creates a temporary window of any type from the 3D View. Features Can the following window types: 3D View Graph

3 Nov 27, 2022
Process dataframe in a easily way.

Popanda Written by Shengxuan Wang at OSU. Used for processing dataframe, especially for machine learning. The name is from "Po" in the movie Kung Fu P

ShawnWang 1 Dec 24, 2021
3D plotting and mesh analysis through a streamlined interface for the Visualization Toolkit (VTK)

PyVista Deployment Build Status Metrics Citation License Community 3D plotting and mesh analysis through a streamlined interface for the Visualization

PyVista 1.6k Jan 08, 2023
Visualizations for machine learning datasets

Introduction The facets project contains two visualizations for understanding and analyzing machine learning datasets: Facets Overview and Facets Dive

PAIR code 7.1k Jan 07, 2023
Plot toolbox based on Matplotlib, simple and elegant.

Elegant-Plot Plot toolbox based on Matplotlib, simple and elegant. 绘制效果 绘制过程 数据准备 每种图标类型的目录下有data.csv文件,依据样例数据填入自己的数据。

3 Jul 15, 2022
View part of your screen in grayscale or simulated color vision deficiency.

monolens View part of your screen in grayscale or filtered to simulate color vision deficiency. Watch the demo on YouTube. Install with pip install mo

Hans Dembinski 31 Oct 11, 2022
A Python function that makes flower plots.

Flower plot A Python 3.9+ function that makes flower plots. Installation This package requires at least Python 3.9. pip install

Thomas Roder 4 Jun 12, 2022
Some method of processing point cloud

Point-Cloud Some method of processing point cloud inversion the completion pointcloud to incomplete point cloud Some model of encoding point cloud to

Tan 1 Nov 19, 2021