🎨 Python Echarts Plotting Library

Overview

pyecharts logo

pyecharts

Python ❤️ ECharts = pyecharts

Travis Build Status Appveyor Build Status Codecov Package version PyPI - Python Version

PyPI - Format Contributions welcome License

English README

📣 简介

Apache ECharts (incubating) 是一个由百度开源的数据可视化,凭借着良好的交互性,精巧的图表设计,得到了众多开发者的认可。而 Python 是一门富有表达力的语言,很适合用于数据处理。当数据分析遇上数据可视化时,pyecharts 诞生了。

特性

  • 简洁的 API 设计,使用如丝滑般流畅,支持链式调用
  • 囊括了 30+ 种常见图表,应有尽有
  • 支持主流 Notebook 环境,Jupyter Notebook 和 JupyterLab
  • 可轻松集成至 Flask,Sanic,Django 等主流 Web 框架
  • 高度灵活的配置项,可轻松搭配出精美的图表
  • 详细的文档和示例,帮助开发者更快的上手项目
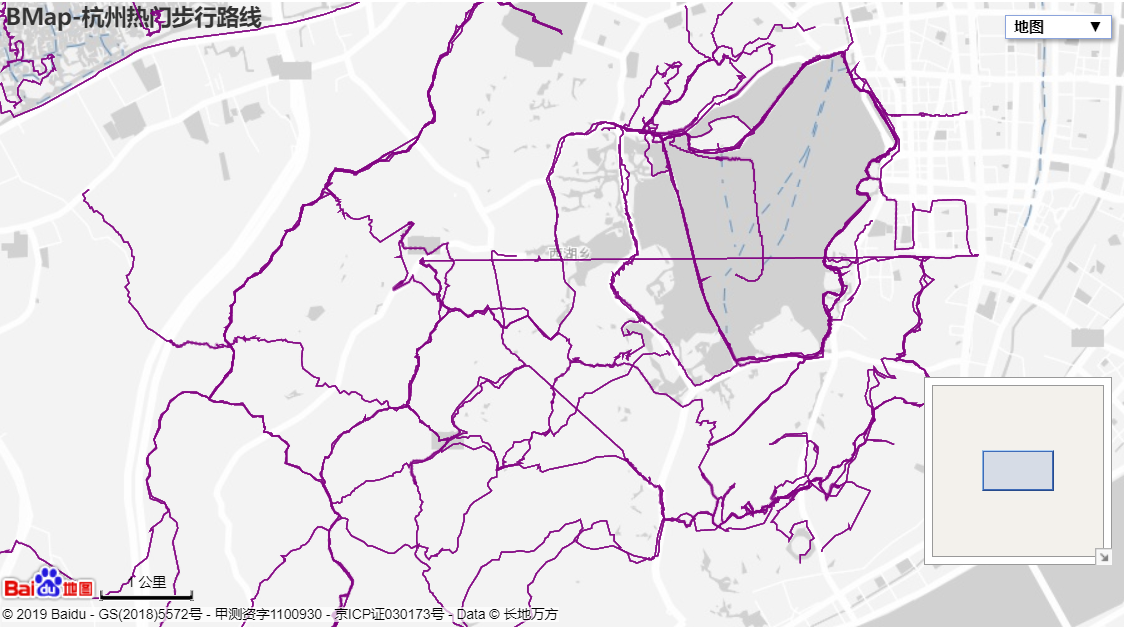
  • 多达 400+ 地图文件,并且支持原生百度地图,为地理数据可视化提供强有力的支持

版本

v0.5.x 和 V1 间不兼容,V1 是一个全新的版本,详见 ISSUE#892ISSUE#1033

V0.5.x

支持 Python2.7,3.4+

经开发团队决定,0.5.x 版本将不再进行维护,0.5.x 版本代码位于 05x 分支,文档位于 05x-docs.pyecharts.org

V1

仅支持 Python3.6+

新版本系列将从 v1.0.0 开始,文档位于 pyecharts.org;示例位于 gallery.pyecharts.org

🔰 安装

pip 安装

# 安装 v1 以上版本
$ pip install pyecharts -U

# 如果需要安装 0.5.11 版本的开发者,可以使用
# pip install pyecharts==0.5.11

源码安装

# 安装 v1 以上版本
$ git clone https://github.com/pyecharts/pyecharts.git
# 如果需要安装 0.5.11 版本,请使用 git clone https://github.com/pyecharts/pyecharts.git -b v05x
$ cd pyecharts
$ pip install -r requirements.txt
$ python setup.py install

📝 使用

本地环境

生成 HTML

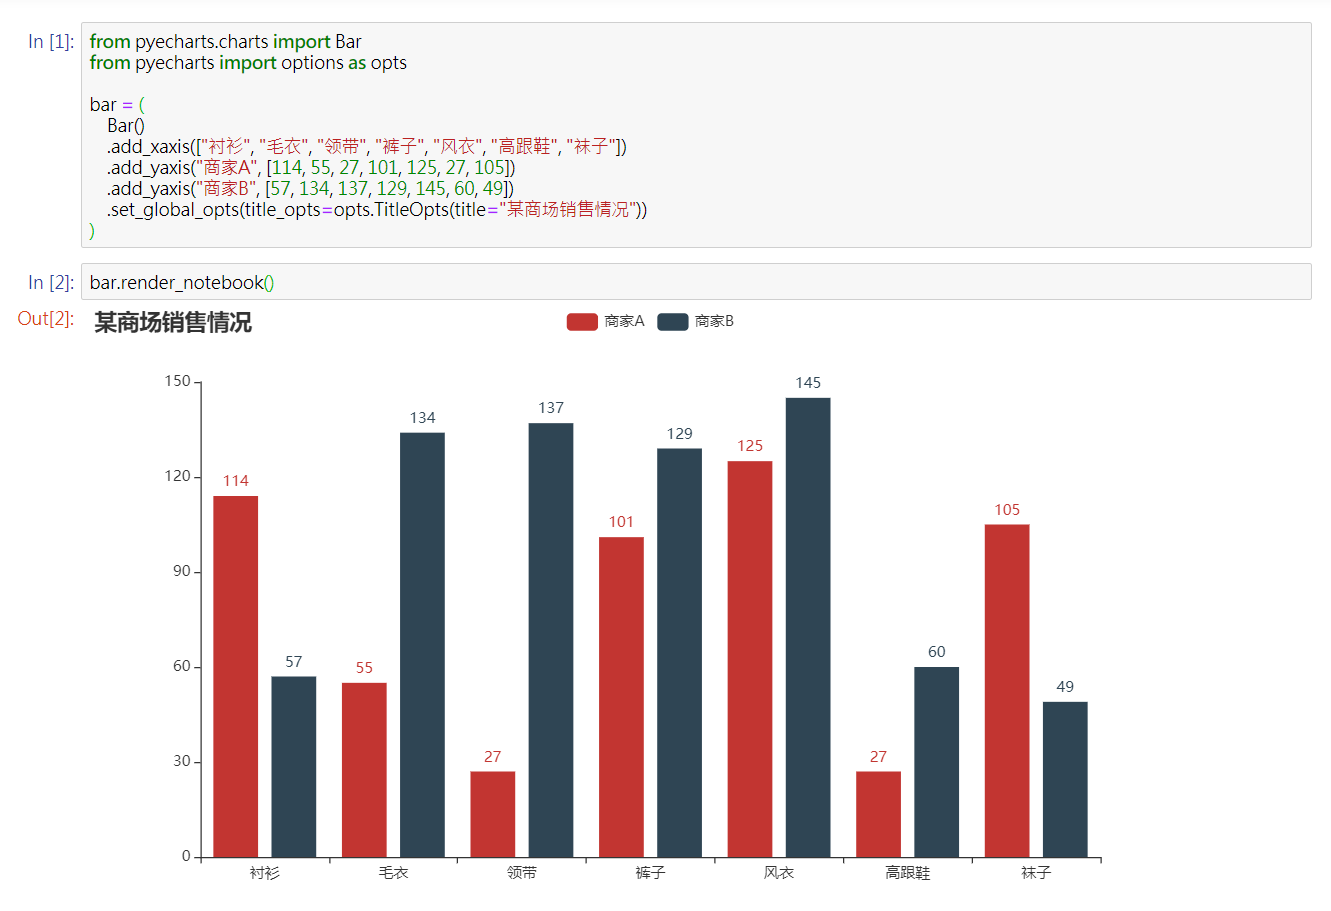
from pyecharts.charts import Bar
from pyecharts import options as opts

# V1 版本开始支持链式调用
bar = (
    Bar()
    .add_xaxis(["衬衫", "毛衣", "领带", "裤子", "风衣", "高跟鞋", "袜子"])
    .add_yaxis("商家A", [114, 55, 27, 101, 125, 27, 105])
    .add_yaxis("商家B", [57, 134, 137, 129, 145, 60, 49])
    .set_global_opts(title_opts=opts.TitleOpts(title="某商场销售情况"))
)
bar.render()

# 不习惯链式调用的开发者依旧可以单独调用方法
bar = Bar()
bar.add_xaxis(["衬衫", "毛衣", "领带", "裤子", "风衣", "高跟鞋", "袜子"])
bar.add_yaxis("商家A", [114, 55, 27, 101, 125, 27, 105])
bar.add_yaxis("商家B", [57, 134, 137, 129, 145, 60, 49])
bar.set_global_opts(title_opts=opts.TitleOpts(title="某商场销售情况"))
bar.render()

生成图片

from snapshot_selenium import snapshot as driver

from pyecharts import options as opts
from pyecharts.charts import Bar
from pyecharts.render import make_snapshot


def bar_chart() -> Bar:
    c = (
        Bar()
        .add_xaxis(["衬衫", "毛衣", "领带", "裤子", "风衣", "高跟鞋", "袜子"])
        .add_yaxis("商家A", [114, 55, 27, 101, 125, 27, 105])
        .add_yaxis("商家B", [57, 134, 137, 129, 145, 60, 49])
        .reversal_axis()
        .set_series_opts(label_opts=opts.LabelOpts(position="right"))
        .set_global_opts(title_opts=opts.TitleOpts(title="Bar-测试渲染图片"))
    )
    return c

# 需要安装 snapshot-selenium 或者 snapshot-phantomjs
make_snapshot(driver, bar_chart().render(), "bar.png")

Notebook 环境

Jupyter Notebook

JupyterLab

Web 框架

🔖 Demo

Demo 代码位于 example 文件夹下,欢迎参考 pyecharts 画廊 pyecharts-gallery

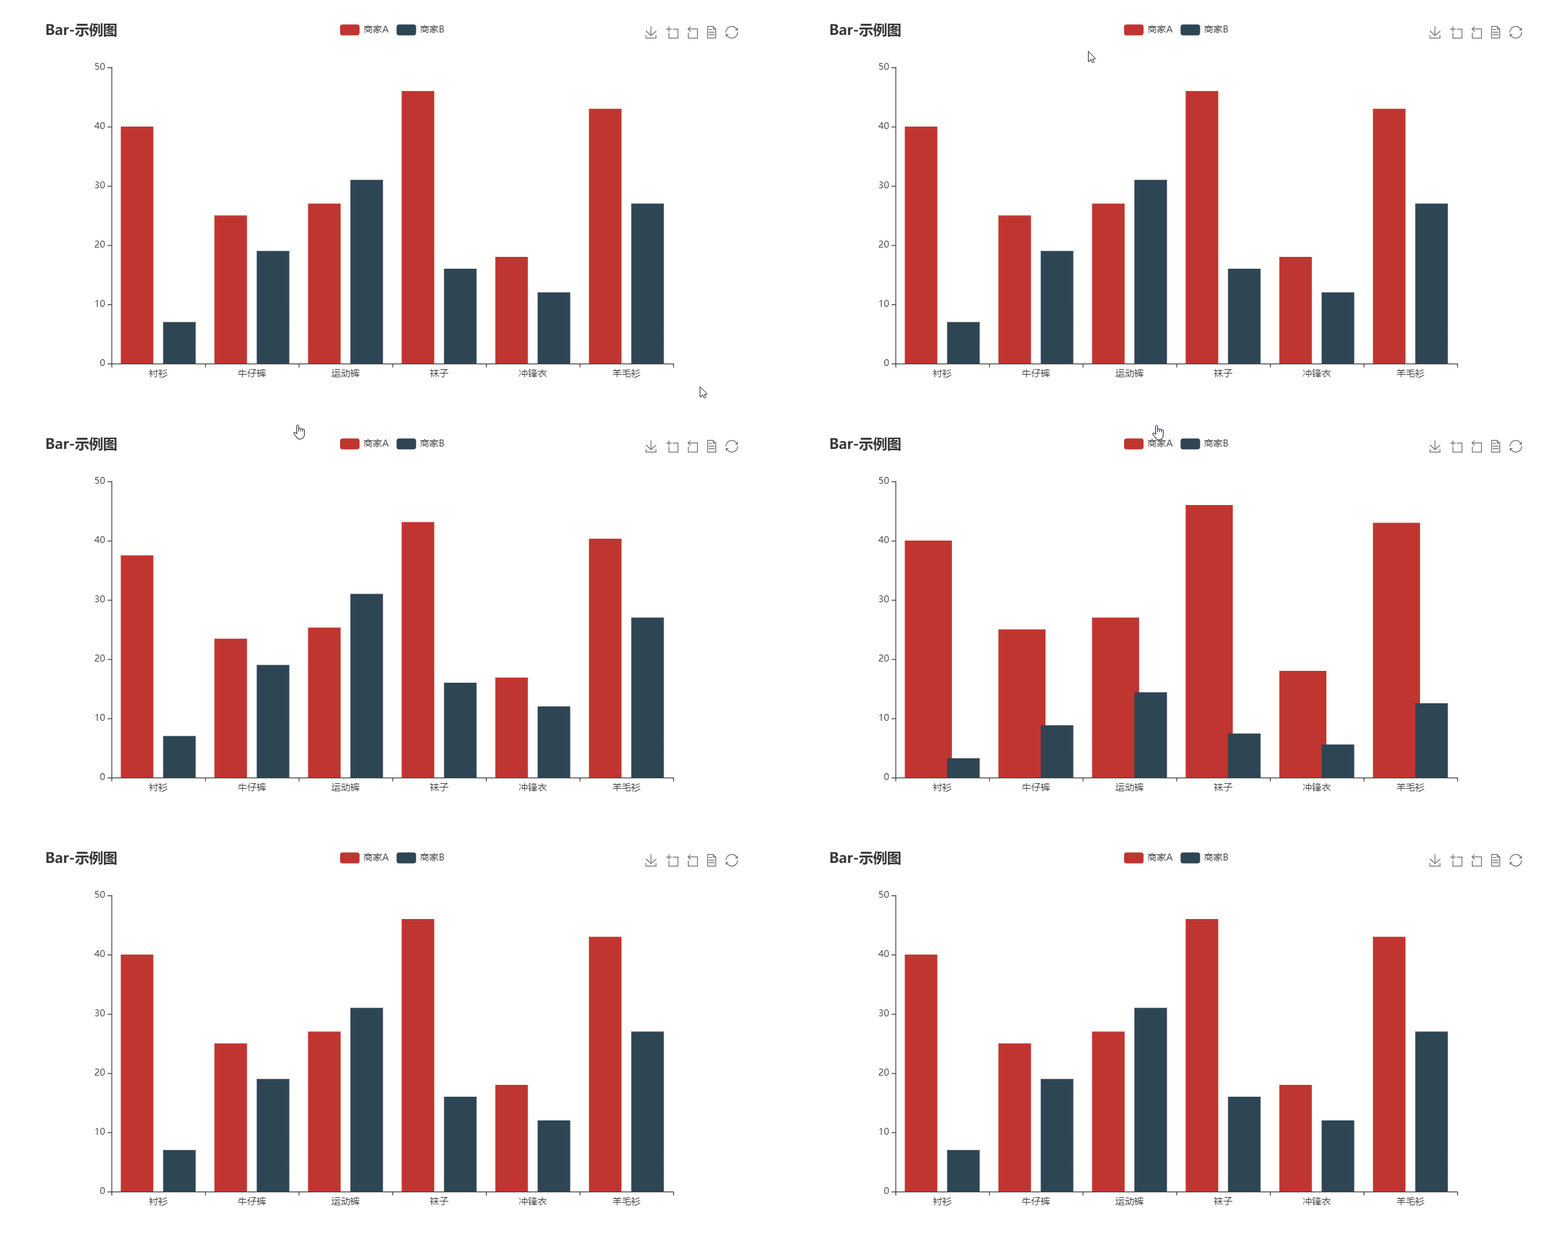
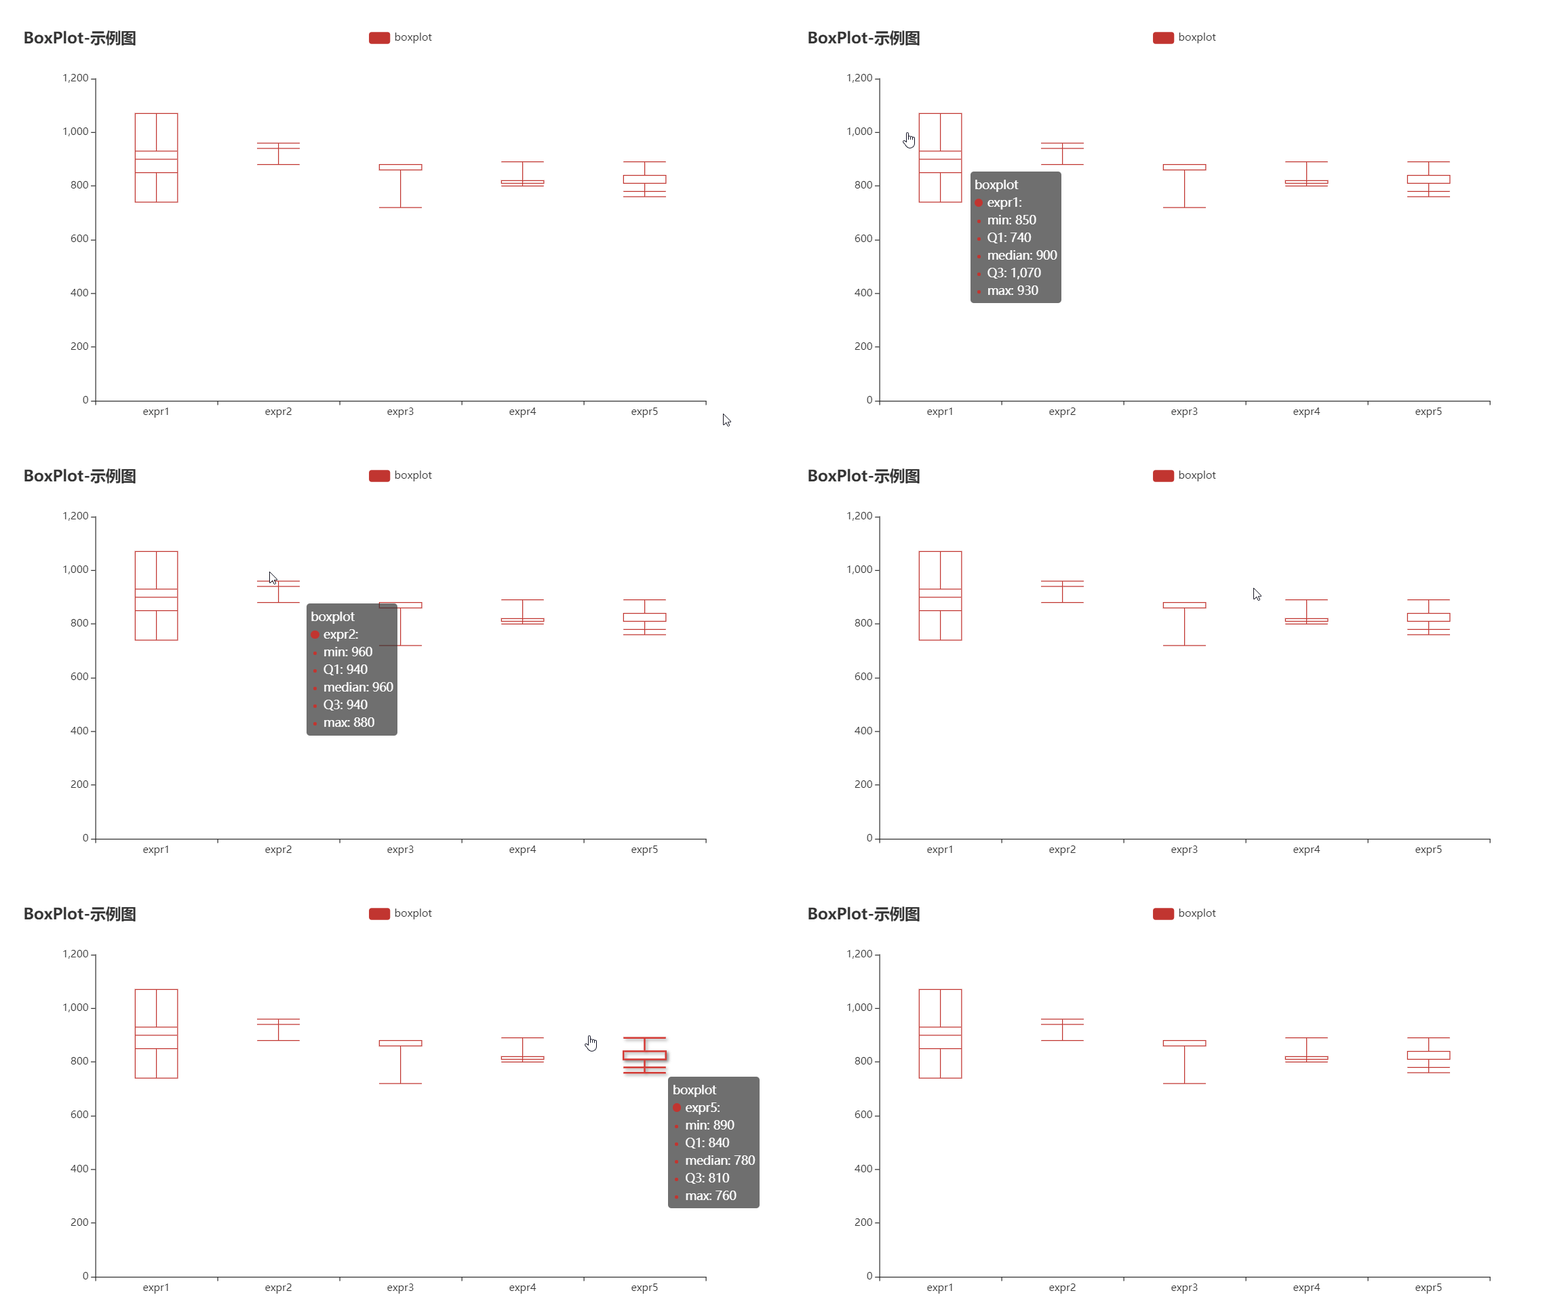
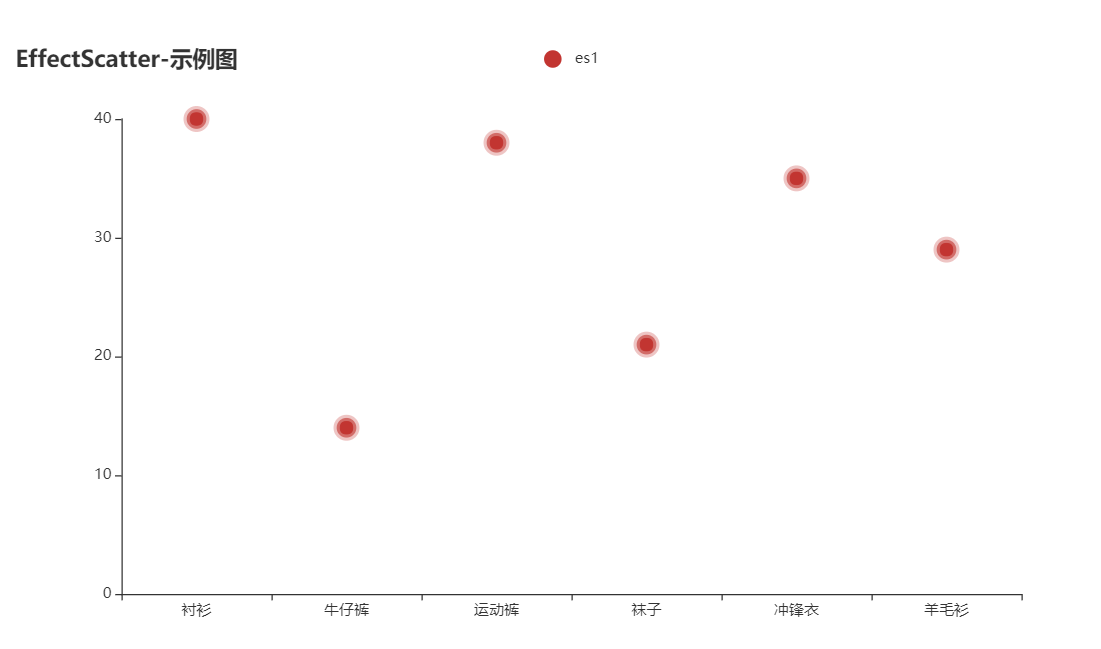
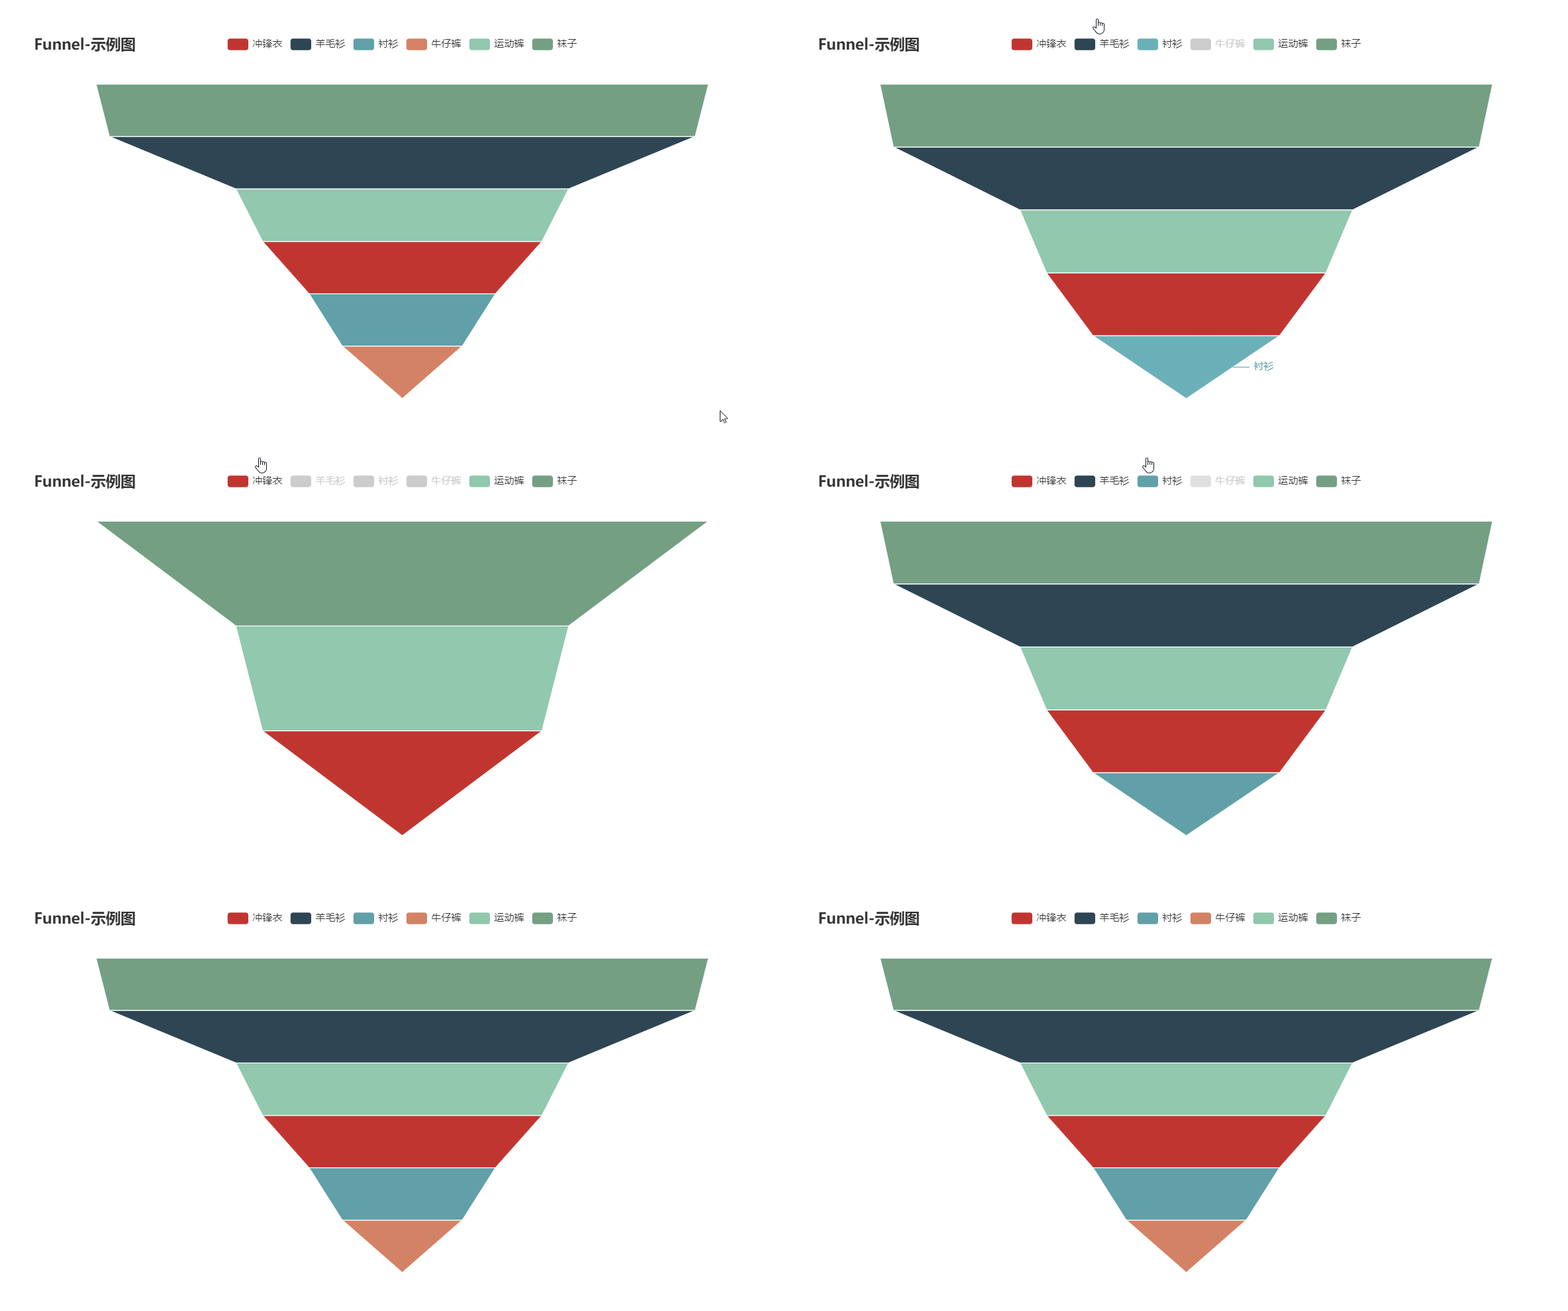
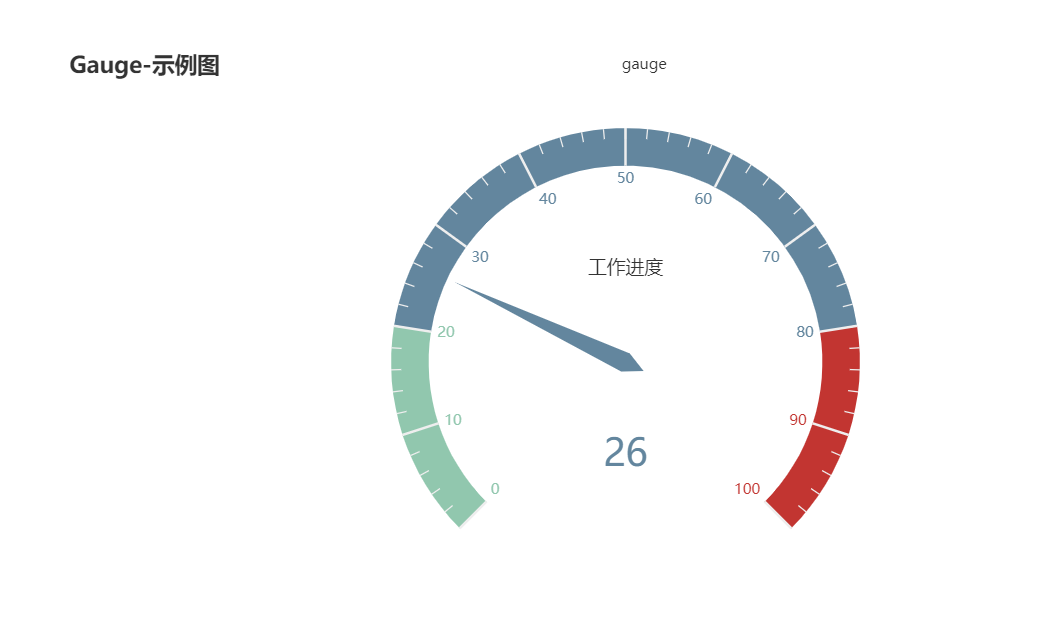
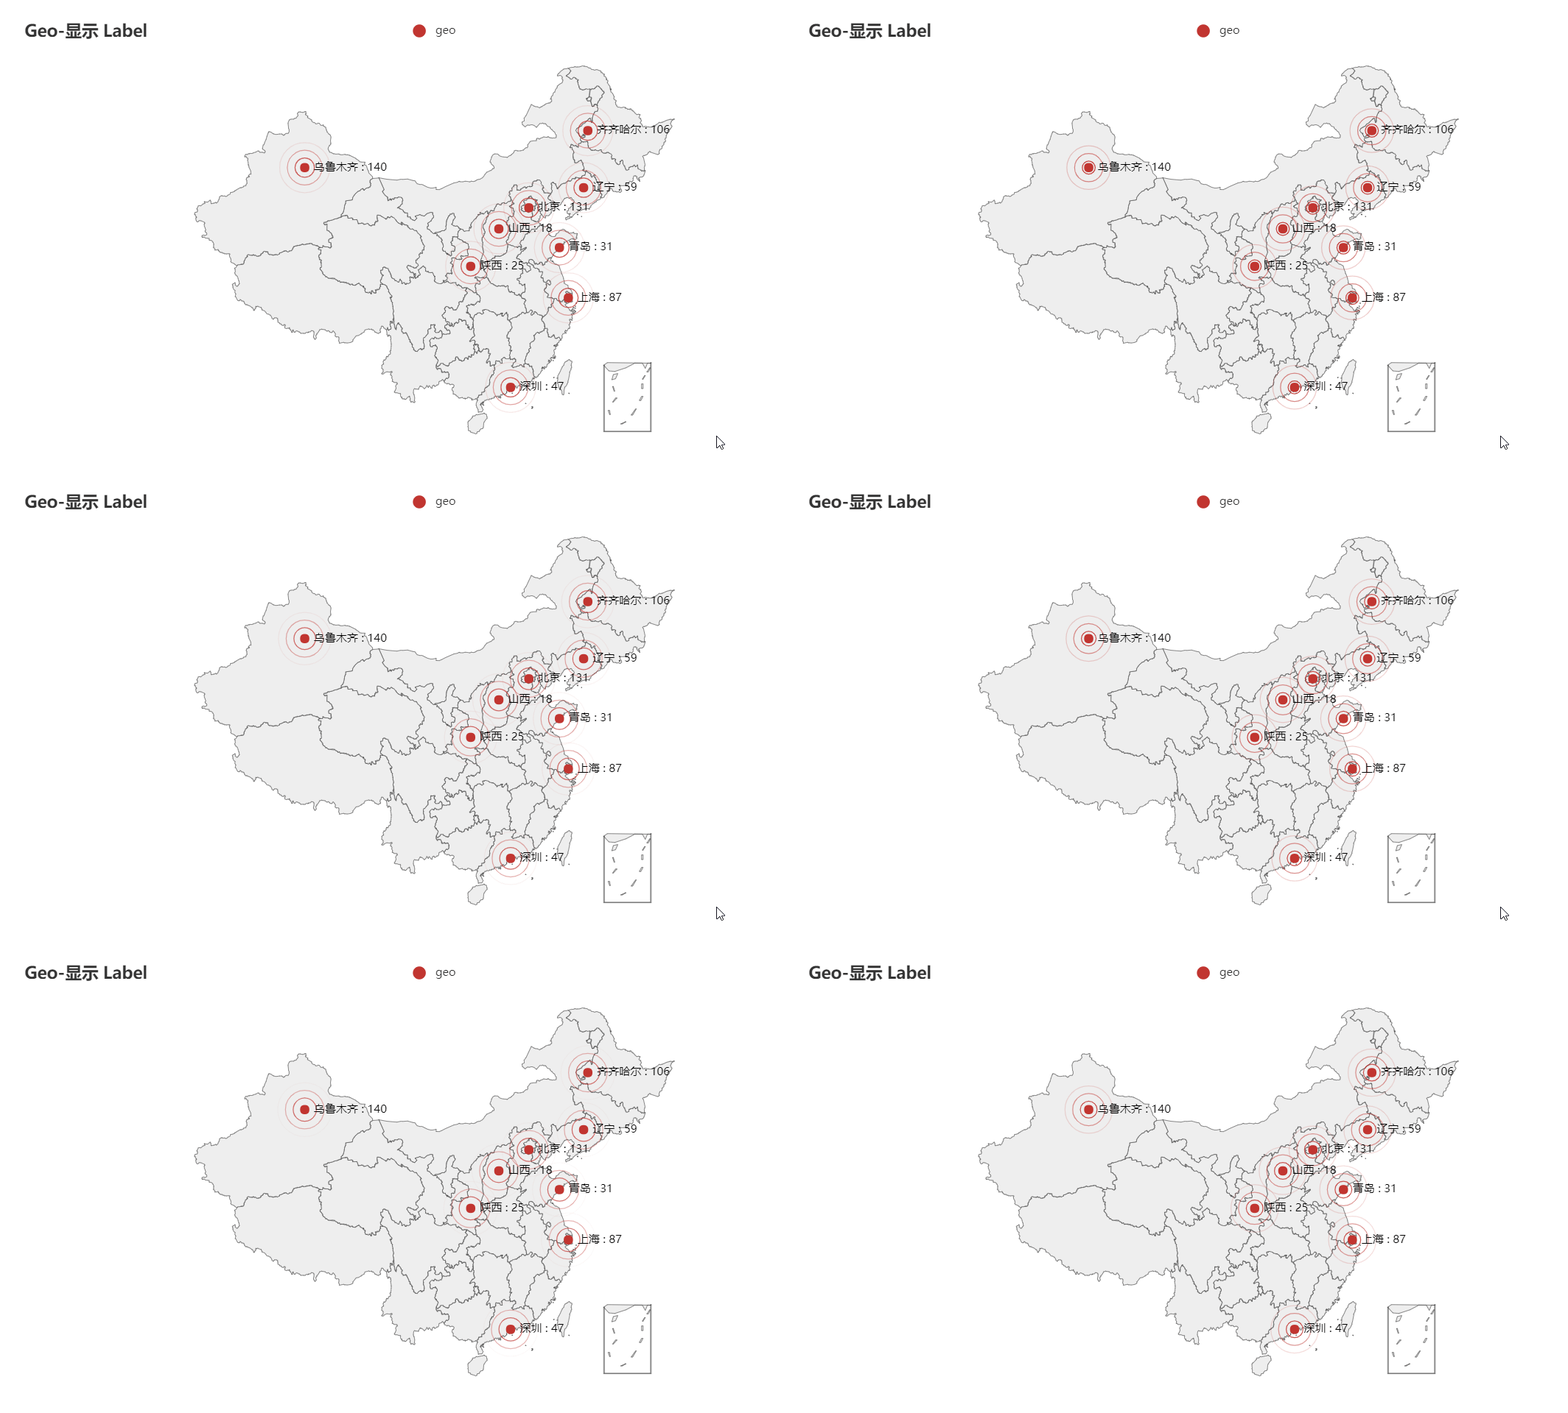
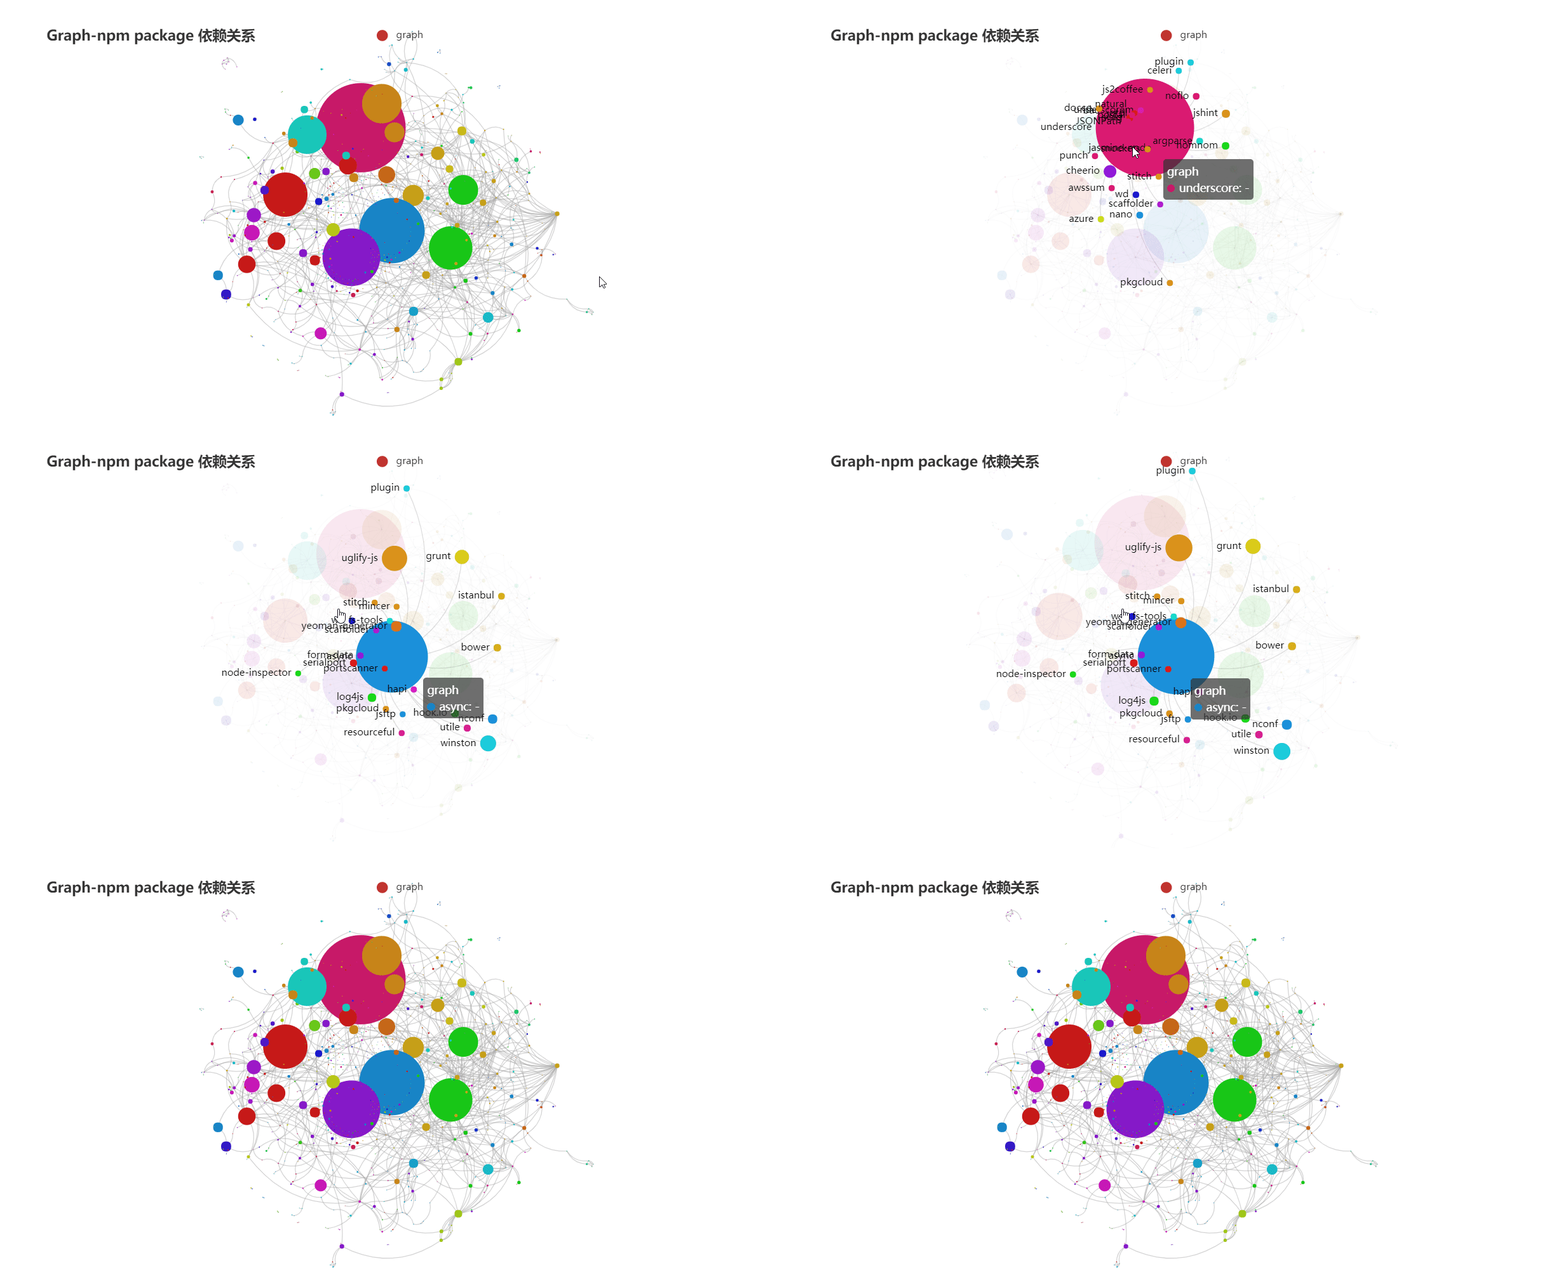
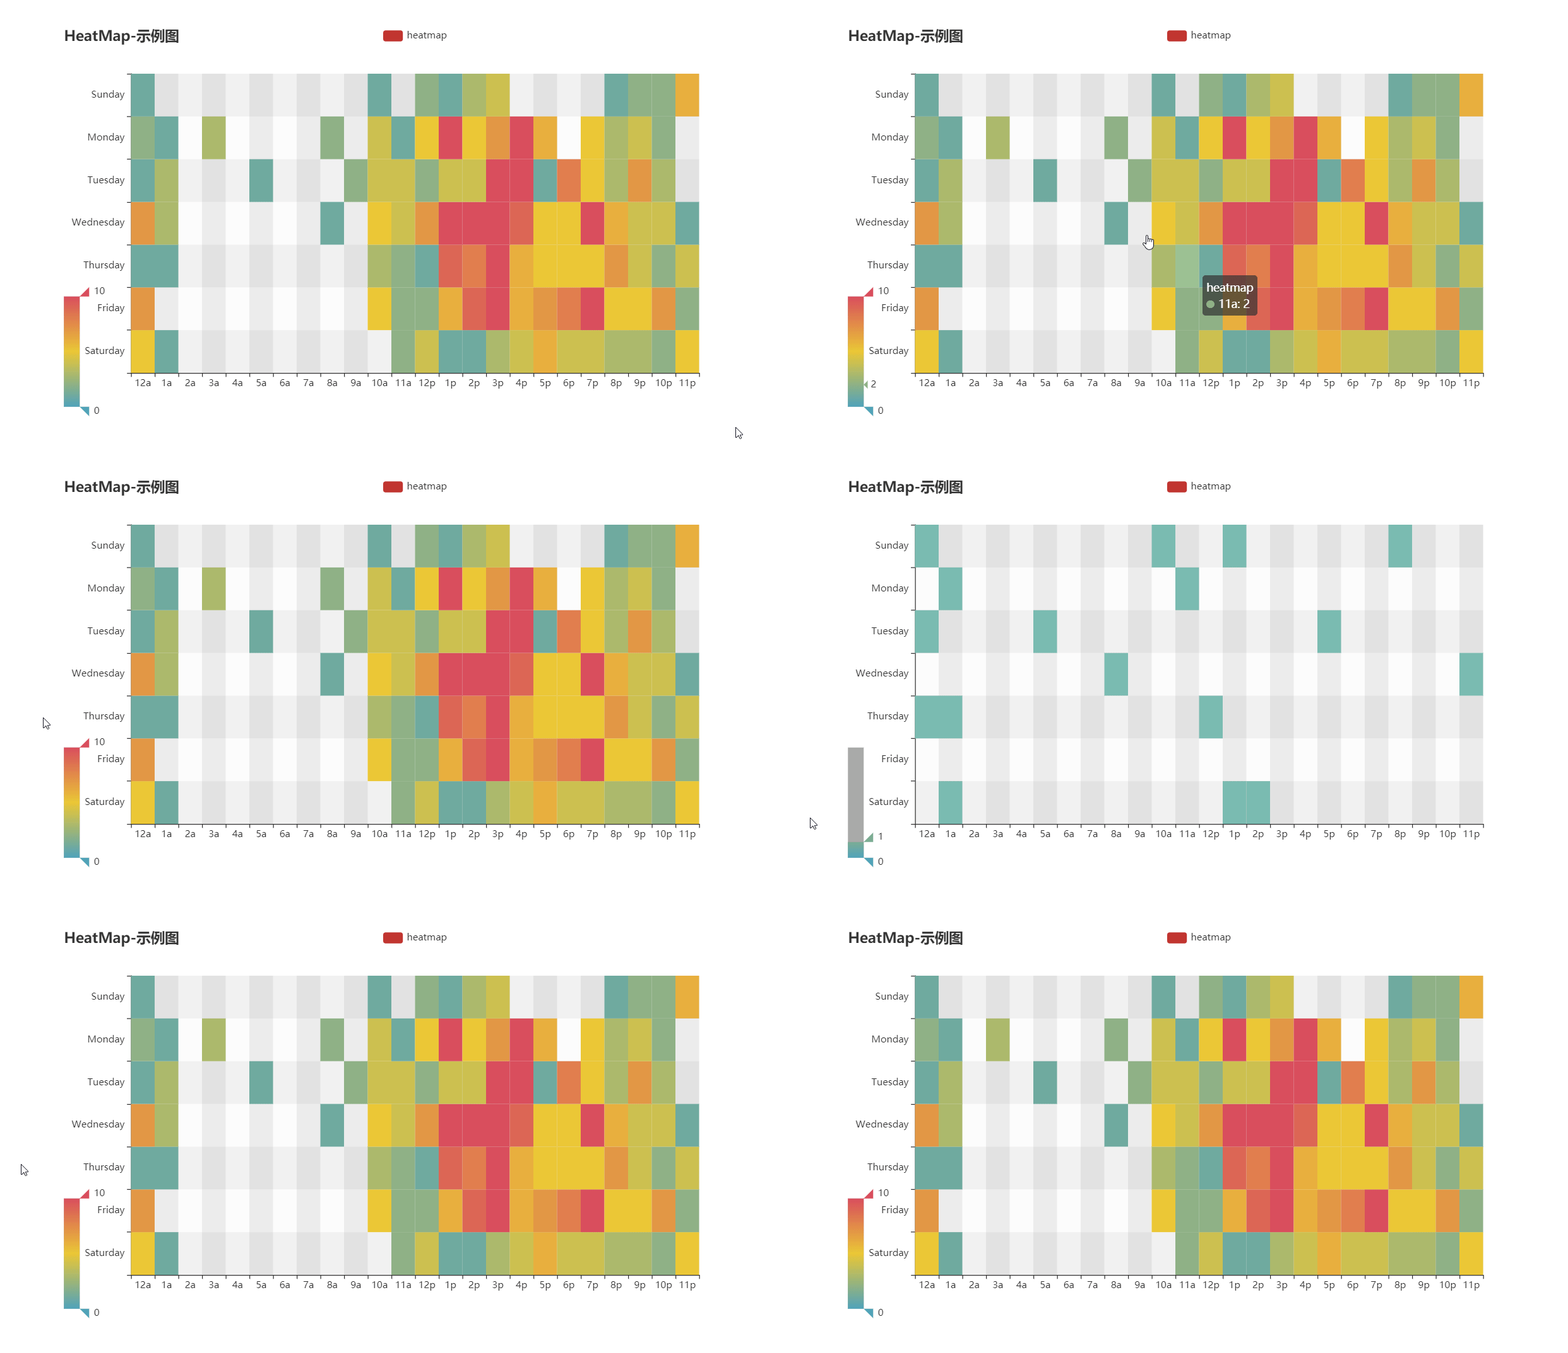
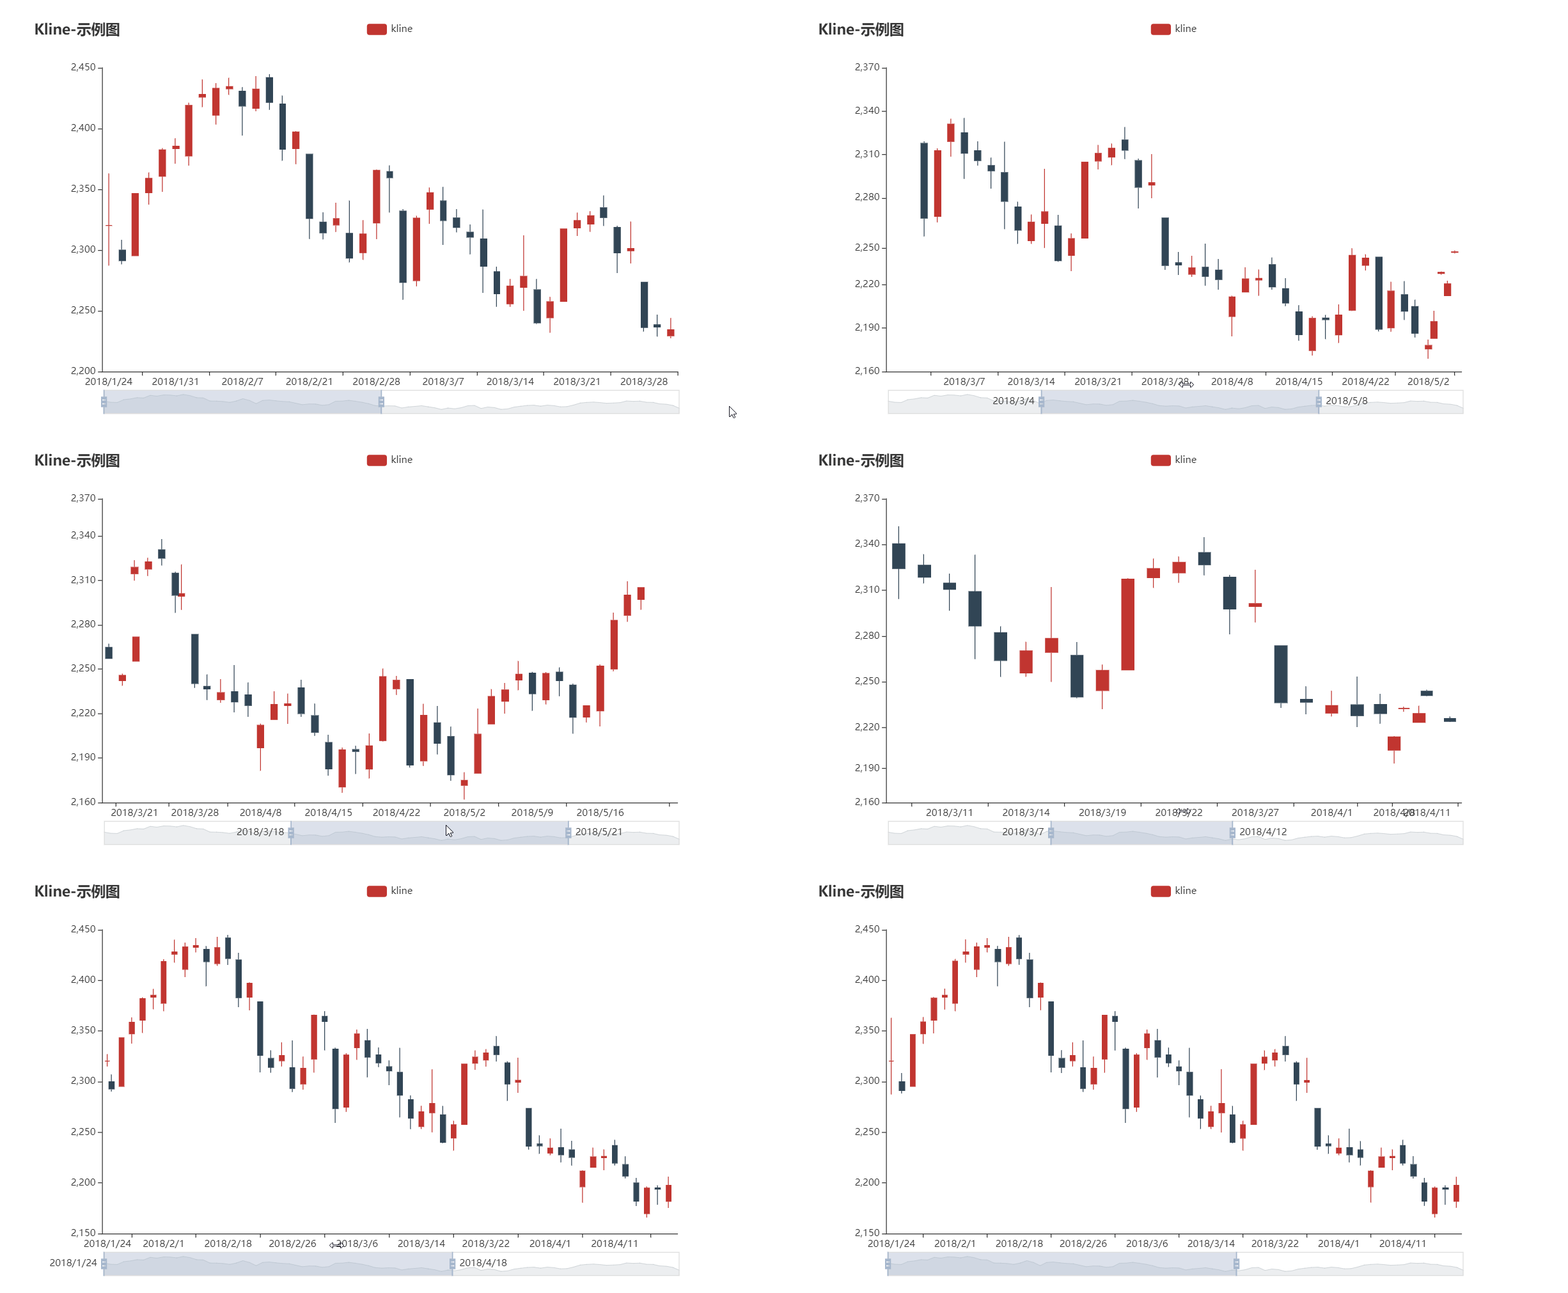
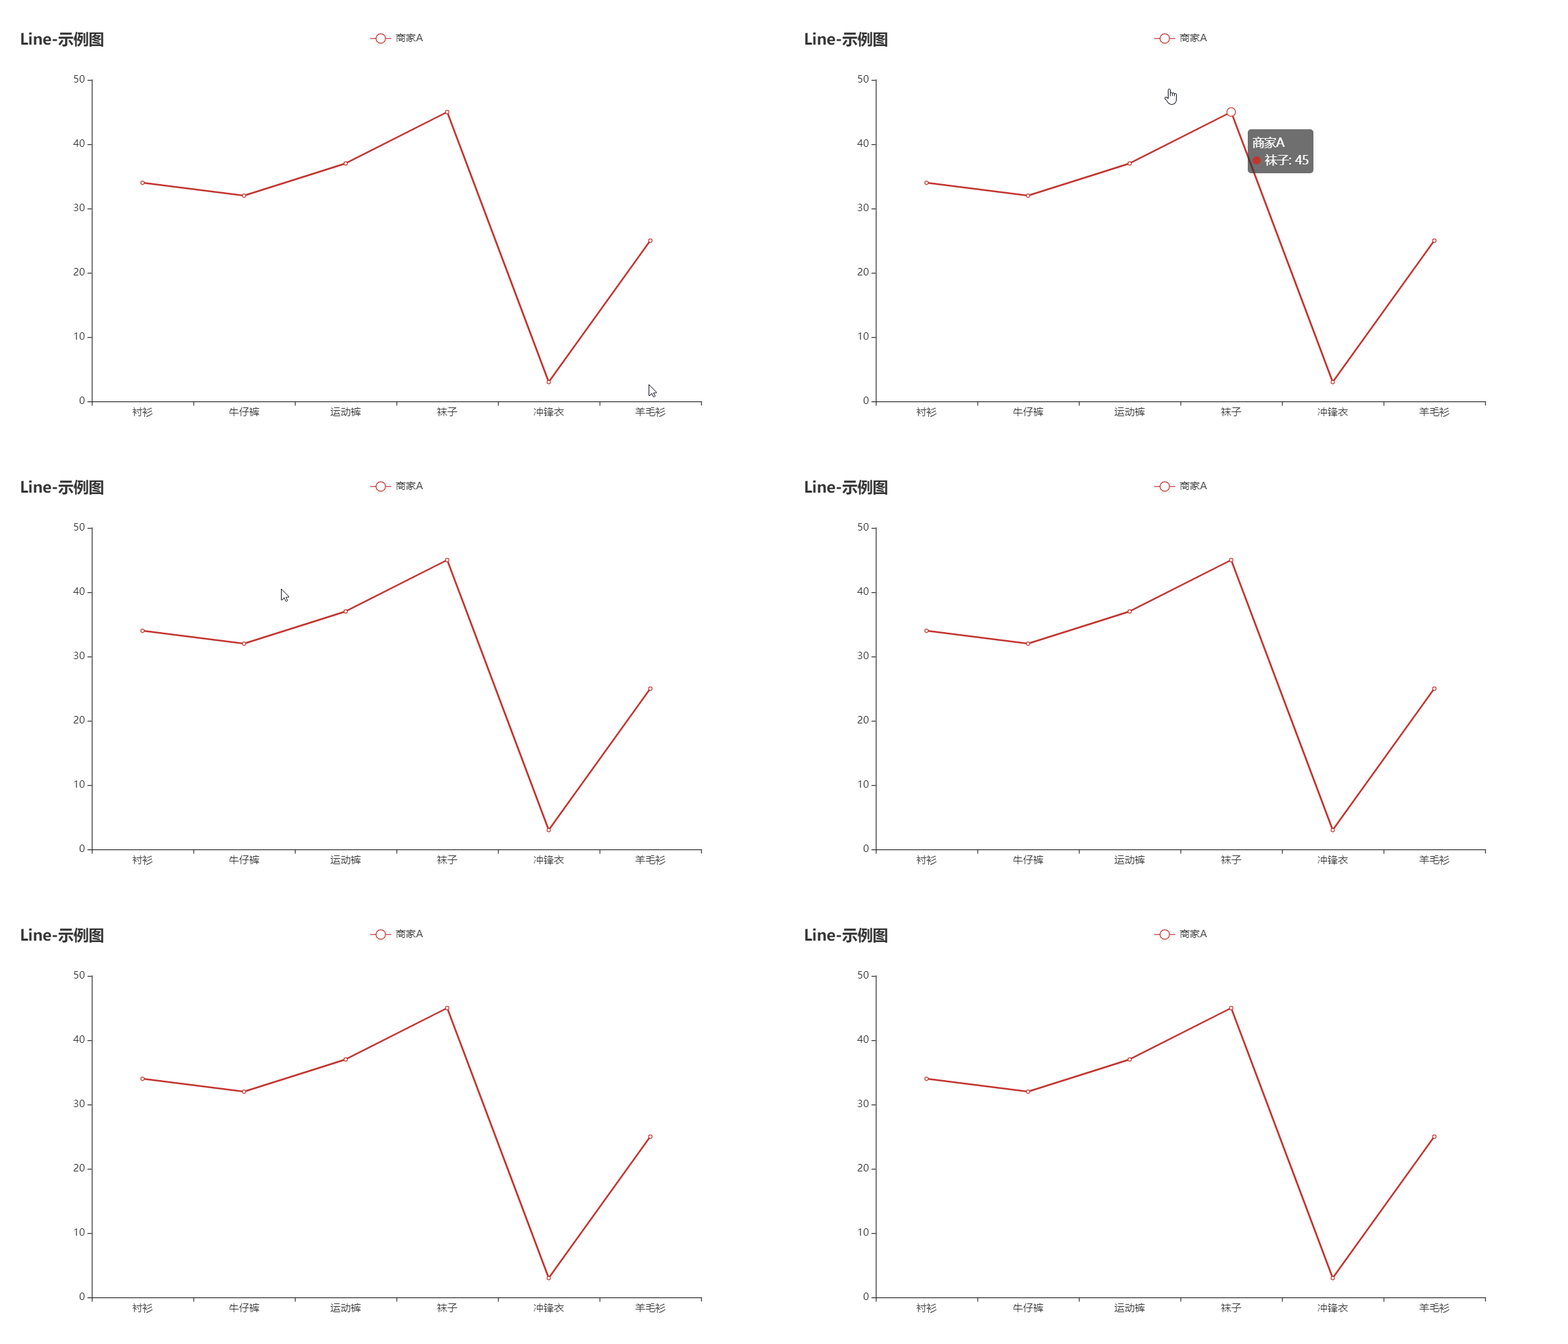
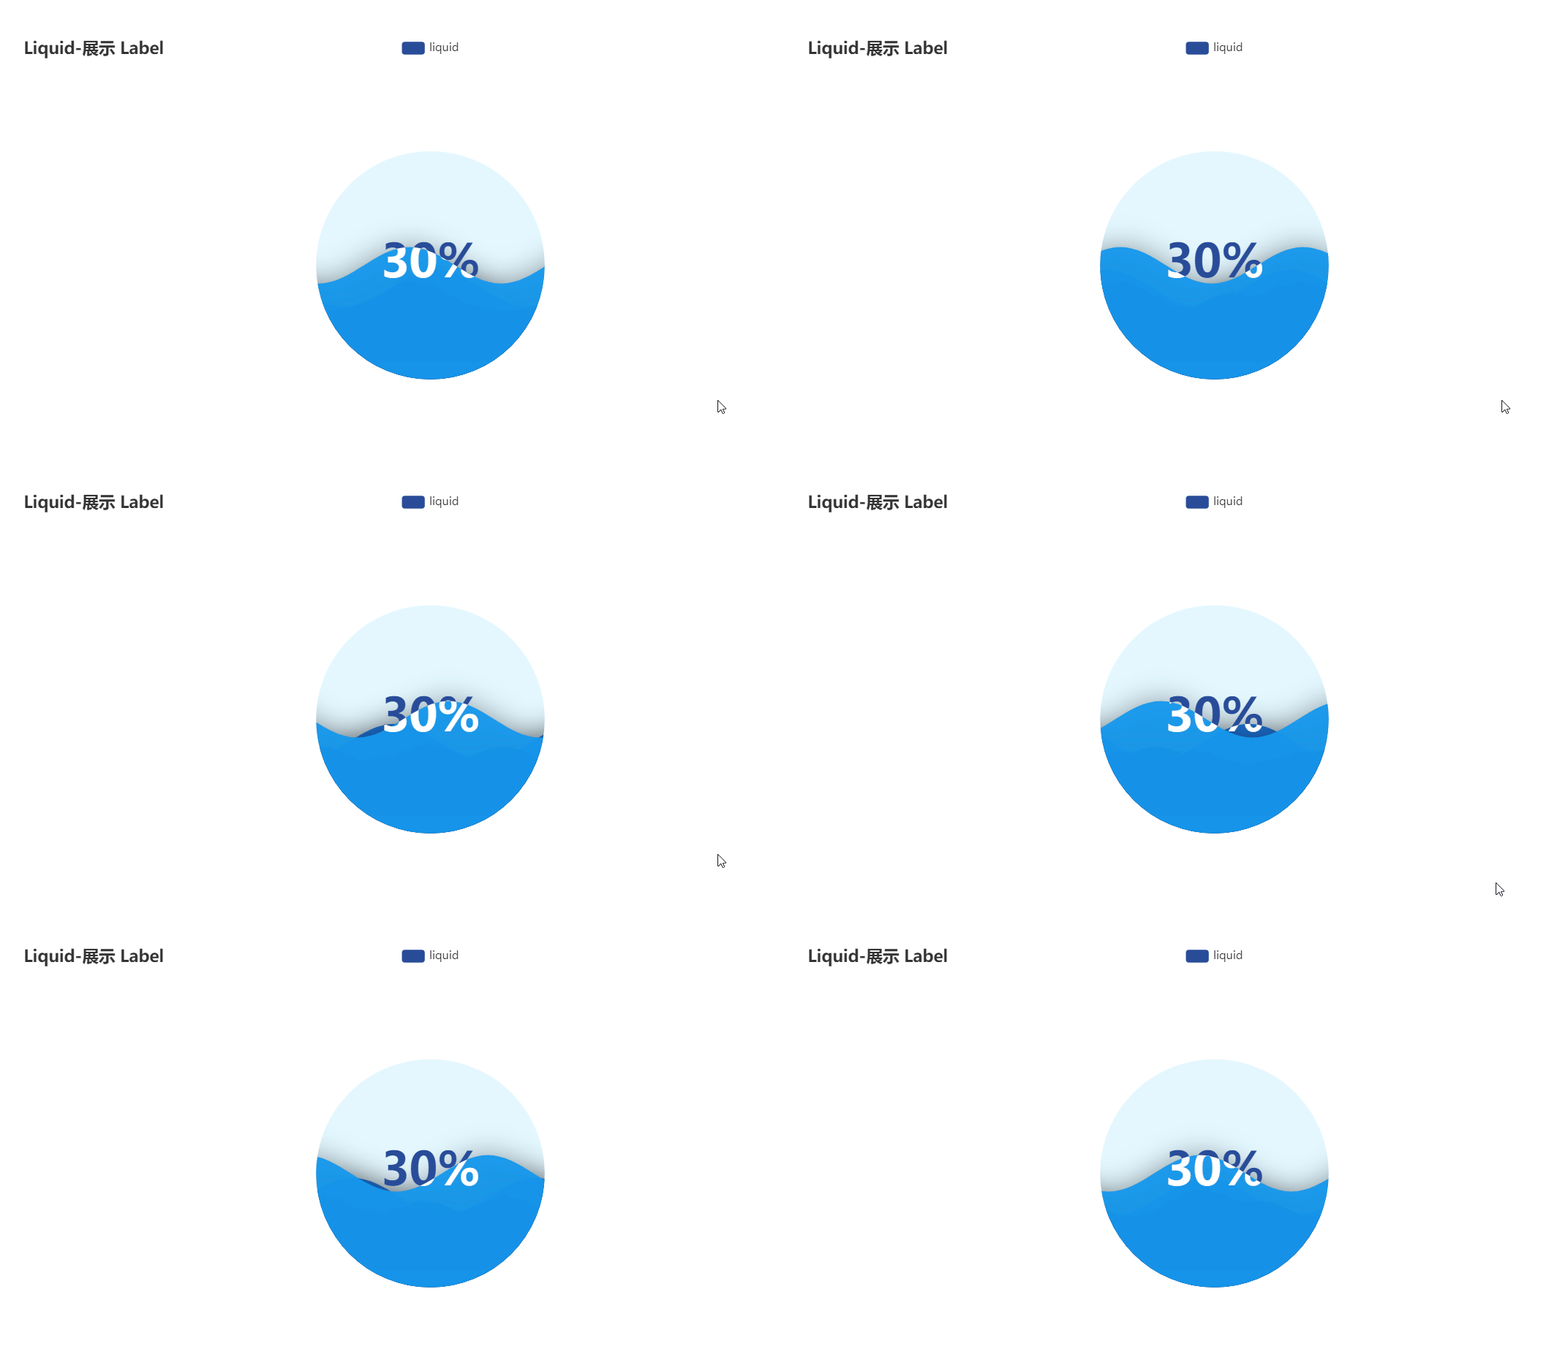
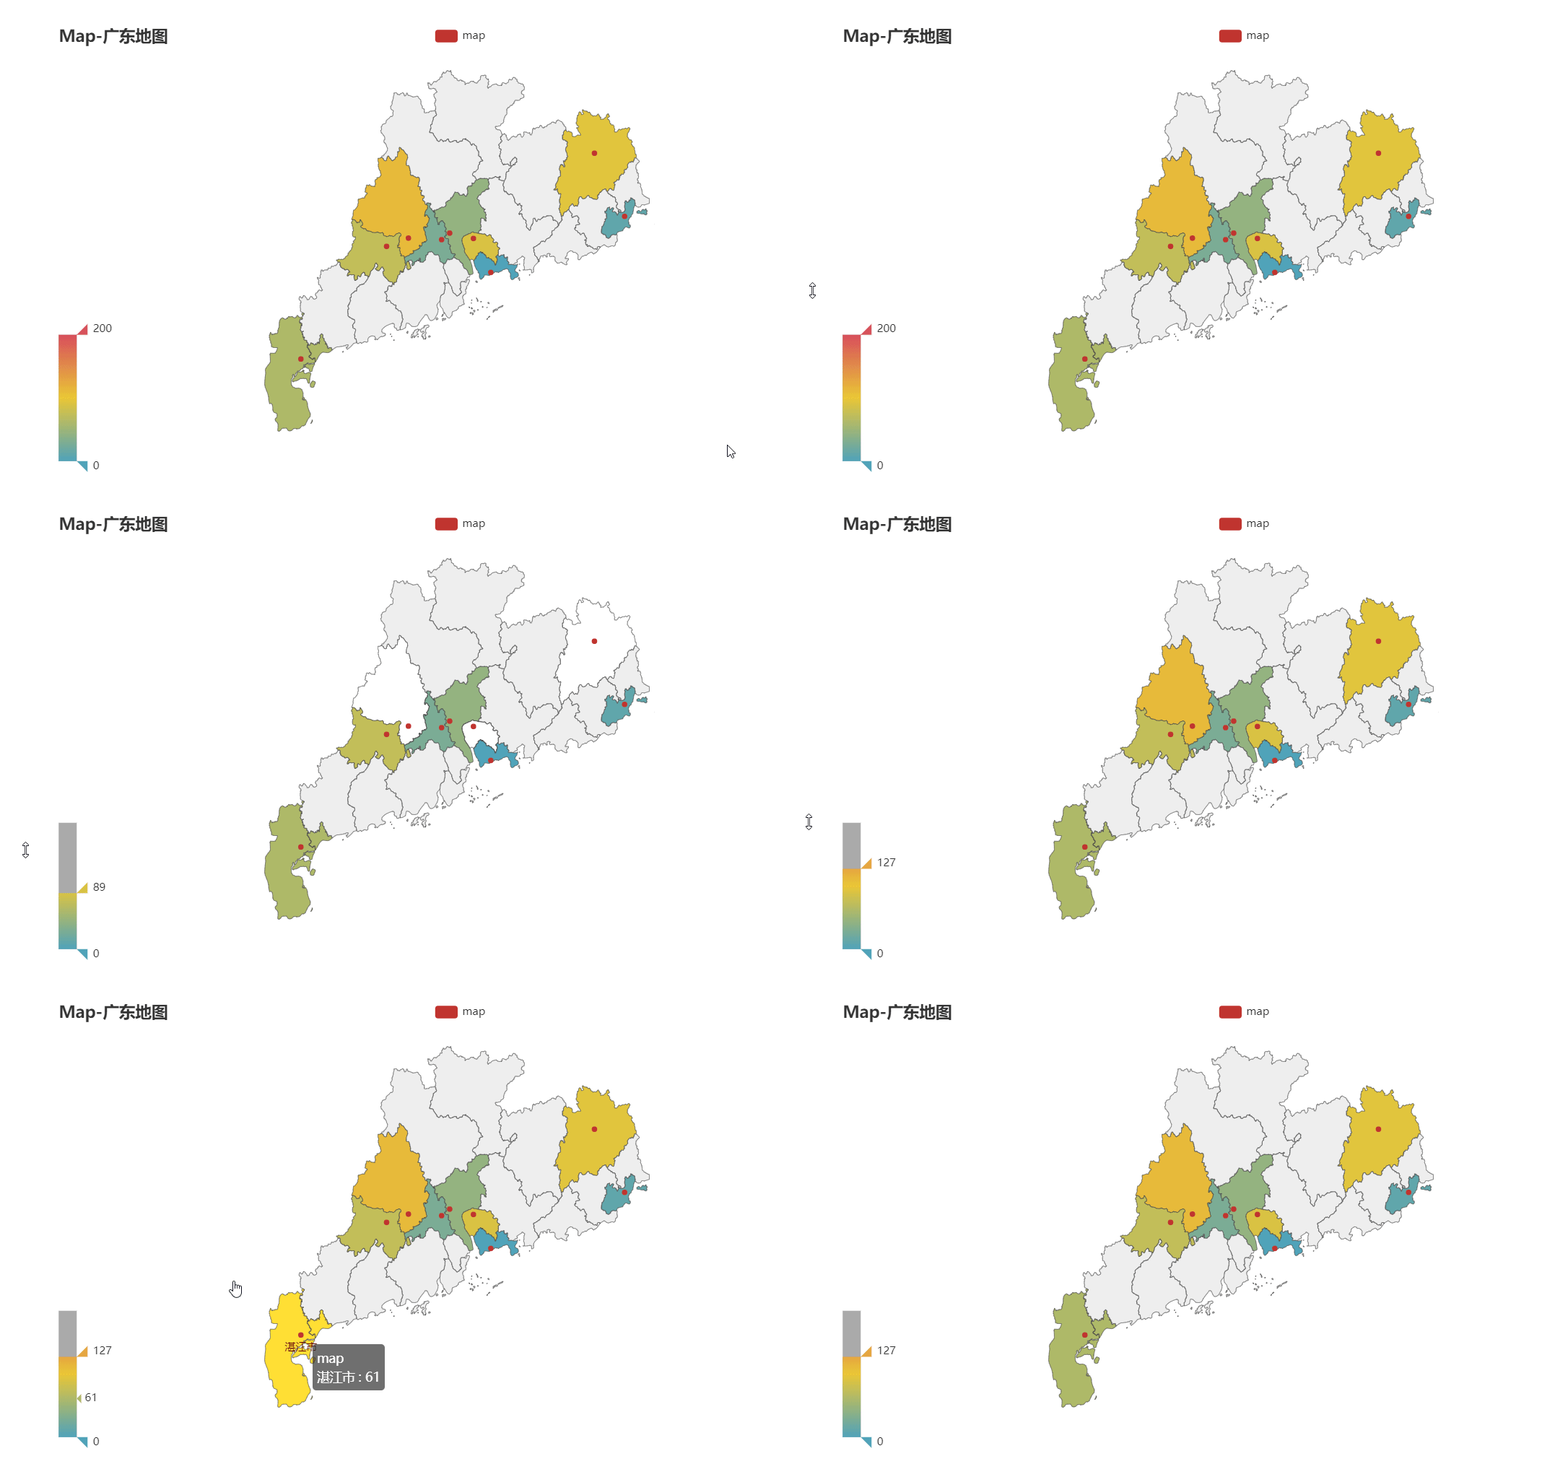
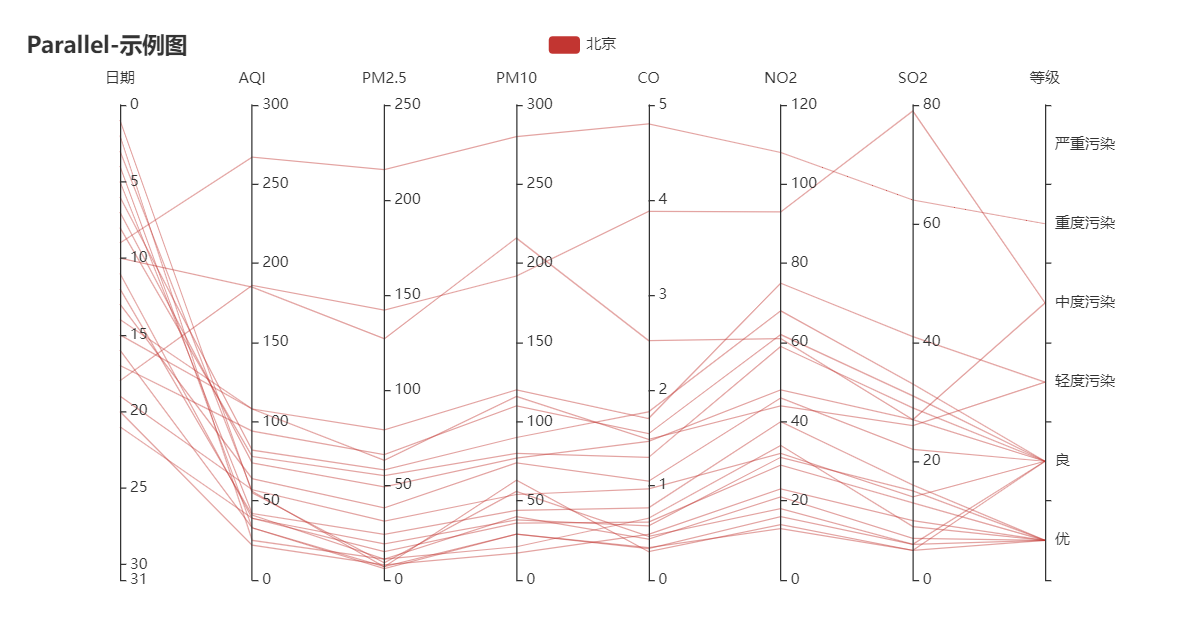
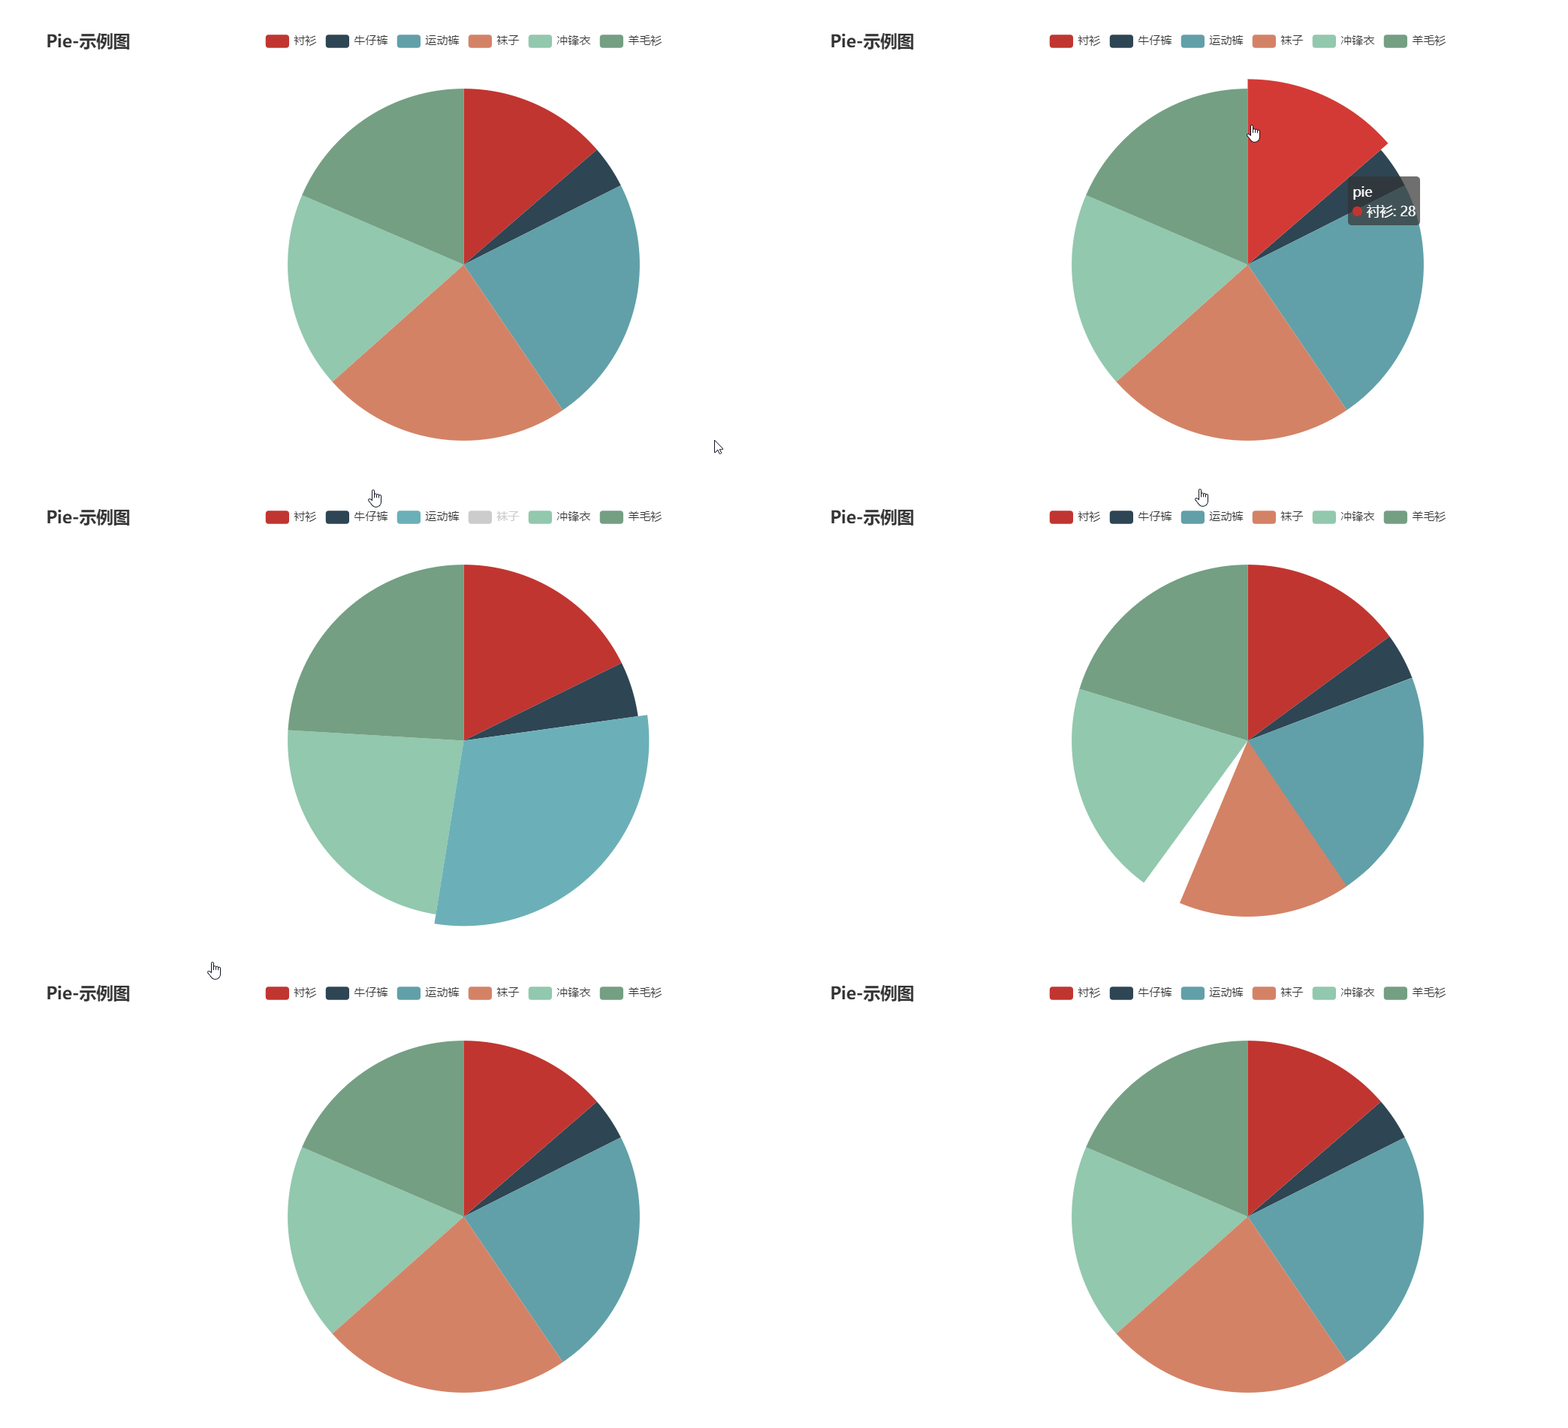
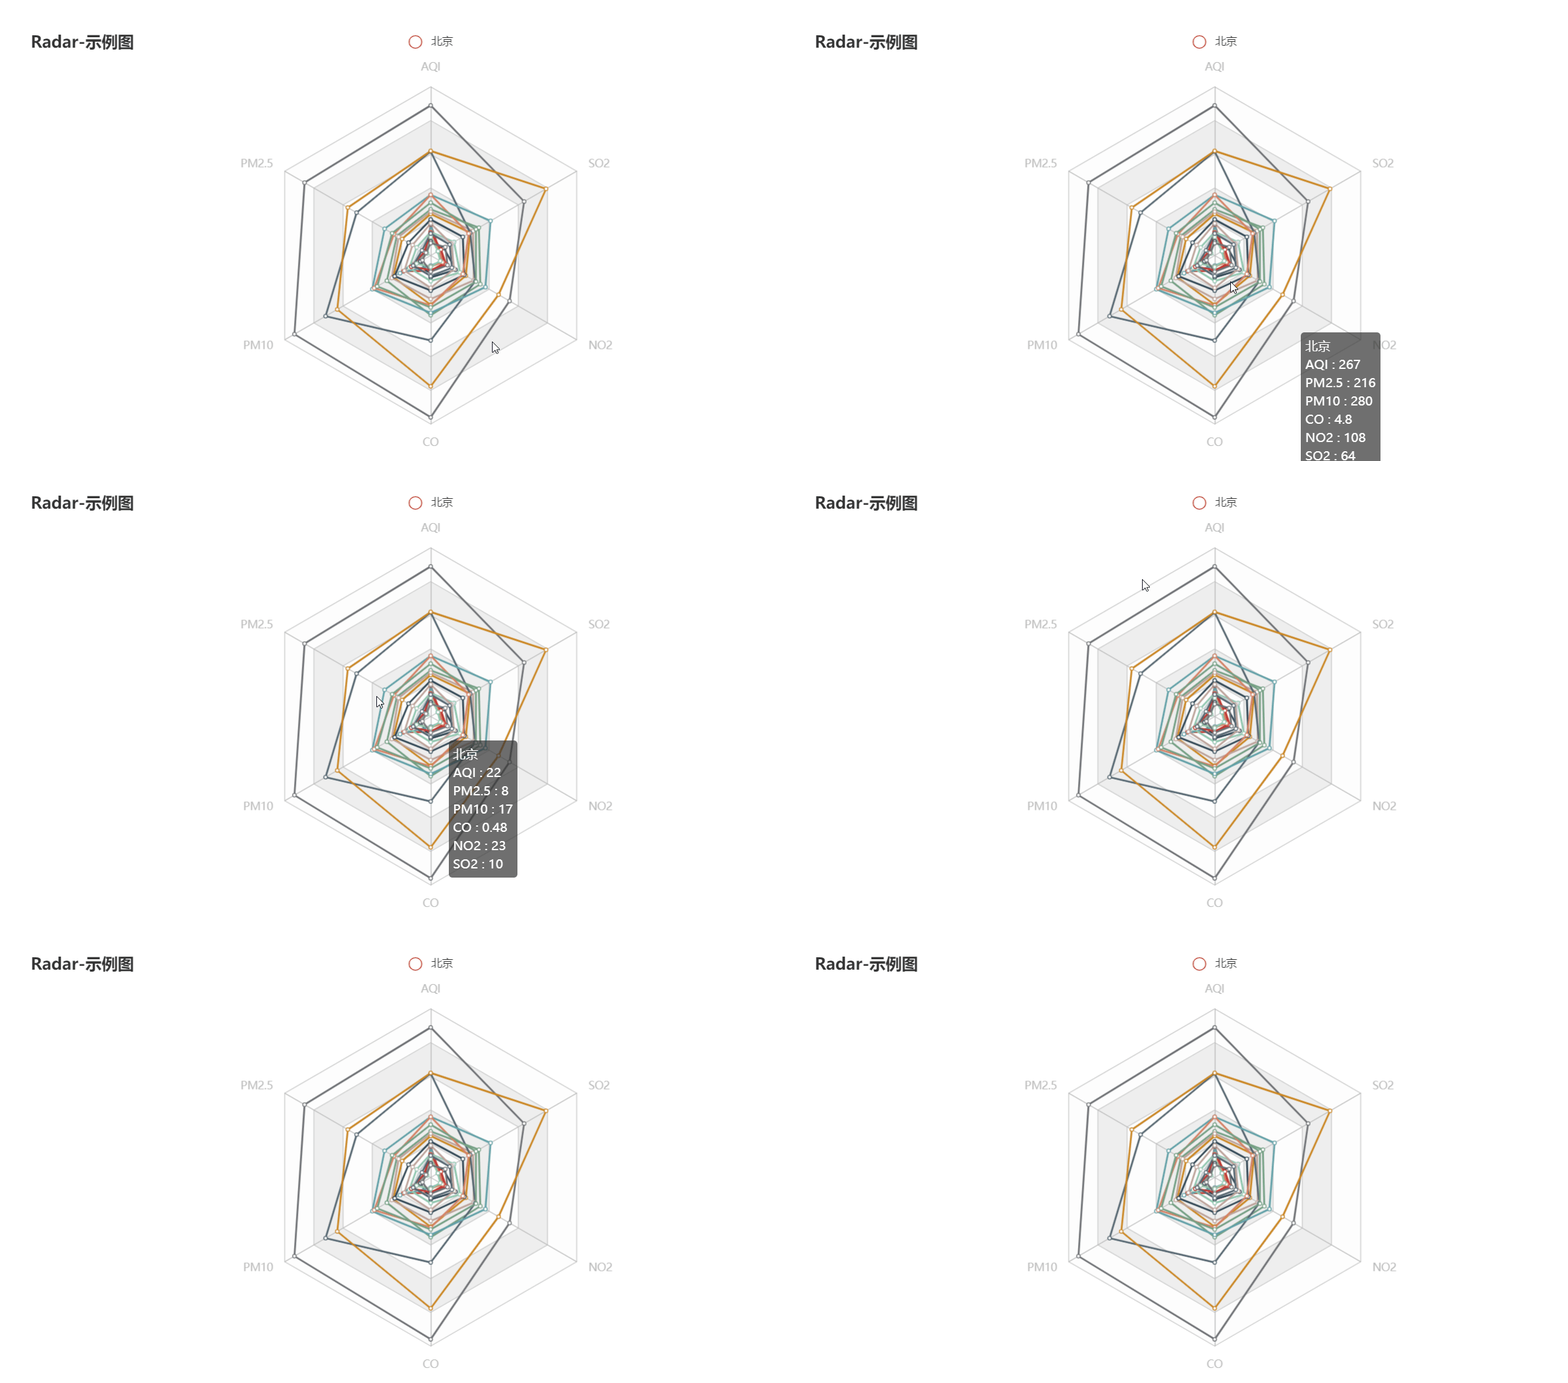
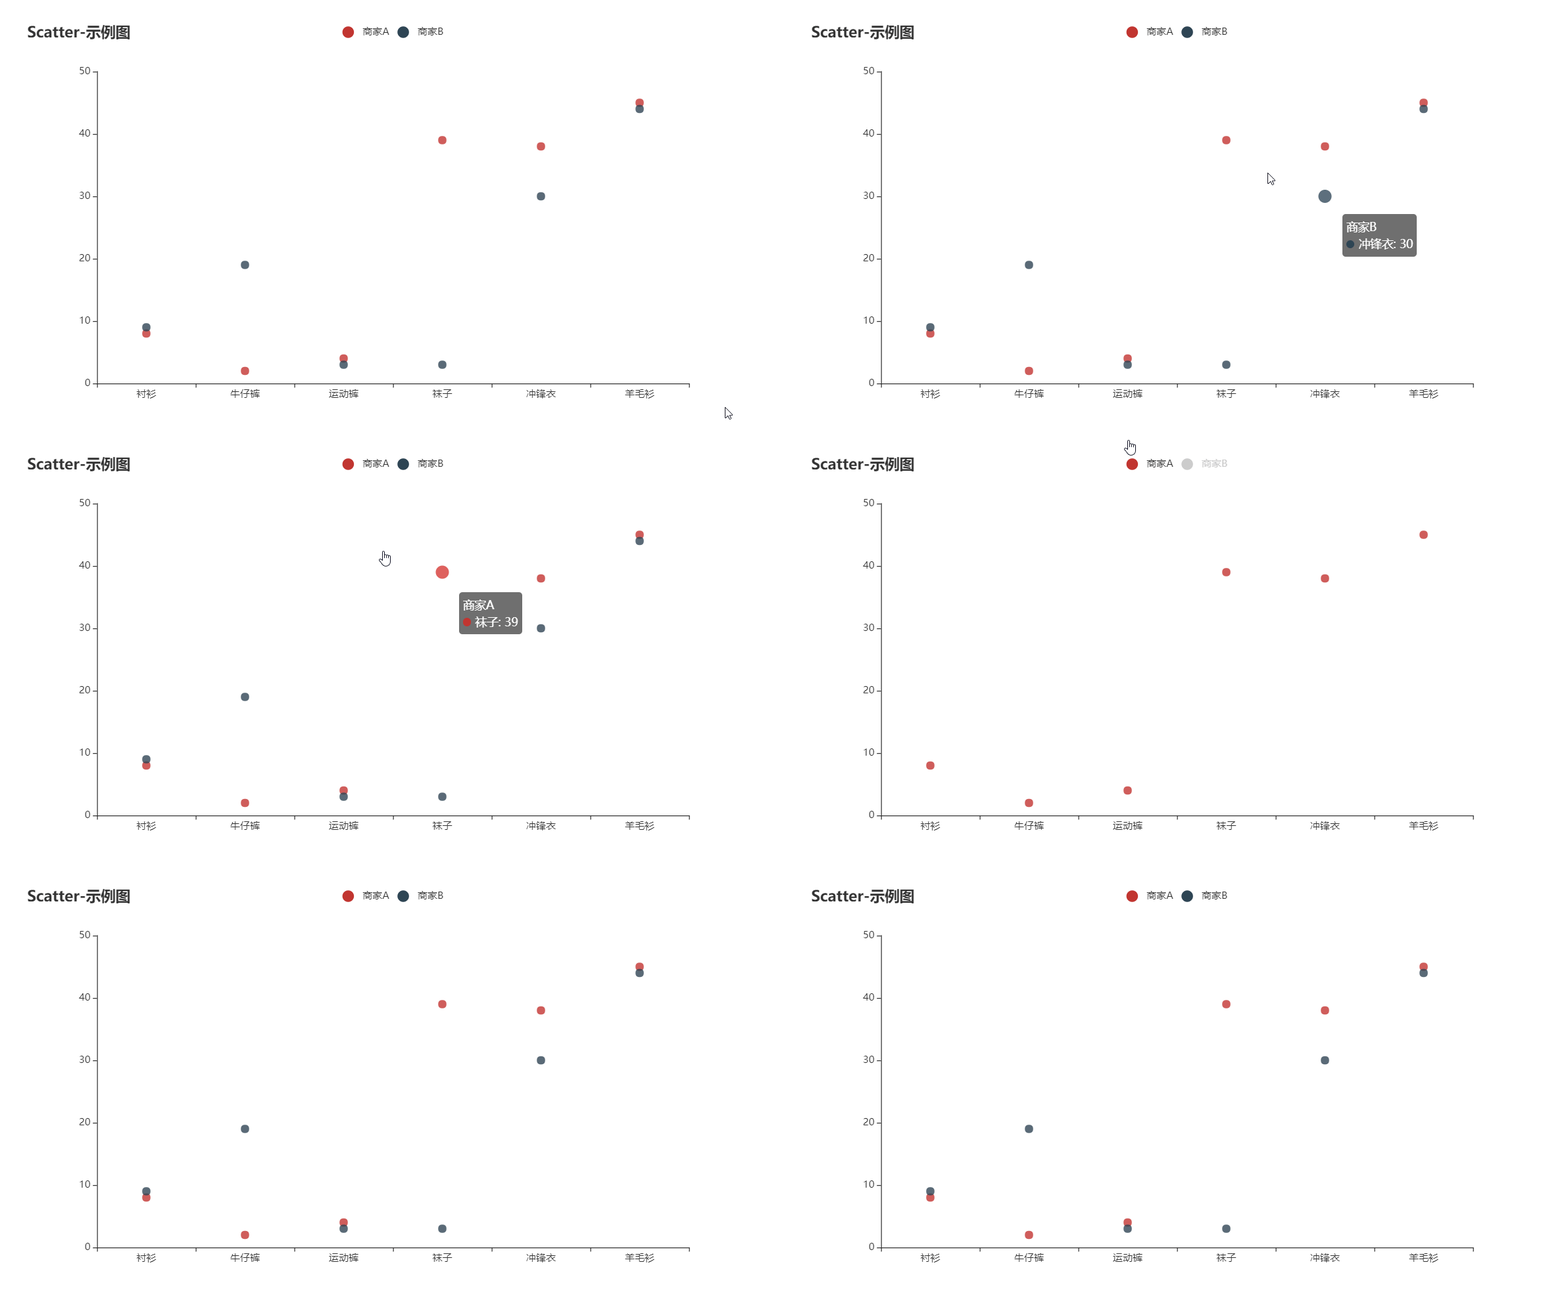
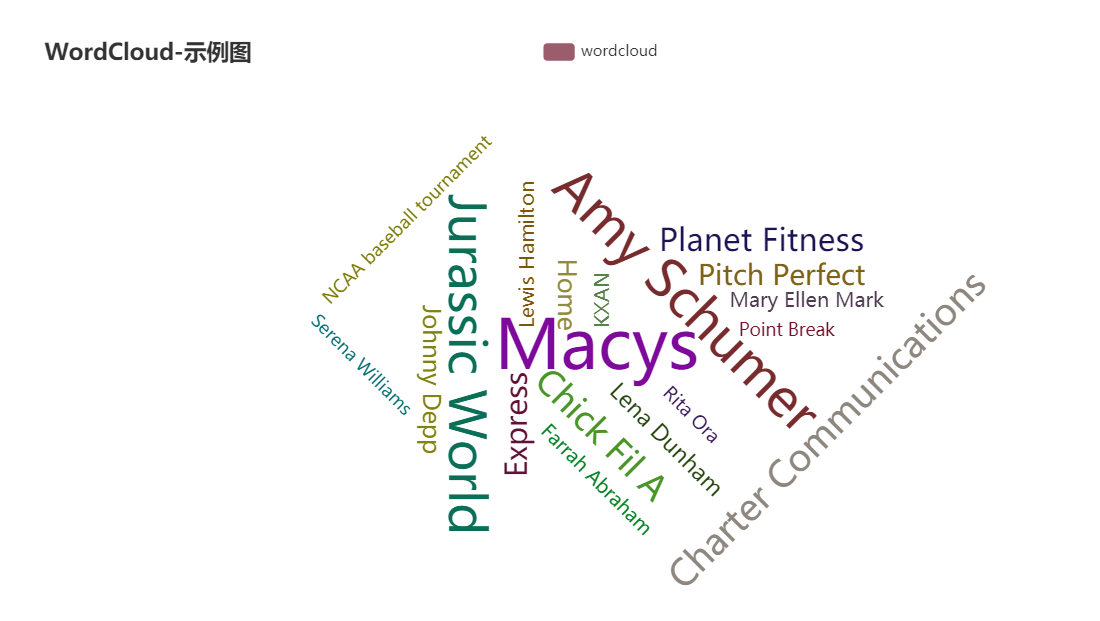
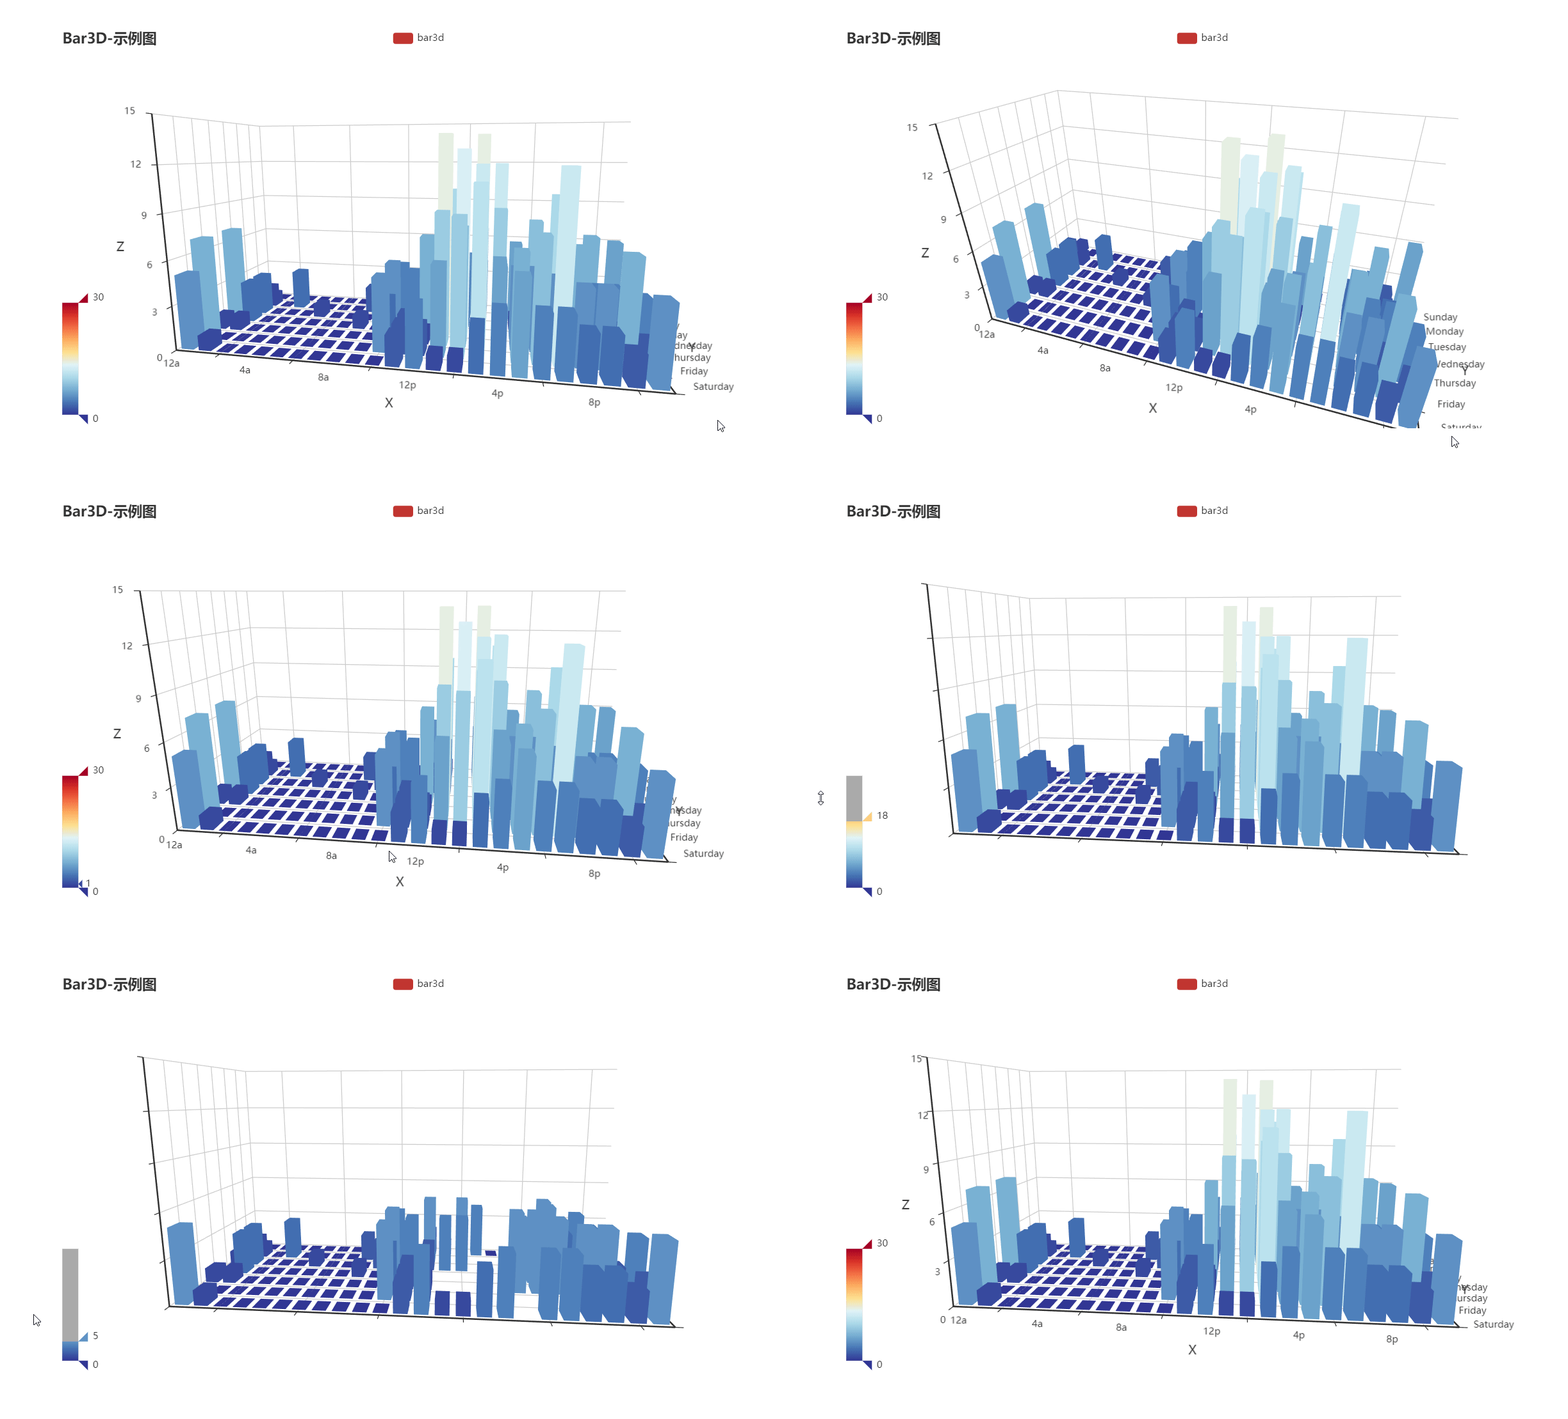
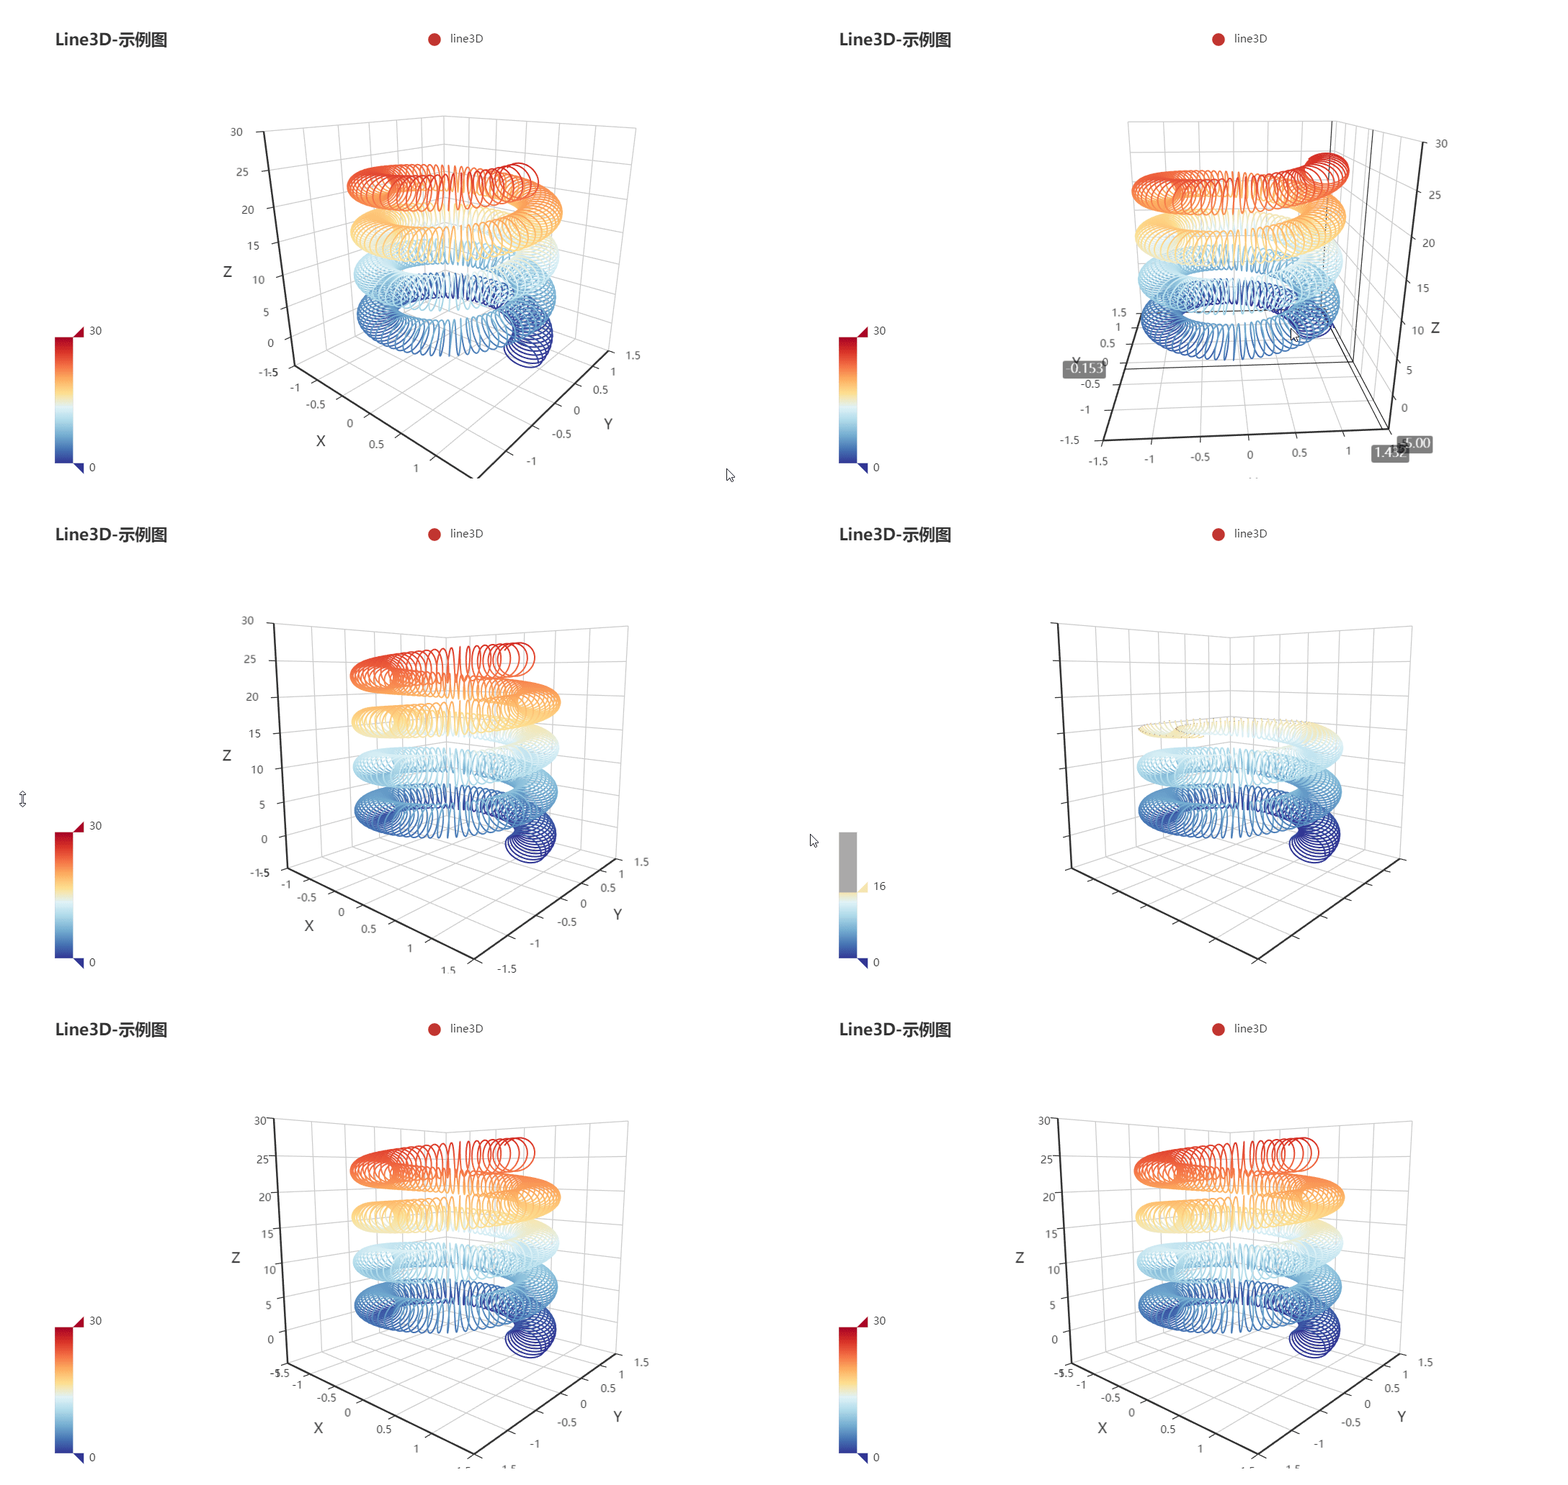
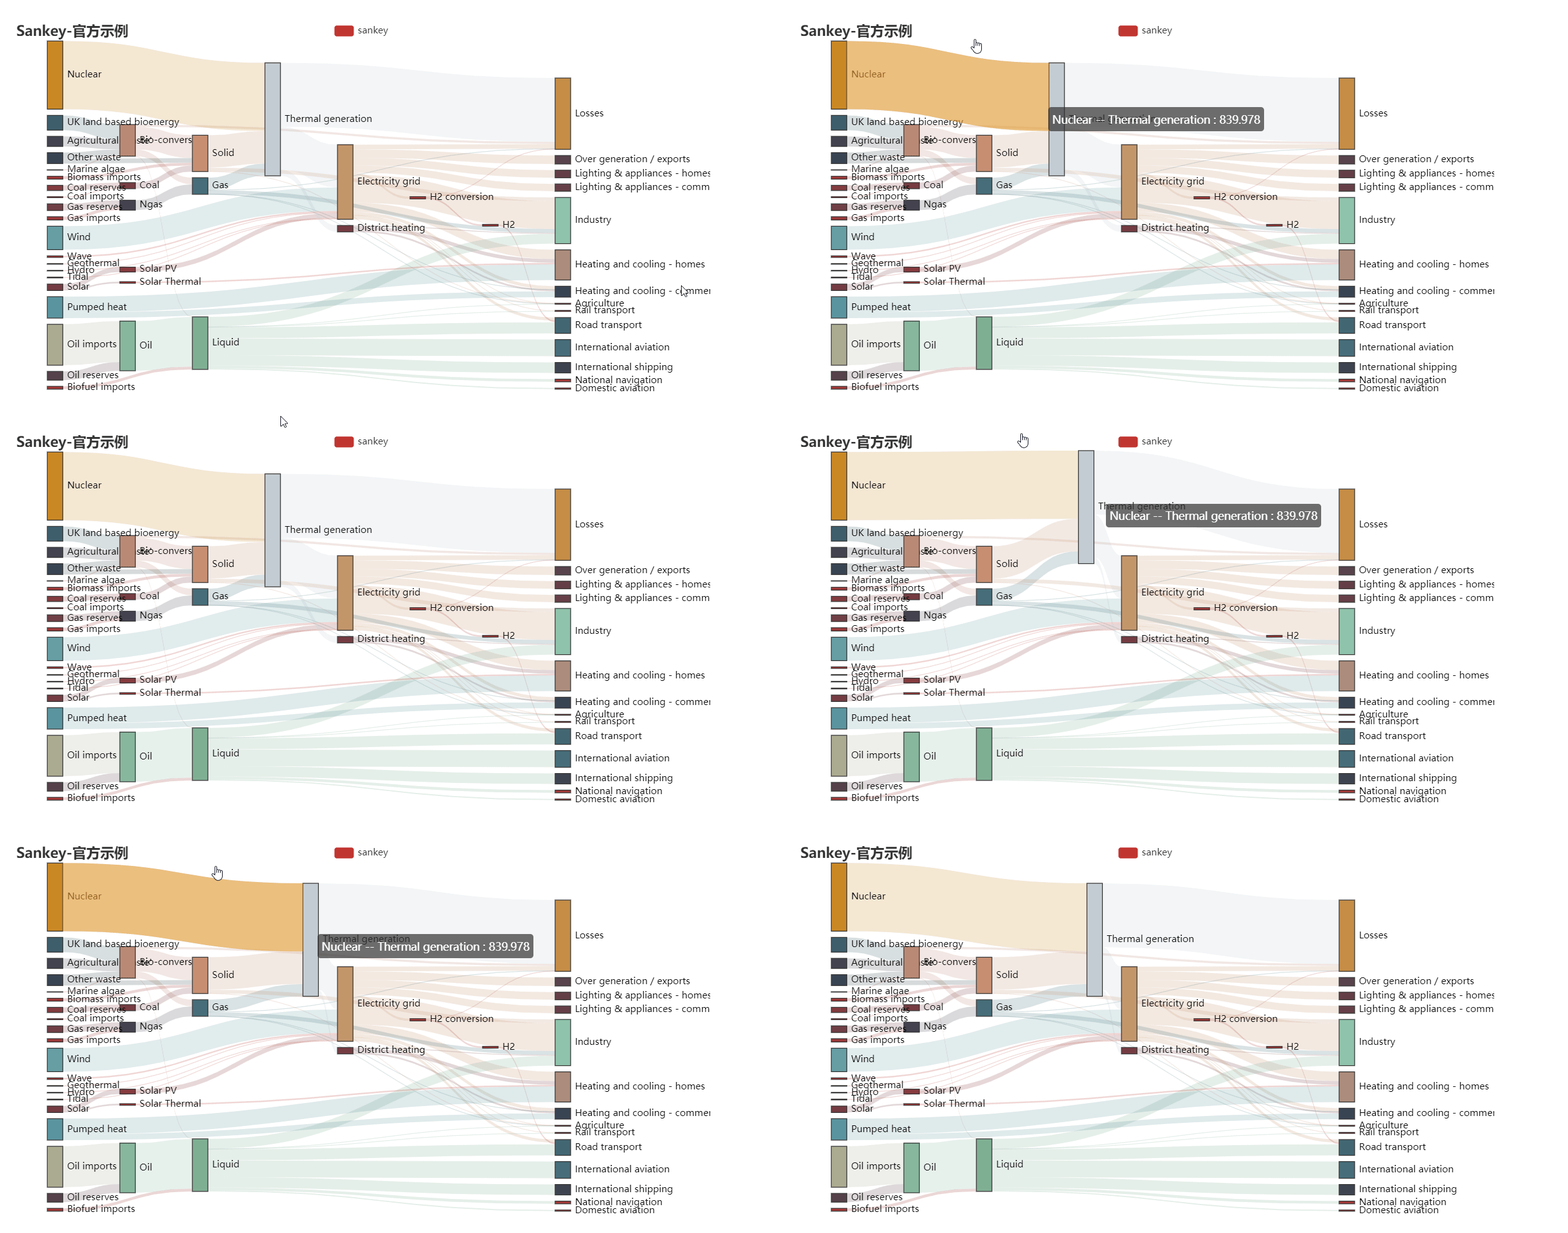
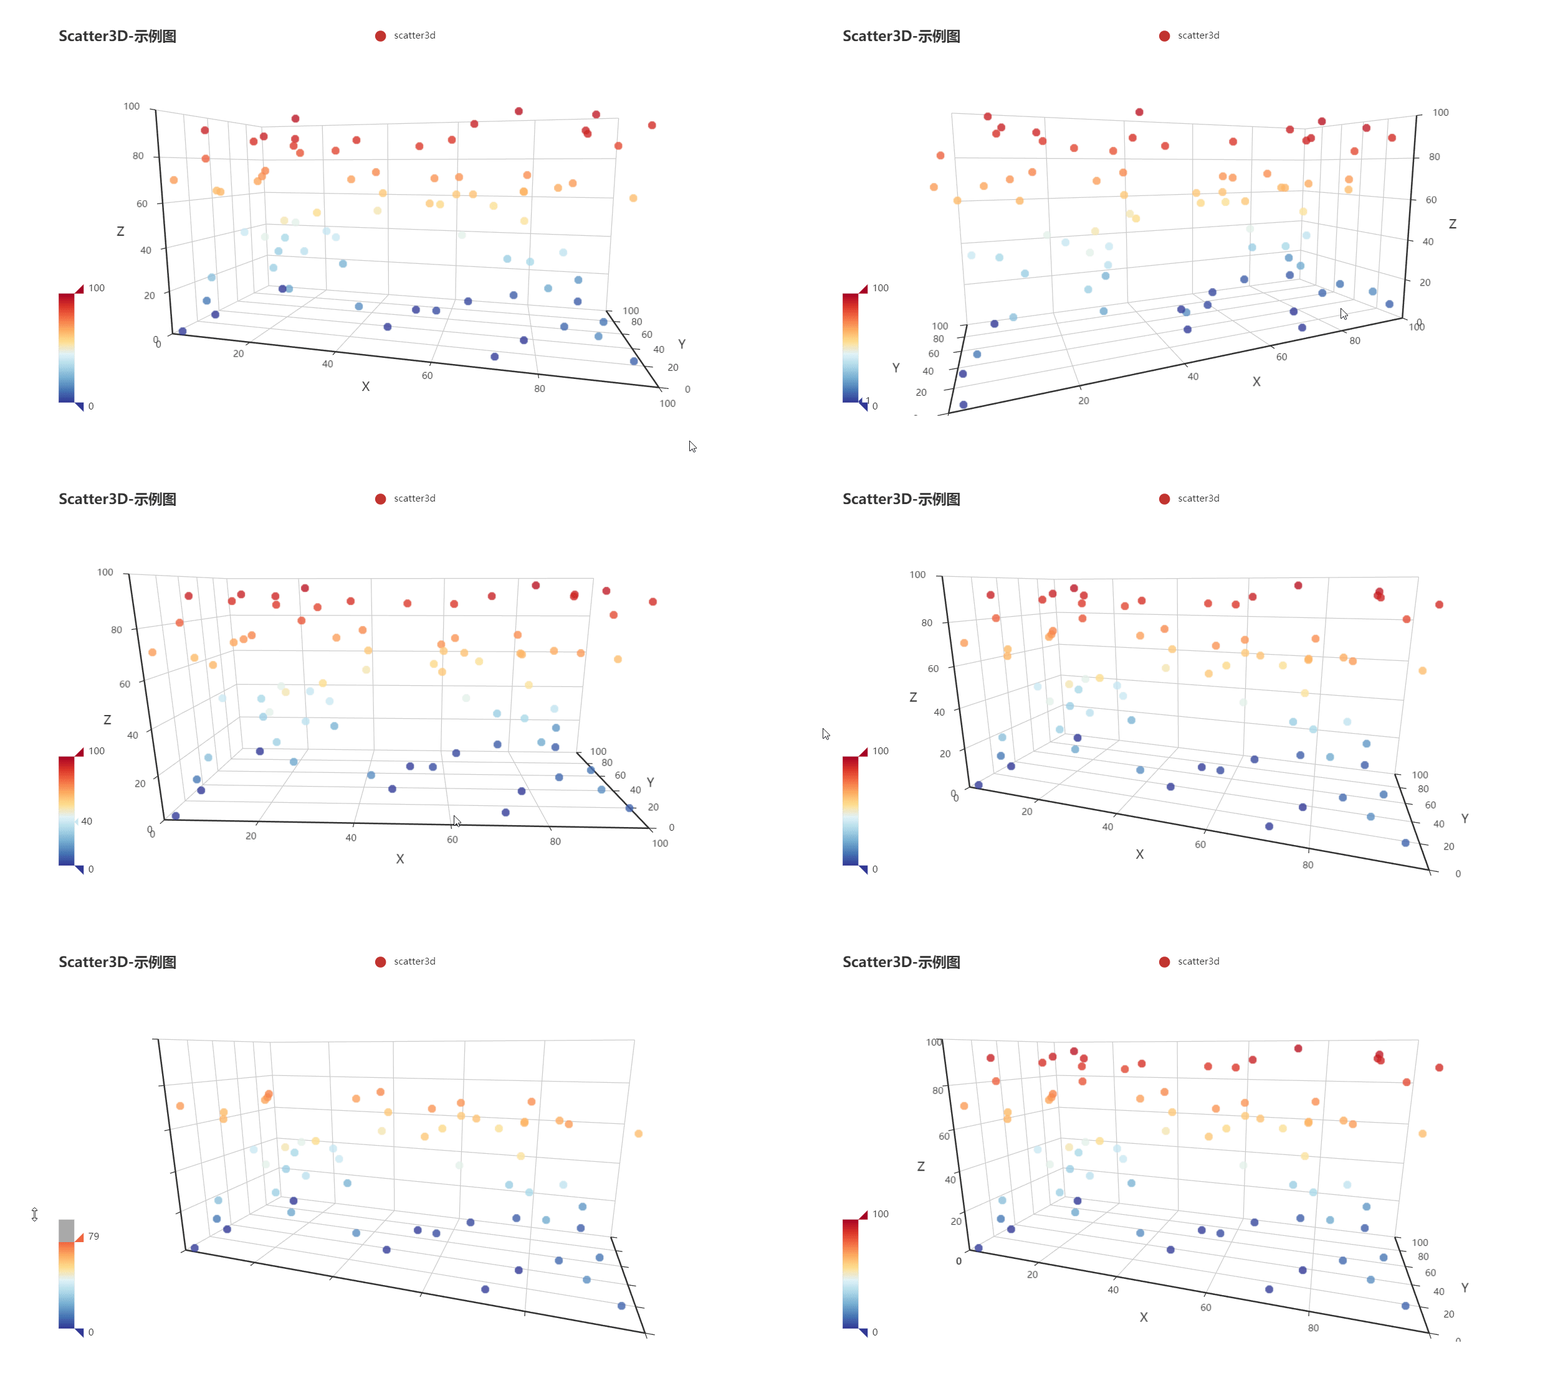
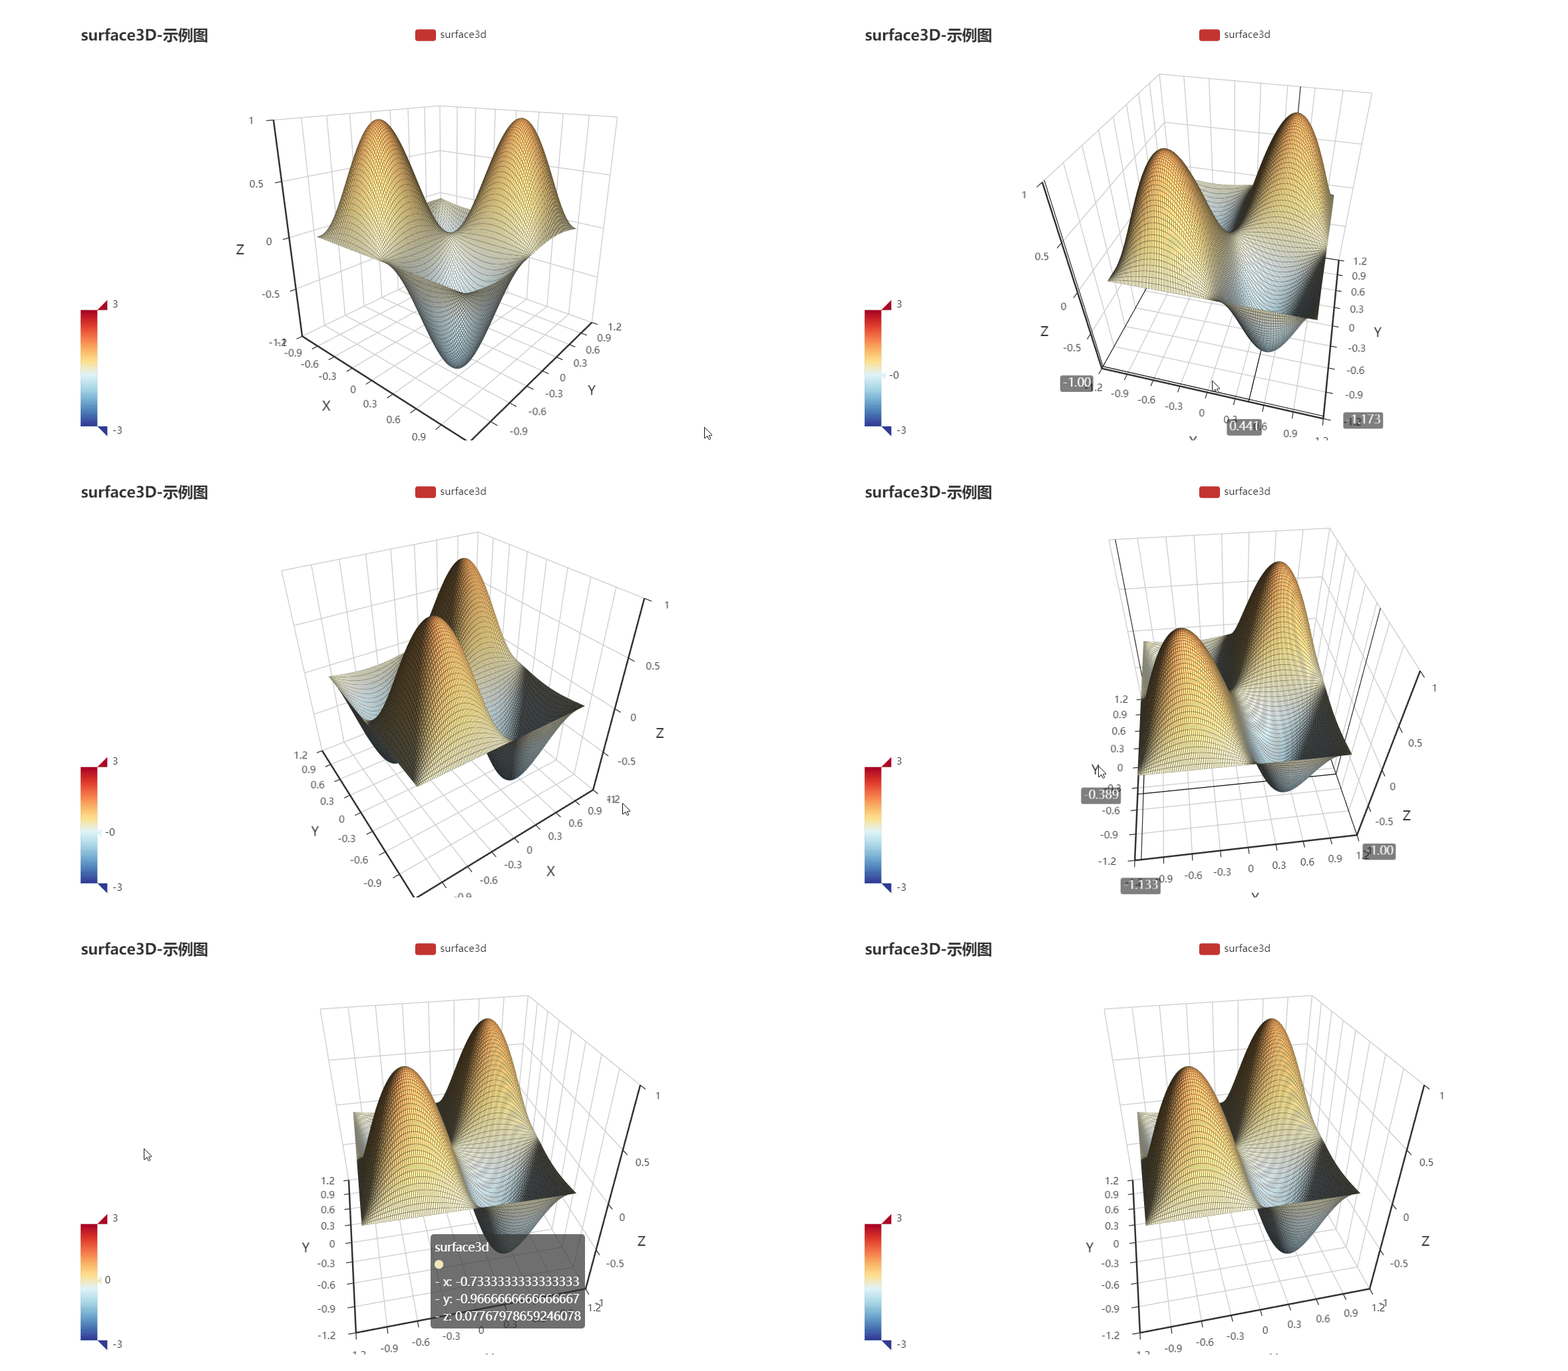
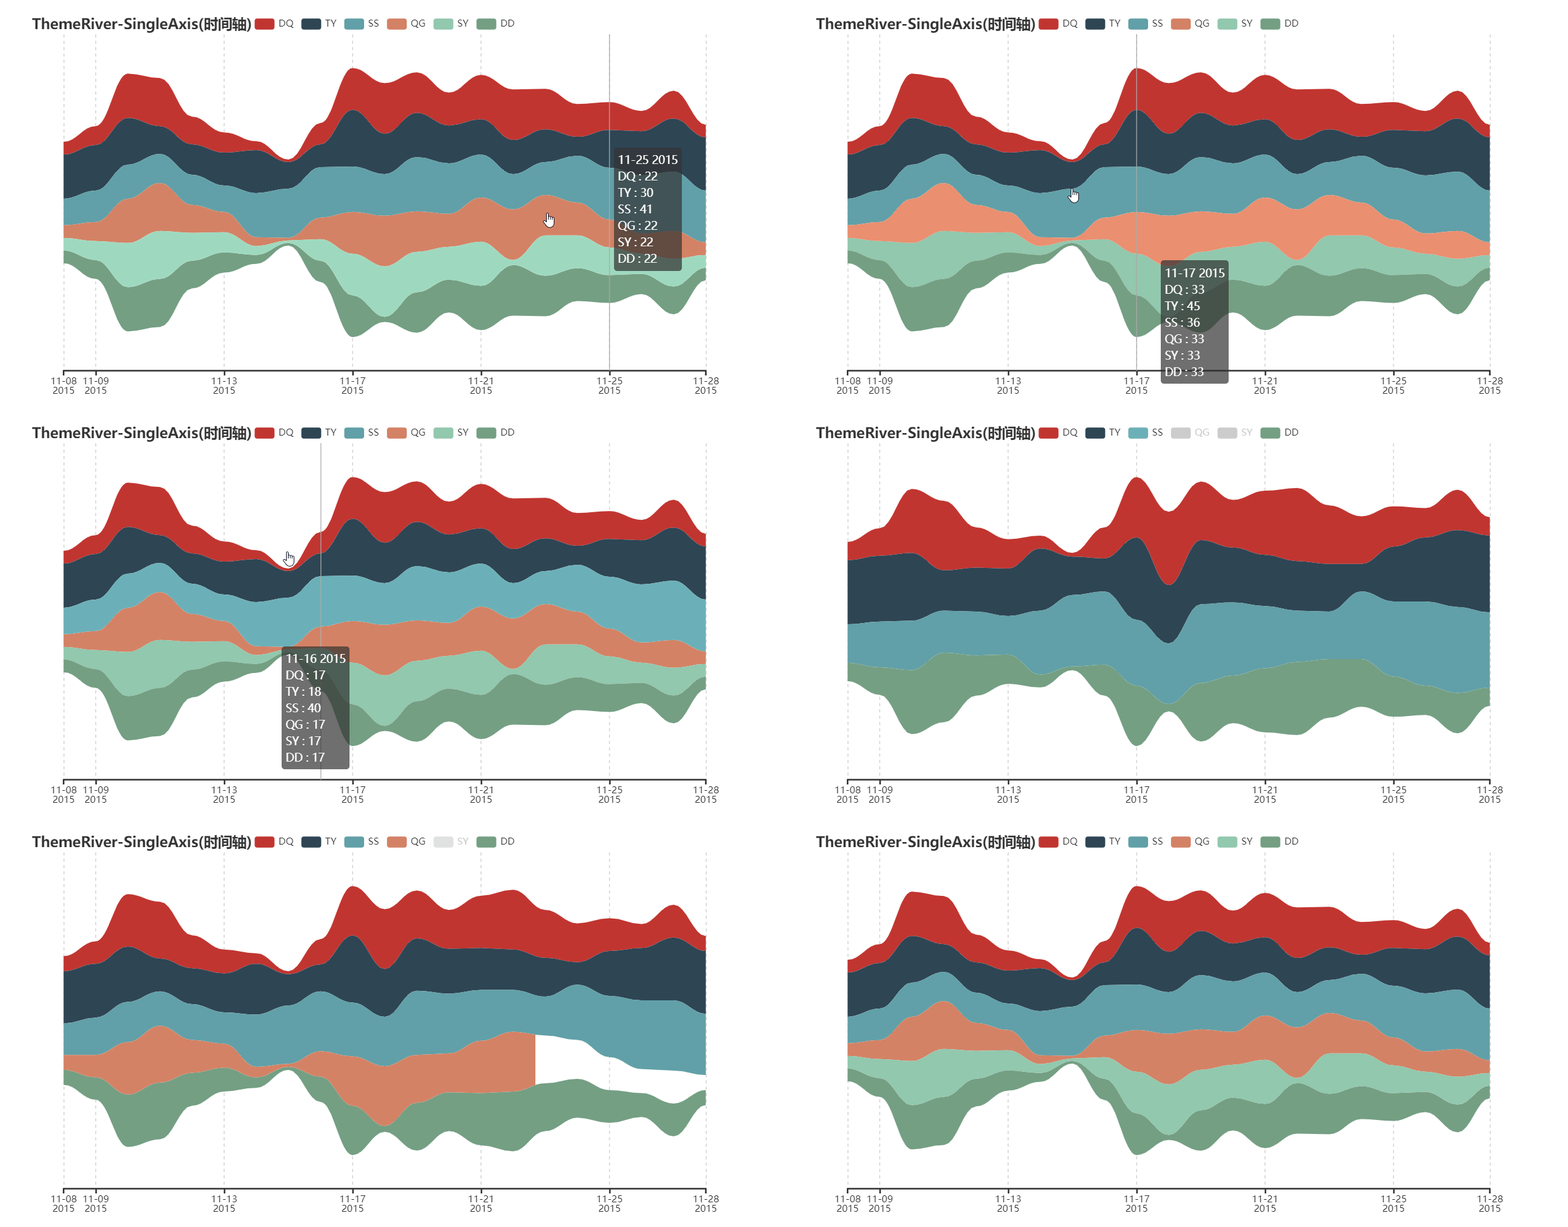
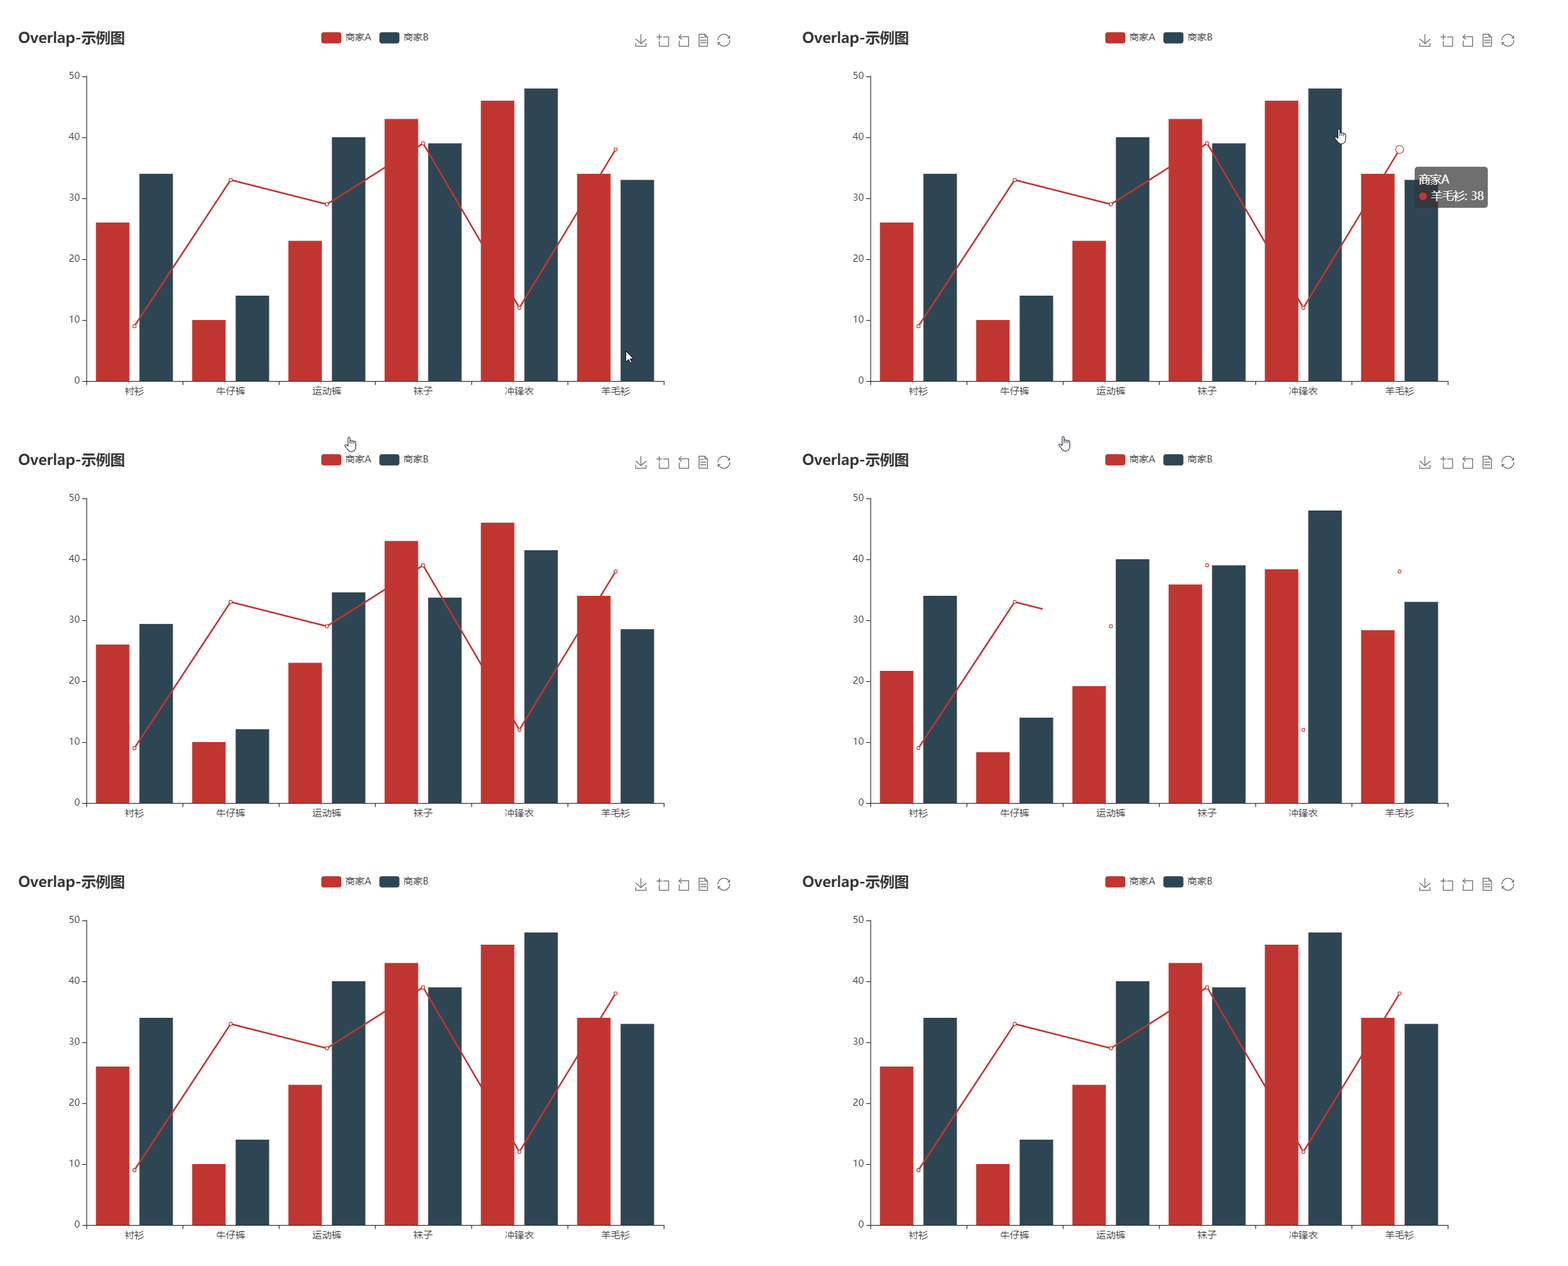
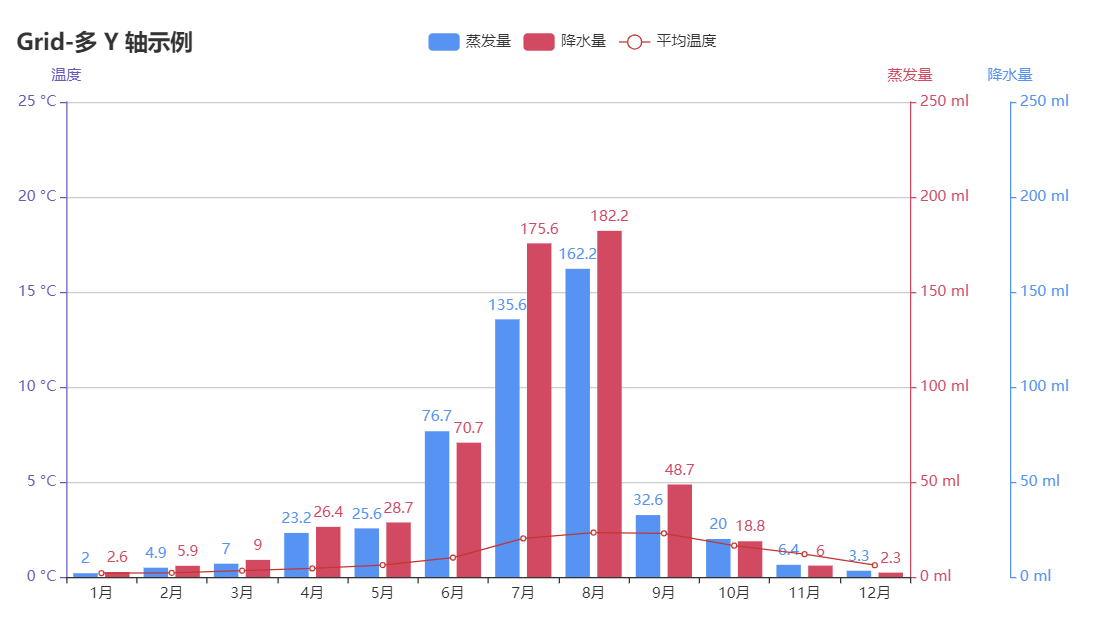
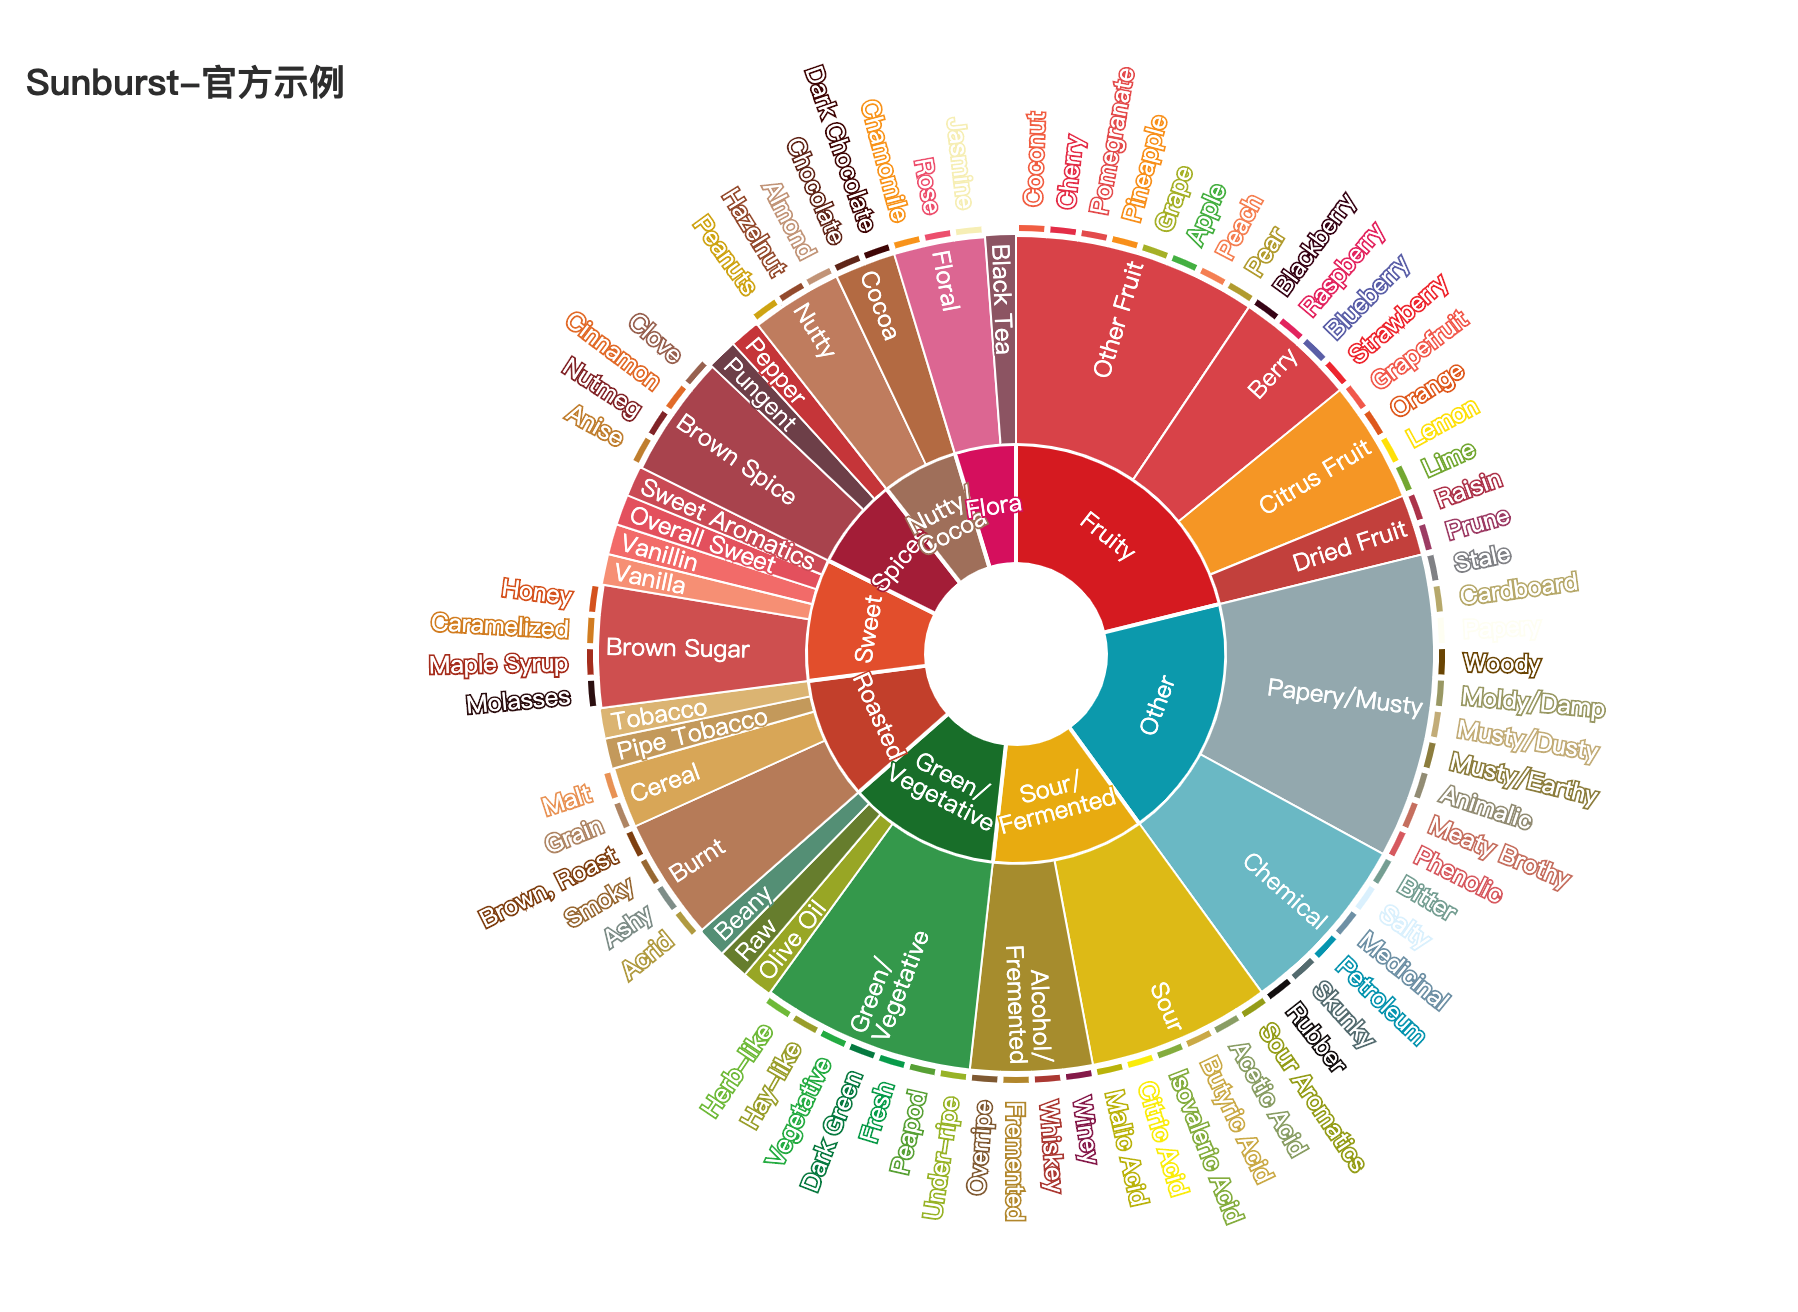
bar boxplot effectScatter funnel gague geo geo graph heatmap kline line liquid map bmap parallel pie ploar radar scatter tree treemap wordCloud bar3D line3D sankey scatter3D surface3D themeRiver sunburst overlap grid grid timeline

更多详细文档,请访问

代码质量

单元测试

$ pip install -r test/requirements.txt
$ make

集成测试

使用 Travis CIAppVeyor 持续集成环境。

代码规范

使用 flake8, Codecov 以及 pylint 提升代码质量。

😉 Author

pyecharts 主要由以下几位开发者开发维护

更多贡献者信息可以访问 pyecharts/graphs/contributors

💌 捐赠

开发和维护 pyecharts 花费了我巨大的心力,如果你觉得项目帮助到您,请认真考虑请作者喝一杯咖啡 😄

微信二维码 支付宝二维码
wechat-code alipay-code

如果其他开发者帮助到了您,也可以请他们喝咖啡 捐赠通道

💡 贡献

期待能有更多的开发者参与到 pyecharts 的开发中来,我们会保证尽快 Reivew PR 并且及时回复。但提交 PR 请确保

  1. 通过所有单元测试,如若是新功能,请为其新增单元测试
  2. 遵守开发规范,使用 black 以及 isort 格式化代码($ pip install -r requirements-dev.txt)
  3. 如若需要,请更新相对应的文档

我们也非常欢迎开发者能为 pyecharts 提供更多的示例,共同来完善文档,文档项目位于 pyecharts/website

📃 License

MIT ©chenjiandongx

Owner
pyecharts
pyecharts dev team
pyecharts
Seismic Waveform Inversion Toolbox-1.0

Seismic Waveform Inversion Toolbox (SWIT-1.0)
Haipeng Li 98 Dec 29, 2022
Generating interfaces(CLI, Qt GUI, Dash web app) from a Python function.

oneFace is a Python library for automatically generating multiple interfaces(CLI, GUI, WebGUI) from a callable Python object. oneFace is an easy way t

NaNg 31 Oct 21, 2022
Visualize tensors in a plain Python REPL using Sparklines

Visualize tensors in a plain Python REPL using Sparklines

Shawn Presser 43 Sep 03, 2022
Visualization Data Drug in thailand during 2014 to 2020

Visualization Data Drug in thailand during 2014 to 2020 Data sorce from ข้อมูลเปิดภาครัฐ สำนักงาน ป.ป.ส Inttroducing program Using tkinter module for

Narongkorn 1 Jan 05, 2022
Interactive plotting for Pandas using Vega-Lite

pdvega: Vega-Lite plotting for Pandas Dataframes pdvega is a library that allows you to quickly create interactive Vega-Lite plots from Pandas datafra

Altair 342 Oct 26, 2022
termplotlib is a Python library for all your terminal plotting needs.

termplotlib termplotlib is a Python library for all your terminal plotting needs. It aims to work like matplotlib. Line plots For line plots, termplot

Nico Schlömer 553 Dec 30, 2022
Tandem Mass Spectrum Prediction with Graph Transformers

MassFormer This is the original implementation of MassFormer, a graph transformer for small molecule MS/MS prediction. Check out the preprint on arxiv

Röst Lab 13 Oct 27, 2022
Visualization Website by using Dash and Heroku

Visualization Website by using Dash and Heroku You can visit the website https://payroll-expense-analysis.herokuapp.com/ In this project, I am interes

YF Liu 1 Jan 14, 2022
Custom ROI in Computer Vision Applications

EasyROI Helper library for drawing ROI in Computer Vision Applications Table of Contents EasyROI Table of Contents About The Project Tech Stack File S

43 Dec 09, 2022
Plotting library for IPython/Jupyter notebooks

bqplot 2-D plotting library for Project Jupyter Introduction bqplot is a 2-D visualization system for Jupyter, based on the constructs of the Grammar

3.4k Dec 29, 2022
Example scripts for generating plots of Bohemian matrices

Bohemian Eigenvalue Plotting Examples This repository contains examples of generating plots of Bohemian eigenvalues. The examples in this repository a

Bohemian Matrices 5 Nov 12, 2022
A programming language built on top of Python to easily allow Swahili speakers to get started with programming without ever knowing English

pyswahili A programming language built over Python to easily allow swahili speakers to get started with programming without ever knowing english pyswa

Jordan Kalebu 72 Dec 15, 2022
The plottify package is makes matplotlib plots more legible

plottify The plottify package is makes matplotlib plots more legible. It's a thin wrapper around matplotlib that automatically adjusts font sizes, sca

Andy Jones 97 Nov 04, 2022
A toolkit to generate MR sequence diagrams

mrsd: a toolkit to generate MR sequence diagrams mrsd is a Python toolkit to generate MR sequence diagrams, as shown below for the basic FLASH sequenc

Julien Lamy 3 Dec 25, 2021
Frbmclust - Clusterize FRB profiles using hierarchical clustering, plot corresponding parameters distributions

frbmclust Getting Started Clusterize FRB profiles using hierarchical clustering,

3 May 06, 2022
The interactive graphing library for Python (includes Plotly Express) :sparkles:

plotly.py Latest Release User forum PyPI Downloads License Data Science Workspaces Our recommended IDE for Plotly’s Python graphing library is Dash En

Plotly 12.7k Jan 05, 2023
📊 Charts with pure python

A zero-dependency python package that prints basic charts to a Jupyter output Charts supported: Bar graphs Scatter plots Histograms 🍑 📊 👏 Examples

Max Humber 54 Oct 04, 2022
Make visual music sheets for thatskygame (graphical representations of the Sky keyboard)

sky-python-music-sheet-maker This program lets you make visual music sheets for Sky: Children of the Light. It will ask you a few questions, and does

21 Aug 26, 2022
This is a super simple visualization toolbox (script) for transformer attention visualization ✌

Trans_attention_vis This is a super simple visualization toolbox (script) for transformer attention visualization ✌ 1. How to prepare your attention m

Mingyu Wang 3 Jul 09, 2022
With Holoviews, your data visualizes itself.

HoloViews Stop plotting your data - annotate your data and let it visualize itself. HoloViews is an open-source Python library designed to make data a

HoloViz 2.3k Jan 04, 2023