`charts.css.py` brings `charts.css` to Python. Online documentation and samples is available at the link below.

Overview

charts.css.py

charts.css.py provides a python API to convert your 2-dimension data lists into html snippet, which will be rendered into charts by CSS, when serving inside a browser.

  • The output of charts.css.py is not images. Consequently, charts.css.py is a pure Python package without any image library dependency. You can use charts.css.py on any platform.
  • The output of charts.css.py is a normal HTML table. Search engines and screen readers will be able to consume your data even when CSS rendering is unavailable.
  • Once the html snippet is delivered into the browser window, the rendering is done by CSS, which is typically faster than JS-heavy chart libraries.
  • Since the output is normal HTML, you could customize its size and position, by defining your own CSS styles.

Installation

pip install charts.css.py

Usage

Just combine the output of charts.css.py functions and the predefined CSS style <link rel="stylesheet" href="https://cdn.jsdelivr.net/npm/charts.css/dist/charts.min.css"> into your html page.

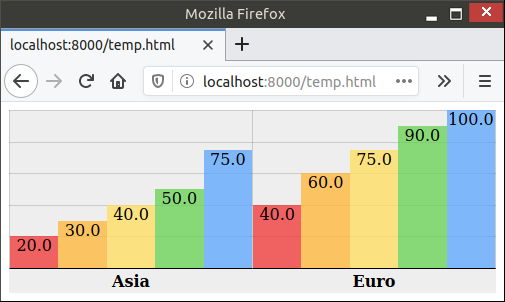
For example, the following code snippet can convert a 2-dimension list into column chart:

from charts.css import column
STYLESHEET = '<link rel="stylesheet" href="https://cdn.jsdelivr.net/npm/charts.css/dist/charts.min.css">'
chart = column(
    [
        ["Continent", "1st year", "2nd year", "3rd year", "4th year", "5th year"],
        ["Asia", 20.0, 30.0, 40.0, 50.0, 75.0],
        ["Euro", 40.0, 60.0, 75.0, 90.0, 100.0],
    ],
    headers_in_first_row=True,
    headers_in_first_column=True,
    )
# Now, variable chart contains html snippet of "<table>...</table>", and
# STYLESHEET is just a constant string of "<link href='https://.../charts.css'>".
# You can somehow insert them into the proper places of your full html page.
# Here in this sample, we take a shortcut by simply concatenating them.
open("output.html", "w").write(STYLESHEET + chart)

The output.html will be rendered in browser like this:

Sample output

Advanced Usage

There are currently 4 different charts implemented: bar, column, line, area. All those methods support many parameters to further customize the chart appearance. bar() and column() also support stacking by value or stacking by percentage. All those features are demonstrated in the different samples in this document.

Lastly, this package also provides a command-line tool csv2chart. You can use it to convert csv file into an html file. For example, csv2chart sample.csv output.html. You can also run csv2chart -h to know all the parameters it supports.

Versioning

charts.css.py uses Semantic Versioning.

You might also like...
🐞 📊 Ladybug extension to generate 2D charts

ladybug-charts Ladybug extension to generate 2D charts. Installation pip install ladybug-charts QuickStart import ladybug_charts API Documentation Loc

GitHub English Top Charts

Help you discover excellent English projects and get rid of the interference of other spoken language.

Data-FX is an addon for Blender (2.9) that allows for the visualization of data with different charts

Data-FX Data-FX is an addon for Blender (2.9) that allows for the visualization of data with different charts Currently, there are only 2 chart option

Glue is a python project to link visualizations of scientific datasets across many files.

Glue Glue is a python project to link visualizations of scientific datasets across many files. Click on the image for a quick demo: Features Interacti

Flipper Zero documentation repo

Flipper Zero Docs Participation To fix a bug or add something new to this repository, you need to open a pull-request. Also, on every page of the site

A tool for automatically generating 3D printable STLs from freely available lidar scan data.

mini-map-maker A tool for automatically generating 3D printable STLs from freely available lidar scan data. Screenshots Tutorial To use this script, g

A Python Binder that merge 2 files with any extension by creating a new python file and compiling it to exe which runs both payloads.

Update ! ANONFILE MIGHT NOT WORK ! About A Python Binder that merge 2 files with any extension by creating a new python file and compiling it to exe w

Debugging, monitoring and visualization for Python Machine Learning and Data Science

Welcome to TensorWatch TensorWatch is a debugging and visualization tool designed for data science, deep learning and reinforcement learning from Micr

Python module for drawing and rendering beautiful atoms and molecules using Blender.

Batoms is a Python package for editing and rendering atoms and molecules objects using blender. A Python interface that allows for automating workflows.

Comments
  • charts.css.py 0.4.0

    charts.css.py 0.4.0

    This release adds some helper and parameters to help you fine tune the chart appearance. They are especially useful when you attempt to render some csv data input with many rows.

    • Feature: A transpose(...) helper to flip your input data diagonally so that it swaps its x-axis and y-axis.
    • Feature: New parameter hide_label. It is useful when primary axis contains too many rows.
    • Feature: New parameter tooltip_builder which has a shape of lambda value="...", label="...": "...".
    • Feature: New parameter value_converter which typically will be assigned with either int or float.
    • Change: By default, data axes will no longer be shown. You can turn it back on by the new show_data_axes parameter.

    The online documentation will be updated to demonstrate these new features.

    opened by rayluo 0
  • Release 0.3.0

    Release 0.3.0

    • Line chart should not accept non-zero data_spacing or datasets_spacing. Now it would rightfully reject such an input.
    • Provide an online document/sample
    • Backport to Brython 3.7 and 3.8. The recommended Brython version is still its latest version, currently 3.9.
    opened by rayluo 0
  • charts.css.py 0.1.0

    charts.css.py 0.1.0

    The first release contains:

    • Basic functionality including bar, column, line and area
    • An experimental helper wrapper
    • Barely enough documentation in README.md
    • Also comes with a command-line tool csv2chart. I use it for my ad-hoc test. Let me know if you find it useful.
    opened by rayluo 0
Releases(0.4.0)
  • 0.4.0(Jun 27, 2021)

    This release adds some helper and parameters to help you fine tune the chart appearance. They are especially useful when you attempt to render some csv data input with many rows.

    • Feature: A transpose(...) helper to flip your input data diagonally so that it swaps its x-axis and y-axis.
    • Feature: New parameter value_converter which typically will be assigned with either int or float. With its help, now you can consume data directly from csv by data = list(csv.reader(f)).
    • Feature: New parameter hide_label. It is useful when primary axis contains too many rows.
    • Feature: New parameter tooltip_builder which has a shape of lambda value="...", label="...": "...".
    • Change: By default, data axes will no longer be shown. You can turn it back on by the new show_data_axes parameter.

    The online documentation ~will be~ has been updated to demonstrate these new features.

    Source code(tar.gz)
    Source code(zip)
    charts.css.py-brython.js(8.11 KB)
  • 0.3.0(May 23, 2021)

    • Line chart should not accept non-zero data_spacing or datasets_spacing. Now it would rightfully reject such an input.
    • Provide an online document/sample
    • Backport to Brython 3.7 and 3.8. The recommended Brython version is still its latest version, currently 3.9.
    • Also hosted as a Brython package which can be used by <script src="https://github.com/rayluo/charts.css.py/releases/download/0.3.0/charts.css.py-brython.js"></script>. Requires Brython 3.7.5 or above.
    Source code(tar.gz)
    Source code(zip)
    charts.css.py-brython.js(7.20 KB)
  • 0.2.0(May 17, 2021)

  • 0.1.0(May 14, 2021)

    The first release contains:

    • Basic functionality including bar, column, line and area
    • An experimental helper wrapper
    • Barely enough documentation in README.md
    • Also comes with a command-line tool csv2chart. I use it for my ad-hoc test. Let me know if you find it useful.
    Source code(tar.gz)
    Source code(zip)
Visualizations of some specific solutions of different differential equations.

Diff_sims Visualizations of some specific solutions of different differential equations. Heat Equation in 1 Dimension (A very beautiful and elegant ex

2 Jan 13, 2022
Draw datasets from within Jupyter.

drawdata This small python app allows you to draw a dataset in a jupyter notebook. This should be very useful when teaching machine learning algorithm

vincent d warmerdam 505 Nov 27, 2022
Python library that makes it easy for data scientists to create charts.

Chartify Chartify is a Python library that makes it easy for data scientists to create charts. Why use Chartify? Consistent input data format: Spend l

Spotify 3.2k Jan 04, 2023
A simple interpreted language for creating basic mathematical graphs.

graphr Introduction graphr is a small language written to create basic mathematical graphs. It is an interpreted language written in python and essent

2 Dec 26, 2021
Personal IMDB Graphs with Bokeh

Personal IMDB Graphs with Bokeh Do you like watching movies and also rate all of them in IMDB? Would you like to look at your IMDB stats based on your

2 Dec 15, 2021
Matplotlib tutorial for beginner

matplotlib is probably the single most used Python package for 2D-graphics. It provides both a very quick way to visualize data from Python and publication-quality figures in many formats. We are goi

Nicolas P. Rougier 2.6k Dec 28, 2022
Kglab - an abstraction layer in Python for building knowledge graphs

Graph Data Science: an abstraction layer in Python for building knowledge graphs, integrated with popular graph libraries – atop Pandas, RDFlib, pySHACL, RAPIDS, NetworkX, iGraph, PyVis, pslpython, p

derwen.ai 466 Jan 09, 2023
This GitHub Repository contains Data Analysis projects that I have completed so far! While most of th project are focused on Data Analysis, some of them are also put here to show off other skills that I have learned.

Welcome to my Data Analysis projects page! This GitHub Repository contains Data Analysis projects that I have completed so far! While most of th proje

Kyle Dini 1 Jan 31, 2022
Browse Dash docsets inside emacs

Helm Dash What's it This package uses Dash docsets inside emacs to browse documentation. Here's an article explaining the basic usage of it. It doesn'

504 Dec 15, 2022
Quickly and accurately render even the largest data.

Turn even the largest data into images, accurately Build Status Coverage Latest dev release Latest release Docs Support What is it? Datashader is a da

HoloViz 2.9k Dec 28, 2022
Package managers visualization

Software Galaxies This repository combines visualizations of major software package managers. All visualizations are available here: http://anvaka.git

Andrei Kashcha 1.4k Dec 22, 2022
A Jupyter - Leaflet.js bridge

ipyleaflet A Jupyter / Leaflet bridge enabling interactive maps in the Jupyter notebook. Usage Selecting a basemap for a leaflet map: Loading a geojso

Jupyter Widgets 1.3k Dec 27, 2022
This is a super simple visualization toolbox (script) for transformer attention visualization ✌

Trans_attention_vis This is a super simple visualization toolbox (script) for transformer attention visualization ✌ 1. How to prepare your attention m

Mingyu Wang 3 Jul 09, 2022
a python function to plot a geopandas dataframe

Pretty GeoDataFrame A minimum python function (~60 lines) to draw pretty geodataframe. Based on matplotlib, shapely, descartes. Installation just use

haoming 27 Dec 05, 2022
Squidpy is a tool for the analysis and visualization of spatial molecular data.

Squidpy is a tool for the analysis and visualization of spatial molecular data. It builds on top of scanpy and anndata, from which it inherits modularity and scalability. It provides analysis tools t

Theis Lab 251 Dec 19, 2022
The Timescale NFT Starter Kit is a step-by-step guide to get up and running with collecting, storing, analyzing and visualizing NFT data from OpenSea, using PostgreSQL and TimescaleDB.

Timescale NFT Starter Kit The Timescale NFT Starter Kit is a step-by-step guide to get up and running with collecting, storing, analyzing and visualiz

Timescale 102 Dec 24, 2022
This package creates clean and beautiful matplotlib plots that work on light and dark backgrounds

This package creates clean and beautiful matplotlib plots that work on light and dark backgrounds. Inspired by the work of Edward Tufte.

Nico Schlömer 205 Jan 07, 2023
:art: Diagram as Code for prototyping cloud system architectures

Diagrams Diagram as Code. Diagrams lets you draw the cloud system architecture in Python code. It was born for prototyping a new system architecture d

MinJae Kwon 27.5k Dec 30, 2022
These data visualizations were created as homework for my CS40 class. I hope you enjoy!

Data Visualizations These data visualizations were created as homework for my CS40 class. I hope you enjoy! Nobel Laureates by their Country of Birth

9 Sep 02, 2022
A set of useful perceptually uniform colormaps for plotting scientific data

Colorcet: Collection of perceptually uniform colormaps Build Status Coverage Latest dev release Latest release Docs What is it? Colorcet is a collecti

HoloViz 590 Dec 31, 2022