Emblaze - Interactive Embedding Comparison
Emblaze is a Jupyter notebook widget for visually comparing embeddings using animated scatter plots. It bundles an easy-to-use Python API for performing dimensionality reduction on multiple sets of embedding data (including aligning the results for easier comparison), and a full-featured interactive platform for probing and comparing embeddings that runs within a Jupyter notebook cell.
Installation
Compatibility Note: Note that this widget has been tested using Python >= 3.7. If you are using JupyterLab, please make sure you are running version 3.0 or higher. The widget currently does not support displaying in the VS Code interactive notebook environment.
Install Emblaze using pip:
pip install emblaze
The widget should work out of the box when you run jupyter lab (see example code below).
Jupyter Notebook note: If you are using Jupyter Notebook 5.2 or earlier, you may also need to enable the nbextension:
jupyter nbextension enable --py --sys-prefix emblaze
Standalone Demo
Although the full application is designed to work as a Jupyter widget, you can run a standalone version with most of the available features directly in your browser. To do so, simply run the following command after pip-installing the package (note: you do not need to clone the repository to run the standalone app):
python -m emblaze.server
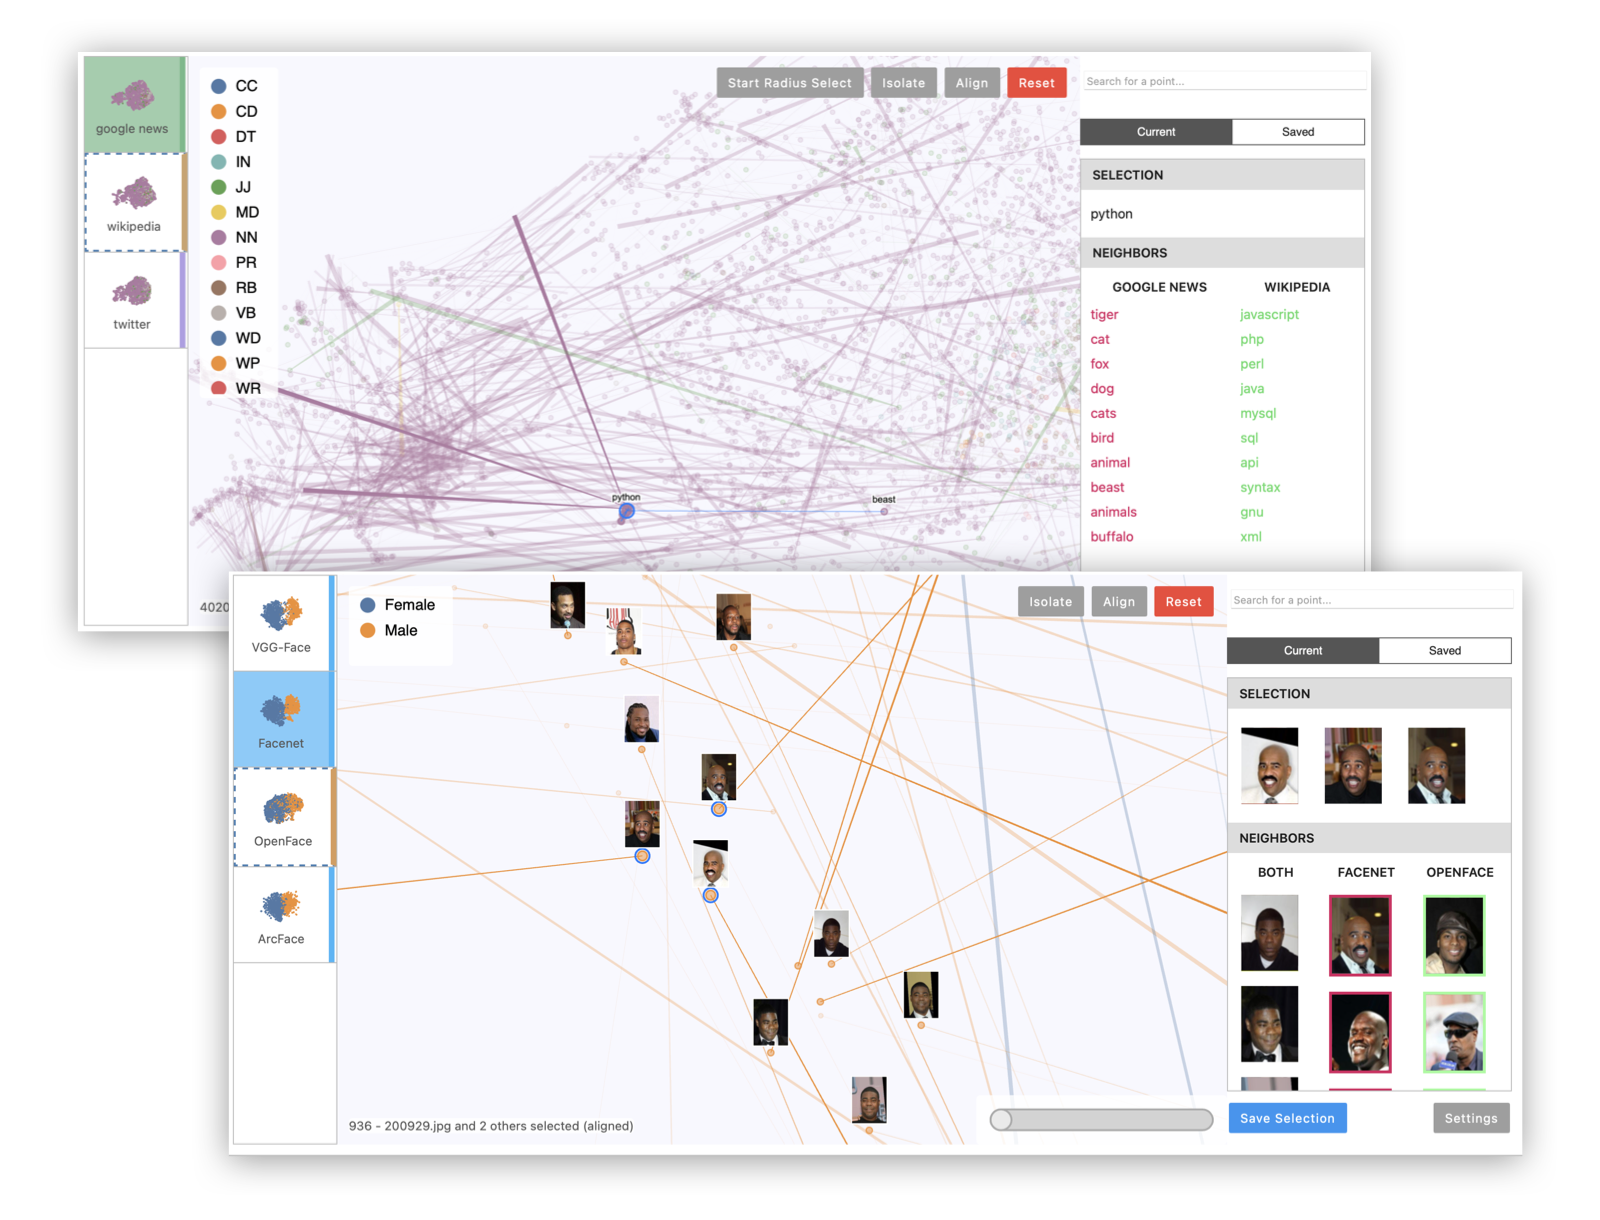
Visit localhost:5000 to see the running application. This will allow you to view two demo datasets: one showing five different t-SNE projections of a subset of MNIST digits, and one showing embeddings of the same 5,000 words according to three different data sources (Google News, Wikipedia, and Twitter). To add your own datasets to the standalone app, you can create a directory containing your saved comparison JSON files (see Saving and Loading below), then pass it as a command-line argument:
python -m emblaze.server /path/to/comparisons
Examples
Please see examples/example.ipynb to try using the Emblaze widget on the Boston housing prices or MNIST (TensorFlow import required) datasets.
Example 1: Multiple projections of the same embedding dataset. This can reveal areas of variation in the dimensionality reduction process, since tSNE and UMAP are randomized algorithms.
import emblaze
from emblaze.utils import Field, ProjectionTechnique

# X is an n x k array, Y is a length-n array
X, Y = ...

# Represent the high-dimensional embedding
emb = emblaze.Embedding({Field.POSITION: X, Field.COLOR: Y})
# Compute nearest neighbors in the high-D space (for display)
emb.compute_neighbors(metric='cosine')

# Generate UMAP 2D representations - you can pass UMAP parameters to project()
variants = emblaze.EmbeddingSet([
    emb.project(method=ProjectionTechnique.UMAP) for _ in range(10)
])
# Compute neighbors again (to indicate that we want to compare projections)
variants.compute_neighbors(metric='euclidean')

w = emblaze.Viewer(embeddings=variants)
w
Example 2: Multiple embeddings of the same data from different models. This is useful to see how different models embed data differently.
# Xs is a list of n x k arrays corresponding to different embedding spaces
Xs = ...
# Y is a length-n array of labels for color-coding
Y = ...
# List of strings representing the name of each embedding space (e.g.
# "Google News", "Wikipedia", "Twitter"). Omit to use generic names
embedding_names = [...]

# Make high-dimensional embedding objects
embeddings = emblaze.EmbeddingSet([
    emblaze.Embedding({Field.POSITION: X, Field.COLOR: Y}, label=emb_name)
    for X, emb_name in zip(Xs, embedding_names)
])
embeddings.compute_neighbors(metric='cosine')

# Make aligned UMAP
reduced = embeddings.project(method=ProjectionTechnique.ALIGNED_UMAP)

w = emblaze.Viewer(embeddings=reduced)
w
Example 3: Visualizing image data with image thumbnails. The viewer will display image previews for each point as well as its nearest neighbors. (For text data, you can use TextThumbnails to show small pieces of text next to the points.)
# images is an n x 100 x 100 x 3 numpy array of 100x100 RGB images (values from 0-255)
images = ...
thumbnails = emblaze.ImageThumbnails(images)
w = emblaze.Viewer(embeddings=embeddings, thumbnails=thumbnails)
w
You can also visualize embeddings with multimodal labels (i.e. where some points have text labels and others have image labels) by initializing an emblaze.CombinedThumbnails instance with a list of other Thumbnails objects to combine.
Interactive Analysis
Once you have loaded a Viewer instance in the notebook, you can read and write its properties to dynamically work with the visualization. The following properties are reactive:
embeddings(EmbeddingSet) Modify this to change the entire dataset that is displayed.thumbnails(Thumbnails) Represents the image or text thumbnails displayed on hover and click.currentFrame(int) The current frame or embedding space that is being viewed (from0tolen(embeddings)).selectedIDs(List[int]) The selected ID numbers. Unless you provide custom IDs when constructing theEmbeddingSet, these are simply zero-indexed integers.alignedIDs(List[int]) The IDs of the points to which the embedding spaces are aligned (same format asselectedIDs). Alignment is computed relative to the positions of the points in the current frame.colorScheme(string) The name of a color scheme to use to render the points. A variety of color schemes are available, listed insrc/colorschemes.ts. This property can also be changed in the Settings panel of the widget.previewMode(string) The method to use to generate preview lines, which should be one of the values in `utils.
Saving and Loading
You can save the data used to make comparisons to JSON, so that it is easy to load them again in Jupyter or the standalone application without re-running the embedding/projection code. Comparisons consist of an EmbeddingSet (containing the positions of the points in each 2D projection), a Thumbnails object (dictating how to display each point), and one or more NeighborSets (which contain the nearest-neighbor sets used for comparison and display).
To save a comparison, call the save_comparison() method on the Viewer. Note that if you are using high-dimensional nearest neighbors (most use cases), this method by default saves both the high-dimensional coordinates and the nearest-neighbor IDs. This can create files ranging from hundreds of MB to GBs. To store only the nearest neighbor IDs, pass ancestor_data=False as a keyword argument. Note that if you disable storing the high-dimensional coordinates, you will be unable to use tools that depend on distances in hi-D space (such as the high-dimensional radius select).
To load a comparison, simply initialize the Viewer as follows:
w = emblaze.Viewer(file="/path/to/comparison.json")
Development Installation
Clone repository, then install dependencies:
pip install -r requirements.txt
Install the python package. This will also build the JS packages.
pip install -e .
Run the following commands if you use Jupyter Lab:
jupyter labextension install @jupyter-widgets/jupyterlab-manager --no-build
jupyter labextension install .
Run the following commands if you use Jupyter Notebook:
jupyter nbextension install --sys-prefix --symlink --overwrite --py emblaze
jupyter nbextension enable --sys-prefix --py emblaze
Note that the --symlink flag doesn't work on Windows, so you will here have to run the install command every time that you rebuild your extension. For certain installations you might also need another flag instead of --sys-prefix, but we won't cover the meaning of those flags here.
How to see your changes
Open JupyterLab in watch mode with jupyter lab --watch. Then, in a separate terminal, watch the source directory for changes with npm run watch. After a change to the JavaScript code, you will wait for the build to finish, then refresh your browser. After changing in Python code, you will need to restart the notebook kernel to see your changes take effect.
Standalone App Development
To develop using the standalone app, run npm run watch:standalone in a separate terminal from the Flask server to continuously build the frontend. You will need to reload the page to see your changes.
The standalone application serves datasets stored at the data path that is printed when the Flask server starts (should be something like .../lib/python3.9/site-packages/emblaze/data for the pip-installed version, or .../emblaze/emblaze/data for a local repository). You can add your own datasets by building an EmbeddingSet and (optionally) a Thumbnails object, then saving the results to files in the data directory:
import os, json

dataset_name = "my-dataset"
data_dir = ... # data directory printed by flask server

embeddings = ... # EmbeddingSet object
thumbnails = ... # (Text|Image)Thumbnails object

os.mkdir(os.path.join(data_dir, dataset_name))
with open(os.path.join(data_dir, dataset_name, "data.json"), "w") as file:
    json.dump(embeddings.to_json(), file)
with open(os.path.join(data_dir, dataset_name, "thumbnails.json"), "w") as file:
    json.dump(thumbnails.to_json(), file)
Deployment
First clean all npm build intermediates:
npm run clean
Bump the widget version in emblaze/_version.py, emblaze/_frontend.py, and package.json if applicable. Then build the notebook widgets and standalone app:
npm run build:all
Run the packaging script to generate the wheel for distribution:
python -m build
Upload to PyPI (replace
with the version number):
twine upload dist/emblaze-

    *
Development Notes
- Svelte transitions don't seem to work well as they force an expensive re-layout operation. Avoid using them during interactions.

 32 Dec 13, 2022
 39 Aug 20, 2021
 93 Nov 06, 2022
 14 Apr 15, 2022
 427 Dec 13, 2022
 3 Apr 23, 2022
 52 Dec 29, 2022
 2 Mar 15, 2022
 1k Jan 02, 2023
 5 Dec 06, 2022
 61 Dec 25, 2022
 1 Oct 23, 2022
 23 Dec 13, 2022
 2 Mar 28, 2022
 3 Aug 24, 2021
 2 Feb 11, 2022
 85 Dec 24, 2022
 147 Jan 06, 2023
 30 Oct 25, 2022
 22 Dec 13, 2022