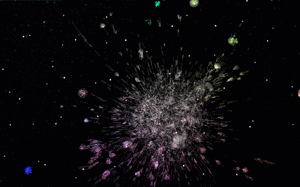
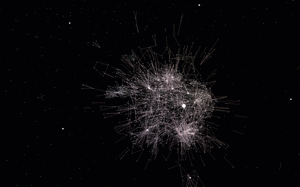
Package managers visualization

Related tags

Data Visualizationpm
Overview

Software Galaxies

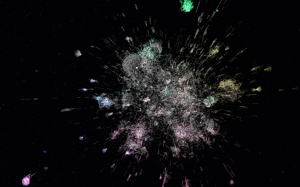
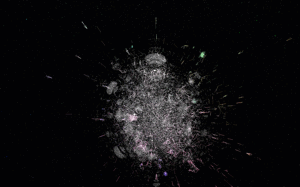
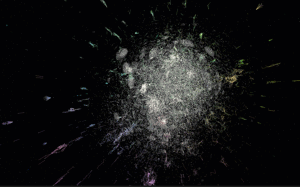
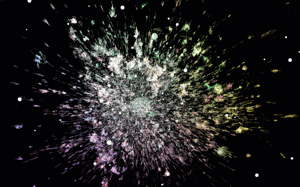
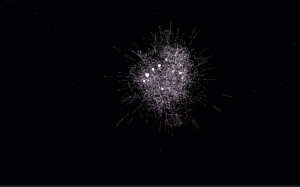
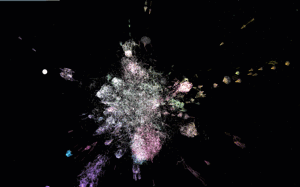
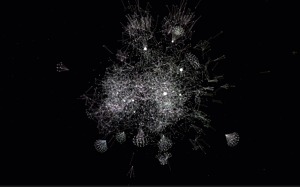
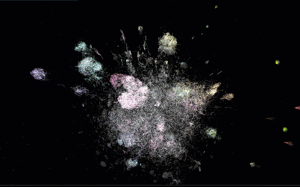
This repository combines visualizations of major software package managers.

All visualizations are available here: http://anvaka.github.io/pm/#/

Please read operating manual - it is short and describes basic navigation principles.

Repository was create for my talk at CascadiaJS 2015

After conference update - video - slides

Friends, you are awesome! I can't express how much I appreciate all your kind words and warm feedback. It really means a world for me. Thank you!

Individual Visualizations

Each graph is indexed individually, and data is pushed to gh-pages branch of galactic-data.

Bower
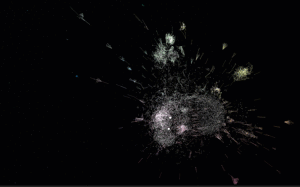

indexer | demo

PHP Composer


indexer | demo

Ruby gems


indexer | demo

npm


indexer | demo

Go


indexer | demo

R language


indexer | demo

Debian


indexer | demo

Arch Linux


indexer | demo

Arch Linux + AUR


indexer | demo

NuGet


indexer | demo

Homebrew


indexer | demo

PyPI


indexer | demo

Fedora


indexer | demo

Rust Crates


indexer | demo

Elm


indexer | demo

local development

git clone https://github.com/anvaka/pm
cd pm
npm i
npm start

This will start local development sever with auto-rebuild.

Your own graphs

This section has detailed instructions about how to use the tool with your own graphs. Before you read any further, if your graph is smaller than 10k nodes, consider using ngraph.pixel or VivaGraph both should be able to provide interactive layout.

If you have an interesting graph but don't have JavaScript experience, please feel free to reach out to me and I'll try to make visualization for you (my email is [email protected]).

Otherwise, if you want to hack on your own, please keep reading.

Graph

First, you will need a graph in ngraph.graph format. The ngraph.graph has detailed documentation about how to create graph, but it also has several loaders from popular graph formats (e.g. dot, gexf)

Layout

Now that you have a graph we need to compute the layout.

If your graph is smaller than 200k nodes, consider using ngraph.offline.layout. This module was created exactly for the purpose of the pm project, it is well documented, and should be easy to get started with. You can also read layout.js of all[gems|go|bower] packages to see more examples.

If your graph is much larger than 200k nodes, then consider using ngraph.native - this module is harder to work with (as it requires C++ knowledge), but it is much faster.

The secret GitHub visualization is using ngraph.native.

Data format

Once layout is computed, we are ready to visualize. Just save the graph using ngraph.tobinary and store it along with latest positions file (produced by layout) into a folder.

The folder structure should look like this:

.
└── my-pm-data-server
    └── my-graph
        ├── manifest.json
        └── version-1
            ├── labels.json         /* this file is produced by ngraph.tobinary */
            ├── links.bin           /* this file is produced by ngraph.tobinary */
            └── positions.bin       /* this file is produced by ngraph.native   */

The file manifest.json describes what version of the graph are available and has the following content:

{
  "all": ["version-1"],
  "last": "version-1"
}

Inside my-pm-data-server we launch a web server. I personally prefer http-server. Once it is installed globally (npm i http-server -g), you can launch it like this:

http-server --cors -p 9090

This will start a local data server at http://127.0.0.1:9090/

Update the config.js in this repository to point to your data server, and your graph should be accessible at

http://127.0.0.1:8081/#/galaxy/my-graph

Note

The galactic-data follows the same data structure as described above. Use it for the reference if you need an example

The secret visualization

The last shown visualization was secret GitHub followers visualization. It shows all GitHub users who has more than two followers.

The visualization has more than 1,100,000 nodes, and renders at 60 fps when flying around. The FPS drops when you hover-over nodes to 20-30, This is because we are doing hit-testing, to find what's under cursor.

With this many nodes, it runs well in the browser. Unfortunately it requires more than 1GB of RAM. Which may or may not crash your phone browser - sorry about this.

With all warnings said, here are the links:

Feedback

Please do not hesitate to provide your feedback or bug fixes. Even if it is something small like fixing a typo - I'd be glad to hear from you!

Owner
Andrei Kashcha
I love graphs
Andrei Kashcha
Print matplotlib colors

mplcolors Tired of searching "matplotlib colors" every week/day/hour? This simple script displays them all conveniently right in your terminal emulato

Brandon Barker 32 Dec 13, 2022
Data-FX is an addon for Blender (2.9) that allows for the visualization of data with different charts

Data-FX Data-FX is an addon for Blender (2.9) that allows for the visualization of data with different charts Currently, there are only 2 chart option

Landon Ferguson 20 Nov 21, 2022
A Simple Flask-Plotly Example for NTU 110-1 DSSI Class

A Simple Flask-Plotly Example for NTU 110-1 DSSI Class Live Demo Prerequisites We will use Flask and Ploty to build a Flask application. If you haven'

Ting Ni Wu 1 Dec 11, 2021
A GUI for Pandas DataFrames

About Demo Installation Usage Features More Info About PandasGUI is a GUI for viewing, plotting and analyzing Pandas DataFrames. Demo Installation Ins

Adam Rose 2.8k Dec 24, 2022
Certificate generating and sending system written in Python.

Certificate Generator & Sender How to use git clone https://github.com/saadhaxxan/Certificate-Generator-Sender.git cd Certificate-Generator-Sender Add

Saad Hassan 11 Dec 01, 2022
A Scheil-Gulliver simulation tool using pycalphad.

scheil A Scheil-Gulliver simulation tool using pycalphad. import matplotlib.pyplot as plt from pycalphad import Database, variables as v from scheil i

pycalphad 6 Dec 10, 2021
Create animated and pretty Pandas Dataframe or Pandas Series

Rich DataFrame Create animated and pretty Pandas Dataframe or Pandas Series, as shown below: Installation pip install rich-dataframe Usage Minimal exa

Khuyen Tran 92 Dec 26, 2022
Small project demonstrating the use of Grafana and InfluxDB for monitoring the speed of an internet connection

Speedtest monitor for Grafana A small project that allows internet speed monitoring using Grafana, InfluxDB 2 and Speedtest. Demo Requirements Docker

Joshua Ghali 3 Aug 06, 2021
Color scales in Python for humans

colorlover Color scales for humans IPython notebook: https://plot.ly/ipython-notebooks/color-scales/ import colorlover as cl from IPython.display impo

Plotly 146 Sep 25, 2022
PyFlow is a general purpose visual scripting framework for python

PyFlow is a general purpose visual scripting framework for python. State Base structure of program implemented, such things as packages disco

1.8k Jan 07, 2023
A Python wrapper of Neighbor Retrieval Visualizer (NeRV)

PyNeRV A Python wrapper of the dimensionality reduction algorithm Neighbor Retrieval Visualizer (NeRV) Compile Set up the paths in Makefile then make.

2 Aug 29, 2021
CLAHE Contrast Limited Adaptive Histogram Equalization

A simple code to process images using contrast limited adaptive histogram equalization. Image processing is becoming a major part of data processig.

Happy N. Monday 4 May 18, 2022
Drug design and development team HackBio internship is a virtual bioinformatics program that introduces students and professional to advanced practical bioinformatics and its applications globally.

-Nyokong. Drug design and development team HackBio internship is a virtual bioinformatics program that introduces students and professional to advance

4 Aug 04, 2022
Lime: Explaining the predictions of any machine learning classifier

lime This project is about explaining what machine learning classifiers (or models) are doing. At the moment, we support explaining individual predict

Marco Tulio Correia Ribeiro 10.3k Dec 29, 2022
Official Matplotlib cheat sheets

Official Matplotlib cheat sheets

Matplotlib Developers 6.7k Jan 09, 2023
Simple function to plot multiple barplots in the same figure.

Simple function to plot multiple barplots in the same figure. Supports padding and custom color.

Matthias Jakobs 2 Feb 21, 2022
Homework 2: Matplotlib and Data Visualization

Homework 2: Matplotlib and Data Visualization Overview These data visualizations were created for my introductory computer science course using Python

Sophia Huang 12 Oct 20, 2022
Visualization of numerical optimization algorithms

Visualization of numerical optimization algorithms

Zhengxia Zou 46 Dec 01, 2022
These data visualizations were created as homework for my CS40 class. I hope you enjoy!

Data Visualizations These data visualizations were created as homework for my CS40 class. I hope you enjoy! Nobel Laureates by their Country of Birth

9 Sep 02, 2022
Farhad Davaripour, Ph.D. 1 Jan 05, 2022