2D maze path solver visualizer implemented with python

Overview

Maze PathFinder Visualizer implemented in Python

How to use

Download:

git clone https://github.com/ss892714028/Maze-PathFinder-Visualization-Python

Install required Libraries

pip install -r requirements.txt

Settings

Go to config.py and change settings.

  • 'w': width of the board
  • 'h': height of the board
  • 'algo':'bfs' for Breadth first search
  • 'algo':'dfs' for Depth first search
  • 'algo':'astar' for A*

Run the visualization

python ./src/drawer.py
  • The first two left clicks on the board initialize start and end node
  • Click or click and drag to create obstacles
  • Press space bar and see the algorithm takes off!

Symbols

  • "@": Start and end node
  • "#": Obstacles
  • "*": Visited node
  • "+": Path

Contributions

All contributions are welcome. :)

Algorithm Implemented

  • BFS (unweighted Dijastra)
  • DFS
  • ASTAR (A*)

Breadth First Search (unweighted Dijkstra)

Breadth First Search is unweighted and guarantee a optimal path. BFS

Depth First Search

Depth First Search is unweighted and does not guarantee a optimal path. DFS

Astar (A*)

A* is weighted and guarantee a optimal path.
A* easy A*

You might also like...
A python visualization of the A* path finding algorithm

A python visualization of the A* path finding algorithm. It allows you to pick your start, end location and make obstacles and then view the process of finding the shortest path. You can also choose to include or exclude diagonal movement.

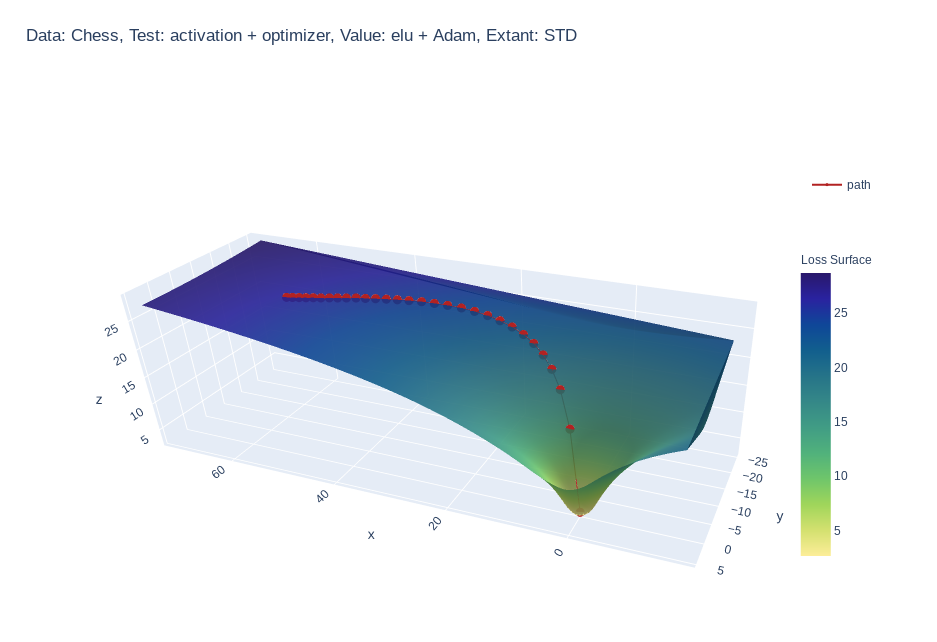
Create 3d loss surface visualizations, with optimizer path. Issues welcome!

MLVTK A loss surface visualization tool Simple feed-forward network trained on chess data, using elu activation and Adam optimizer Simple feed-forward

Fastest Gephi's ForceAtlas2 graph layout algorithm implemented for Python and NetworkX

ForceAtlas2 for Python A port of Gephi's Force Atlas 2 layout algorithm to Python 2 and Python 3 (with a wrapper for NetworkX and igraph). This is the

The visual framework is designed on the idea of module and implemented by mixin method

Visual Framework The visual framework is designed on the idea of module and implemented by mixin method. Its biggest feature is the mixins module whic

Simple plotting for Python. Python wrapper for D3xter - render charts in the browser with simple Python syntax.

PyDexter Simple plotting for Python. Python wrapper for D3xter - render charts in the browser with simple Python syntax. Setup $ pip install PyDexter

Visual Python is a GUI-based Python code generator, developed on the Jupyter Notebook environment as an extension.

Visual Python is a GUI-based Python code generator, developed on the Jupyter Notebook environment as an extension.

A Python Binder that merge 2 files with any extension by creating a new python file and compiling it to exe which runs both payloads.

Update ! ANONFILE MIGHT NOT WORK ! About A Python Binder that merge 2 files with any extension by creating a new python file and compiling it to exe w

Declarative statistical visualization library for Python

Altair http://altair-viz.github.io Altair is a declarative statistical visualization library for Python. With Altair, you can spend more time understa

Interactive Data Visualization in the browser, from  Python
Interactive Data Visualization in the browser, from Python

Bokeh is an interactive visualization library for modern web browsers. It provides elegant, concise construction of versatile graphics, and affords hi

Releases(v0.1)
python partial dependence plot toolbox

PDPbox python partial dependence plot toolbox Motivation This repository is inspired by ICEbox. The goal is to visualize the impact of certain feature

Li Jiangchun 723 Jan 07, 2023
Pydrawer: The Python package for visualizing curves and linear transformations in a super simple way

pydrawer 📐 The Python package for visualizing curves and linear transformations in a super simple way. ✏️ Installation Install pydrawer package with

Dylan Tintenfich 56 Dec 30, 2022
Sci palettes for matplotlib/seaborn

sci palettes for matplotlib/seaborn Installation python3 -m pip install sci-palettes Usage import seaborn as sns import matplotlib.pyplot as plt impor

Qingdong Su 2 Jun 07, 2022
Generate a 3D Skyline in STL format and a OpenSCAD file from Gitlab contributions

Your Gitlab's contributions in a 3D Skyline gitlab-skyline is a Python command to generate a skyline figure from Gitlab contributions as Github did at

Félix Gómez 70 Dec 22, 2022
Investment and risk technologies maintained by Fortitudo Technologies.

Fortitudo Technologies Open Source This package allows you to freely explore open-source implementations of some of our fundamental technologies under

Fortitudo Technologies 11 Dec 14, 2022
Simple and fast histogramming in Python accelerated with OpenMP.

pygram11 Simple and fast histogramming in Python accelerated with OpenMP with help from pybind11. pygram11 provides functions for very fast histogram

Doug Davis 28 Dec 14, 2022
Designed a greedy algorithm based on Markov sequential decision-making process in MATLAB/Python to optimize using Gurobi solver

Designed a greedy algorithm based on Markov sequential decision-making process in MATLAB/Python to optimize using Gurobi solver, the wheel size, gear shifting sequence by modeling drivetrain constrai

Sabbella Prasanna 1 Jan 11, 2022
Jupyter Notebook extension leveraging pandas DataFrames by integrating DataTables and ChartJS.

Jupyter DataTables Jupyter Notebook extension to leverage pandas DataFrames by integrating DataTables JS. About Data scientists and in fact many devel

Marek Čermák 142 Dec 28, 2022
a plottling library for python, based on D3

Hello August 2013 Hello! Maybe you're looking for a nice Python interface to build interactive, javascript based plots that look as nice as all those

Mike Dewar 1.4k Dec 28, 2022
Python package for the analysis and visualisation of finite-difference fields.

discretisedfield Marijan Beg1,2, Martin Lang2, Samuel Holt3, Ryan A. Pepper4, Hans Fangohr2,5,6 1 Department of Earth Science and Engineering, Imperia

ubermag 12 Dec 14, 2022
A gui application to visualize various sorting algorithms using pure python.

Sorting Algorithm Visualizer A gui application to visualize various sorting algorithms using pure python. Language : Python 3 Libraries required Tkint

Rajarshi Banerjee 19 Nov 30, 2022
Extract data from ThousandEyes REST API and visualize it on your customized Grafana Dashboard.

ThousandEyes Grafana Dashboard Extract data from the ThousandEyes REST API and visualize it on your customized Grafana Dashboard. Deploy Grafana, Infl

Flo Pachinger 16 Nov 26, 2022
Mattia Ficarelli 2 Mar 29, 2022
A simple Monte Carlo simulation using Python and matplotlib library

Monte Carlo python simulation Install linux dependencies sudo apt update sudo apt install build-essential \ software-properties-commo

Samuel Terra 2 Dec 13, 2021
Visualize the bitcoin blockchain from your local node

Project Overview A new feature in Bitcoin Core 0.20 allows users to dump the state of the blockchain (the UTXO set) using the command dumptxoutset. I'

18 Sep 11, 2022
A Python Library for Self Organizing Map (SOM)

SOMPY A Python Library for Self Organizing Map (SOM) As much as possible, the structure of SOM is similar to somtoolbox in Matlab. It has the followin

Vahid Moosavi 497 Dec 29, 2022
Lumen provides a framework for visual analytics, which allows users to build data-driven dashboards from a simple yaml specification

Lumen project provides a framework for visual analytics, which allows users to build data-driven dashboards from a simple yaml specification

HoloViz 120 Jan 04, 2023
Manim is an animation engine for explanatory math videos.

A community-maintained Python framework for creating mathematical animations.

12.4k Dec 30, 2022
Cryptocurrency Centralized Exchange Visualization

This is a simple one that uses Grafina to visualize cryptocurrency from the Bitkub exchange. This service will make a request to the Bitkub API from your wallet and save the response to Postgresql. G

Popboon Mahachanawong 1 Nov 24, 2021
阴阳师后台全平台(使用网易 MuMu 模拟器)辅助。支持御魂,觉醒,御灵,结界突破,秘闻副本,地域鬼王。

阴阳师后台全平台辅助 Python 版本:Python 3.8.3 模拟器:网易 MuMu | 雷电模拟器 模拟器分辨率:1024*576 显卡渲染模式:兼容(OpenGL) 兼容 Windows 系统和 MacOS 系统 思路: 利用 adb 截图后,使用 opencv 找图找色,模拟点击。使用

简讯 27 Jul 09, 2022