26 Repositories
Latest Python Libraries

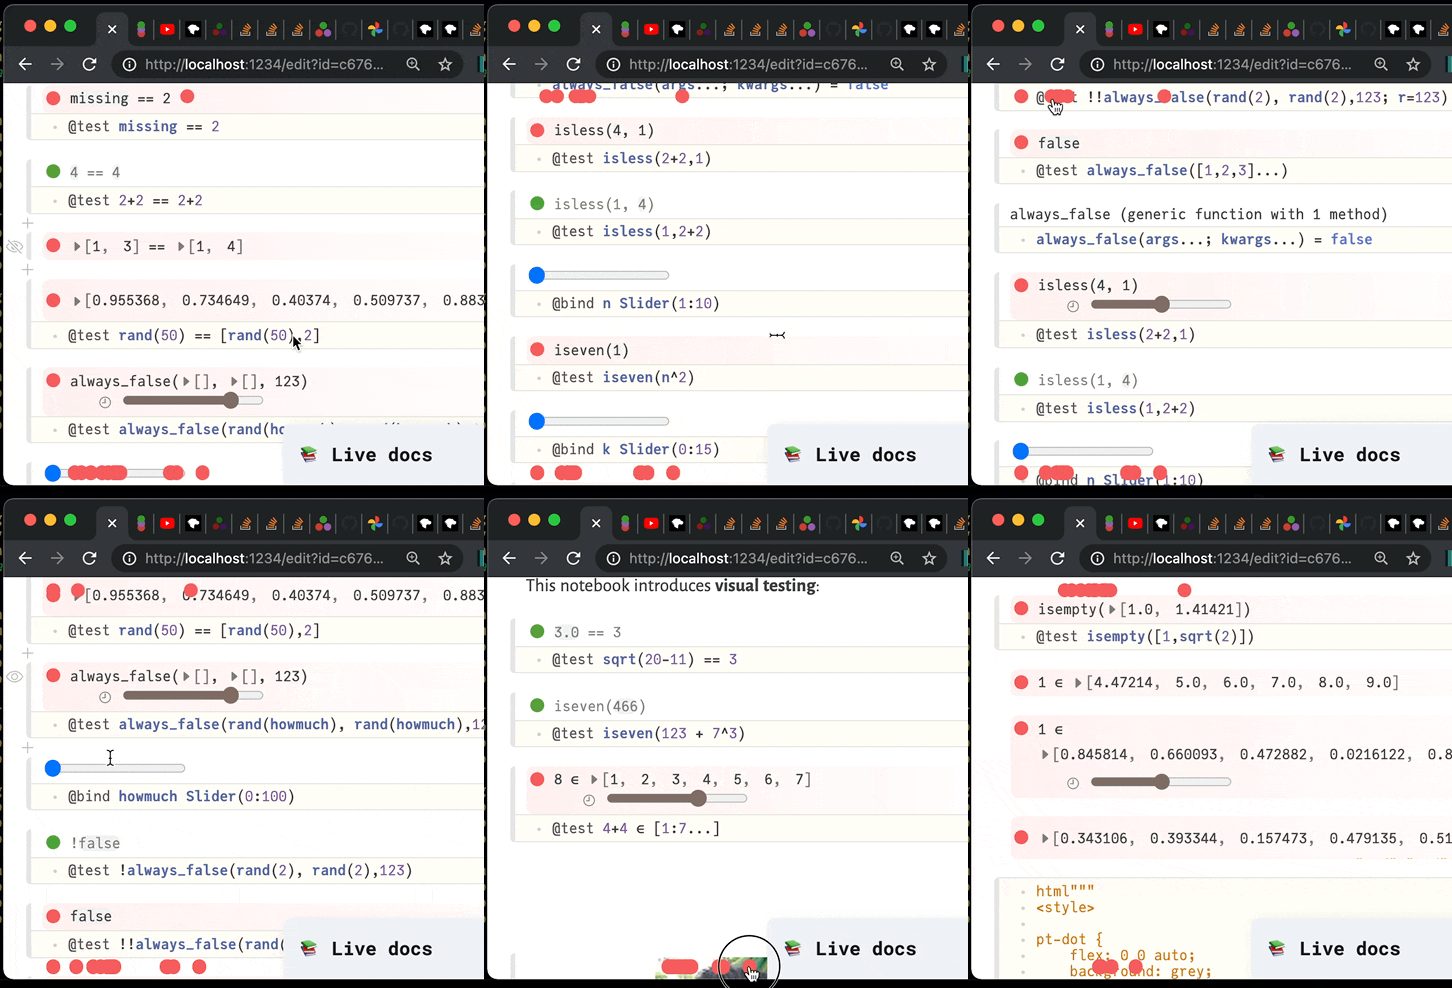
✔️ Visual, reactive testing library for Julia. Time machine included.
PlutoTest.jl (alpha release) Visual, reactive testing library for Julia A macro @test that you can use to verify your code's correctness. But instead
A simple rubber duck debugger
Rubber Duck Debugger I found myself many times asking a question on StackOverflow or to one of my colleagues just for finding the solution simply by d
Exports the local variables into a global dictionary for later debugging.
PyExfiltrator Julia’s @exfiltrate for Python; Exports the local variables into a global dictionary for later debugging. Installation pip install pyexf
Graphical Python debugger which lets you easily view the values of all evaluated expressions
birdseye birdseye is a Python debugger which records the values of expressions in a function call and lets you easily view them after the function exi
A powerful set of Python debugging tools, based on PySnooper
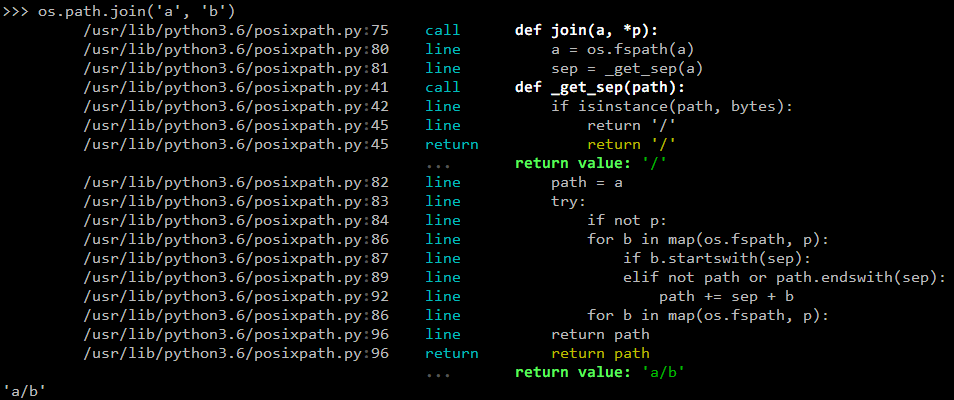
snoop snoop is a powerful set of Python debugging tools. It's primarily meant to be a more featureful and refined version of PySnooper. It also includ

Middleware that Prints the number of DB queries to the runserver console.
Django Querycount Inspired by this post by David Szotten, this project gives you a middleware that prints DB query counts in Django's runserver consol
Tools for analyzing Java JVM gc log files
gc_log This package consists of two separate utilities useful for : gc_log_visualizer.py regionsize.py GC Log Visualizer This was updated to run under

HMLLDB is a collection of LLDB commands to assist in the debugging of iOS apps.
HMLLDB is a collection of LLDB commands to assist in the debugging of iOS apps. 中文介绍 Features Non-intrusive. Your iOS project does not need to be modi

Debugging-friendly exceptions for Python
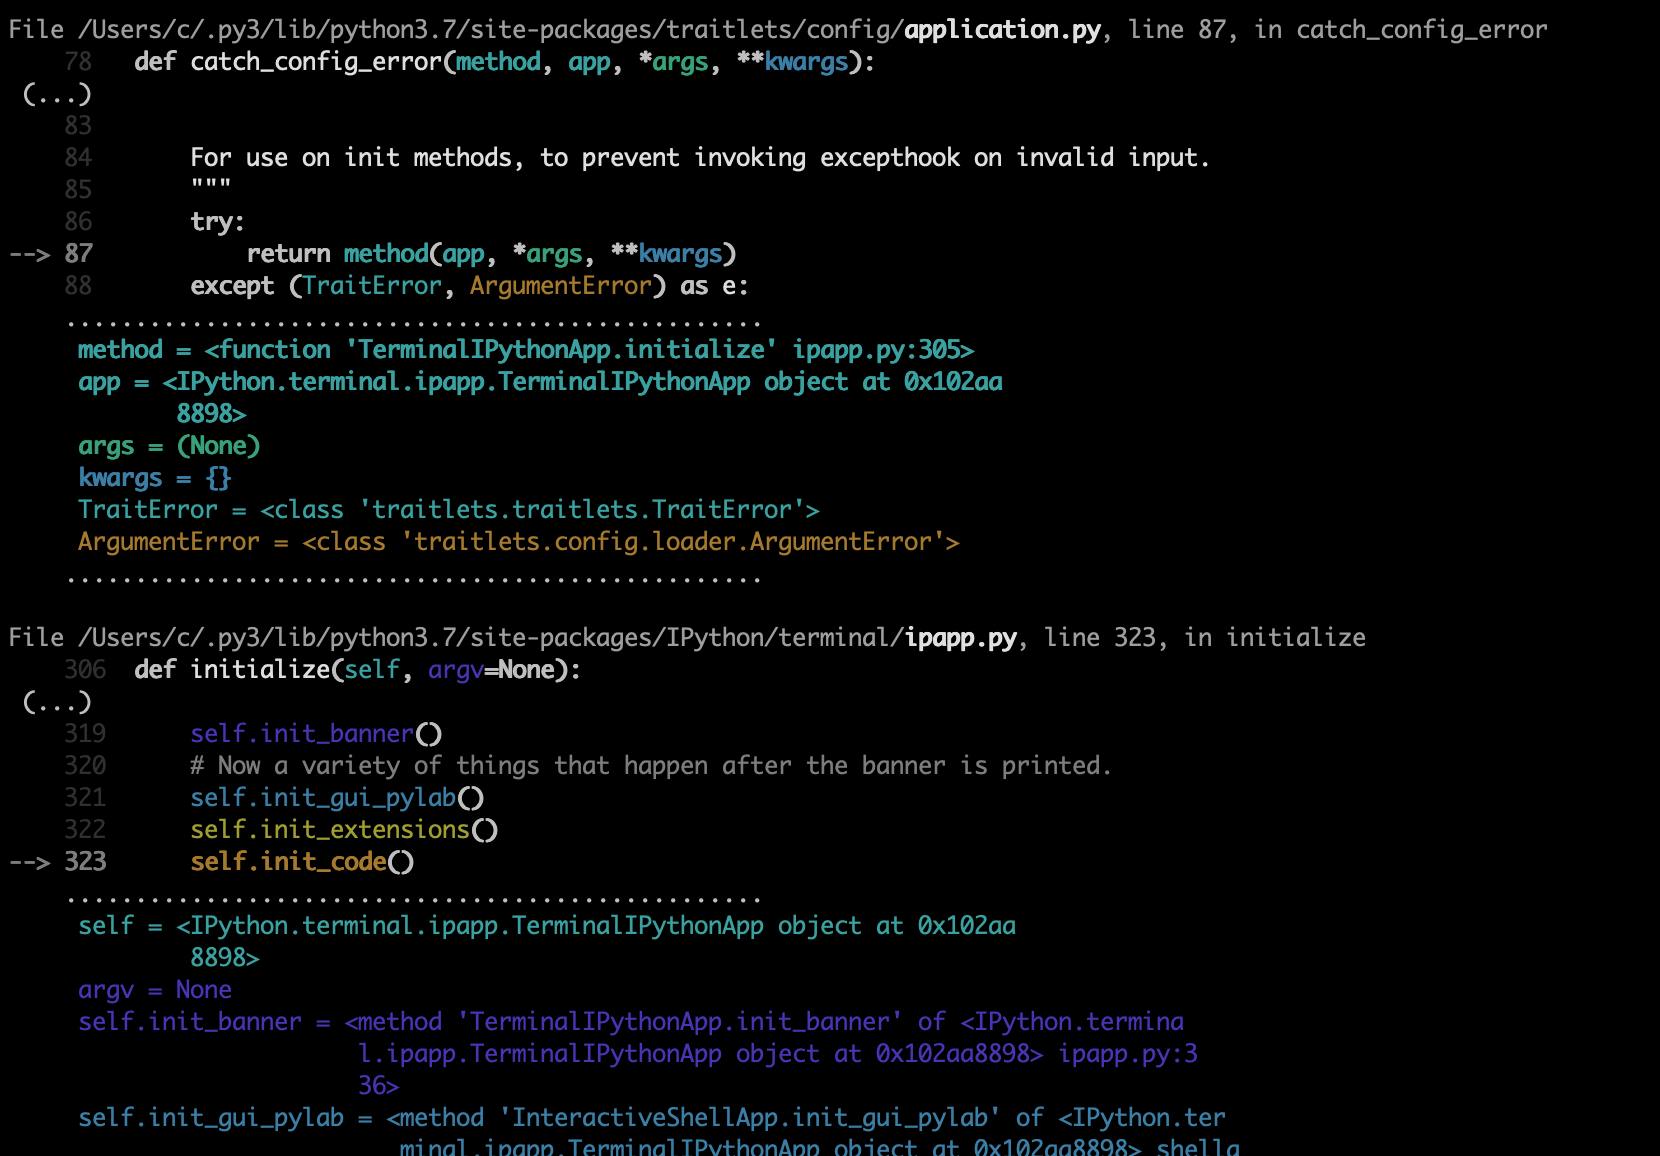
Better tracebacks This is a more helpful version of Python's built-in exception message: It shows more code context and the current values of nearby v
Code for the paper TestRank: Bringing Order into Unlabeled Test Instances for Deep Learning Tasks
TestRank in Pytorch Code for the paper TestRank: Bringing Order into Unlabeled Test Instances for Deep Learning Tasks by Yu Li, Min Li, Qiuxia Lai, Ya

VizTracer is a low-overhead logging/debugging/profiling tool that can trace and visualize your python code execution.
VizTracer is a low-overhead logging/debugging/profiling tool that can trace and visualize your python code execution.
🍦 Never use print() to debug again.
IceCream -- Never use print() to debug again Do you ever use print() or log() to debug your code? Of course you do. IceCream, or ic for short, makes p

As easy as /aitch-tee-tee-pie/ 🥧 Modern, user-friendly command-line HTTP client for the API era. JSON support, colors, sessions, downloads, plugins & more. https://twitter.com/httpie
HTTPie: human-friendly CLI HTTP client for the API era HTTPie (pronounced aitch-tee-tee-pie) is a command-line HTTP client. Its goal is to make CLI in
GEF (GDB Enhanced Features) - a modern experience for GDB with advanced debugging features for exploit developers & reverse engineers ☢
GEF (GDB Enhanced Features) - a modern experience for GDB with advanced debugging features for exploit developers & reverse engineers ☢

Hunter is a flexible code tracing toolkit.
Overview docs tests package Hunter is a flexible code tracing toolkit, not for measuring coverage, but for debugging, logging, inspection and other ne
Debugging manhole for python applications.
Overview docs tests package Manhole is in-process service that will accept unix domain socket connections and present the stacktraces for all threads
Remote vanilla PDB (over TCP sockets) done right: no extras, proper handling around connection failures and CI.
Overview docs tests package Remote vanilla PDB (over TCP sockets) done right: no extras, proper handling around connection failures and CI. Based on p

Yaml - Loggers are like print() statements
Upgrade your print statements Loggers are like print() statements except they also include loads of other metadata: timestamp msg (same as print!) arg

As easy as /aitch-tee-tee-pie/ 🥧 Modern, user-friendly command-line HTTP client for the API era. JSON support, colors, sessions, downloads, plugins & more. https://twitter.com/httpie
HTTPie: human-friendly CLI HTTP client for the API era HTTPie (pronounced aitch-tee-tee-pie) is a command-line HTTP client. Its goal is to make CLI in

A simple wrapper to analyse and visualise reinforcement learning agents' behaviour in the environment.
Visrl Visrl (pronounced "visceral") is a simple wrapper to analyse and visualise reinforcement learning agents' behaviour in the environment. Reinforc

Cyberbrain: Python debugging, redefined.
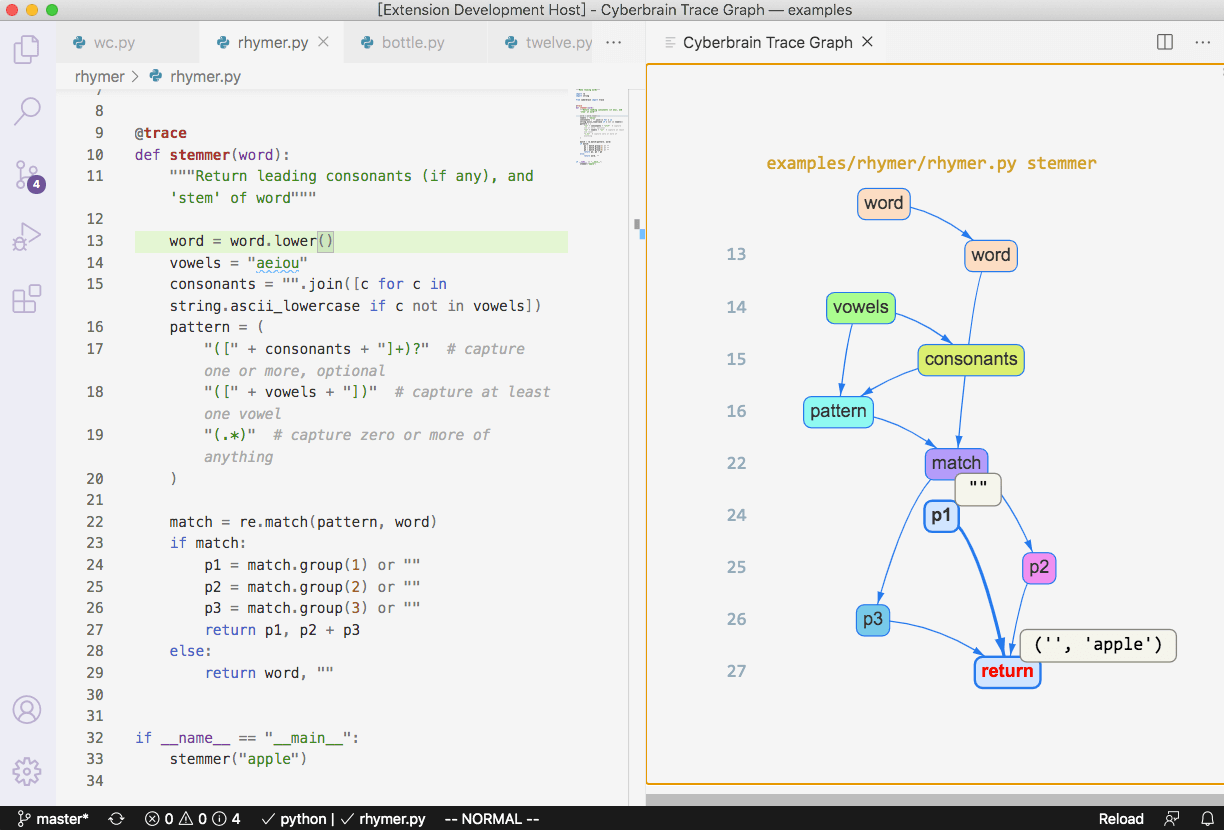
Cyberbrain1(电子脑) aims to free programmers from debugging.
Inject code into running Python processes
pyrasite Tools for injecting arbitrary code into running Python processes. homepage: http://pyrasite.com documentation: http://pyrasite.rtfd.org downl

Debugging, monitoring and visualization for Python Machine Learning and Data Science
Welcome to TensorWatch TensorWatch is a debugging and visualization tool designed for data science, deep learning and reinforcement learning from Micr
🏆 A ranked list of awesome python developer tools and libraries. Updated weekly.
Best-of Python Developer Tools 🏆 A ranked list of awesome python developer tools and libraries. Updated weekly. This curated list contains 250 awesom
The goal of this library is to generate more helpful exception messages for numpy/pytorch matrix algebra expressions.
Tensor Sensor See article Clarifying exceptions and visualizing tensor operations in deep learning code. One of the biggest challenges when writing co

Sweeter debugging and benchmarking Python programs.
Do you ever use print() or log() to debug your code? If so, ycecream, or y for short, will make printing debug information a lot sweeter. And on top o