Cyberbrain: Python debugging, redefined.


Cyberbrain1(电子脑) aims to free programmers from debugging. It lets you:
-
Backtrace variable changes.
-
See every state of program execution, including variables' values
-
Debug loops with confidence.
Never spend hours stepping through a program, let Cyberbrain tell you what happened.
Read more about existing features, and roadmaps for features to come.
I gave a talk at PyCascades 2021 about Cyberbrain, watch it here.
Install
Cyberbrain consists of a Python library and various editor/IDE integrations. Currently it supports VS Code and Gitpod. See our plan on expanding the support.
To install Cyberbrain:
pip install cyberbrain
code --install-extension laike9m.cyberbrain
You can also install from PyPI , VS Code marketplace or Open VSX .
Or, you can try Cyberbrain online:

How to Use
Suppose you want to trace a function foo, just decorate it with @trace:
from cyberbrain import trace

# As of now, you can only have one @trace decorator in the whole program.
# We may change this in version 2.0, see https://github.com/laike9m/Cyberbrain/discussions/73

@trace  # Disable tracing with `@trace(disabled=True)`
def foo():
    ...
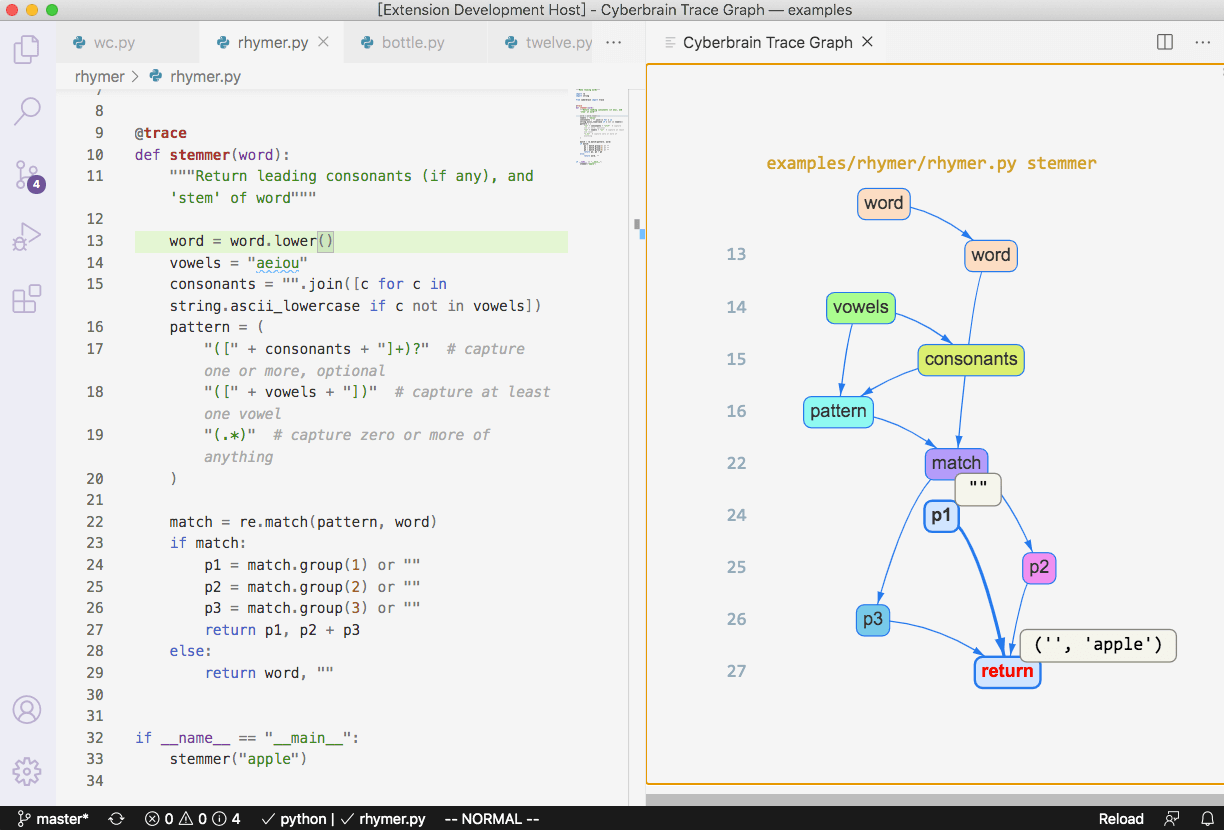
Cyberbrain keeps your workflow unchanged. You run a program (from vscode or command line, both work), and a new panel will be opened to visualize how your program executed.
The following gif demonstrates the workflow (click to view the full size image):

Read our documentation to learn more about Cyberbrain's features and limitations.
- Cyberbrain may conflict with other debuggers. If you set breakpoints and use VSC's debugger, Cyberbrain may not function normally. Generally speaking, prefer "Run Without Debugging" (like shown in the gif).
- If you have multiple VS Code window opened, the trace graph will always be created in the first one. #72 is tracking this issue.
- When having multiple decorators, you should put
@traceas the innermost one.@app.route("/") @trace def hello_world(): x = [1, 2, 3] return "Hello, World!"
Roadmaps
Updated 2020.11
Cyberbrain is new and under active development, bugs are expected. If you met any, please create an issue. At this point, you should NOT use Cyberbrain in production. We'll release 1.0 when it's ready for production.
Major features planned for future versions are listed below. It may change over time.
| Version | Features |
|---|---|
| 1.0 | Code & trace interaction (#7), API specification |
| 2.0 | Multi-frame tracing ( |
| 3.0 | async support, remote debugging |
| 4.0 | Fine-grained symbol tracing |
| 5.0 | Multi-threading support |
Visit the project's kanban to learn more about the current development schedule.
How does it compare to other tools?
PySnooper
PySnooper and Cyberbrain share the same goal of reducing programmers' work while debugging, with a fundamental difference: Cyberbrain traces and shows the sources of each variable change, while PySnooper only logs them. The differences should be pretty obvious after you tried both.Debug Visualizer
Debug visualizer and Cyberbrain have different goals. Debug visualizer visualizes data structures, while Cyberbrain visualizes program execution (but also lets you inspect values).Python Tutor
Python Tutor is for education purposes, you can't use it to debug your own programs. It's a brilliant tool for its purpose and I do it like it very much.Community
-
💬 GitHub Discussions (for general discussions) -
🤖 Discord (for more instant discussions. I'm happy to chat any time!) -
🐦 Twitter @PyCyberbrain (for announcements)
Interested in Contributing?
See the development guide. This project follows the all-contributors specification. Contributions of ANY kind welcome!
Thanks goes to these wonderful contributors
 laixintao |
 yihong |
 dingge2016 |
 Frost Ming |
 林玮 (Jade Lin) |
 Alex Hall |
 inkuang |
 Siyuan Xu |
 Ram Rachum |
 foo bar |
Support
I'm almost working full time (besides my regular job) on Cyberbrain. This project is huge, complicated and will last for years, however it will reshape how people think and do debugging. That's why I need your support. Let's make it the best Python debugging tool

1: The name of this project originates from Ghost in the Shell, quote:
Cyberization is the process whereby a normal brain is physically integrated with electronic components to produce an augmented organ referred to as a cyberbrain.

 32.9k Dec 31, 2022
 2.7k Jan 08, 2023
 1.3k Dec 15, 2022
 2 Dec 10, 2021
 5k Jan 08, 2023
 837 Dec 29, 2022
 687 Nov 20, 2022
 332 Dec 07, 2022
 1 Nov 16, 2021
 21 Nov 27, 2022
 3.6k Jan 06, 2023
 24 Oct 13, 2021
 126 Nov 24, 2022
 1k Jan 02, 2023
 16 May 21, 2022
 1.1k Jan 05, 2023
 1.6k Dec 09, 2022
 3k Jan 07, 2023
 874 Jan 08, 2023
 5.2k Jan 01, 2023