Render Jupyter notebook in the terminal

Overview

jut - JUpyter notebook Terminal viewer.

The command line tool view the IPython/Jupyter notebook in the terminal.

Install

pip install jut

Usage

$jut --help
Usage: jut [OPTIONS]

Options:
  -u, --url TEXT             Render the ipynb file from the URL
  -i, --input-file FILENAME  File from the local file-system
  -h, --head INTEGER         Display first n cells. Default is 10
  -t, --tail INTEGER         Display last n cells
  -p, --single-page          Should the result be in a single page?
  -f, --full-display         Should all the contents in the file displayed?
  --help                     Show this message and exit.
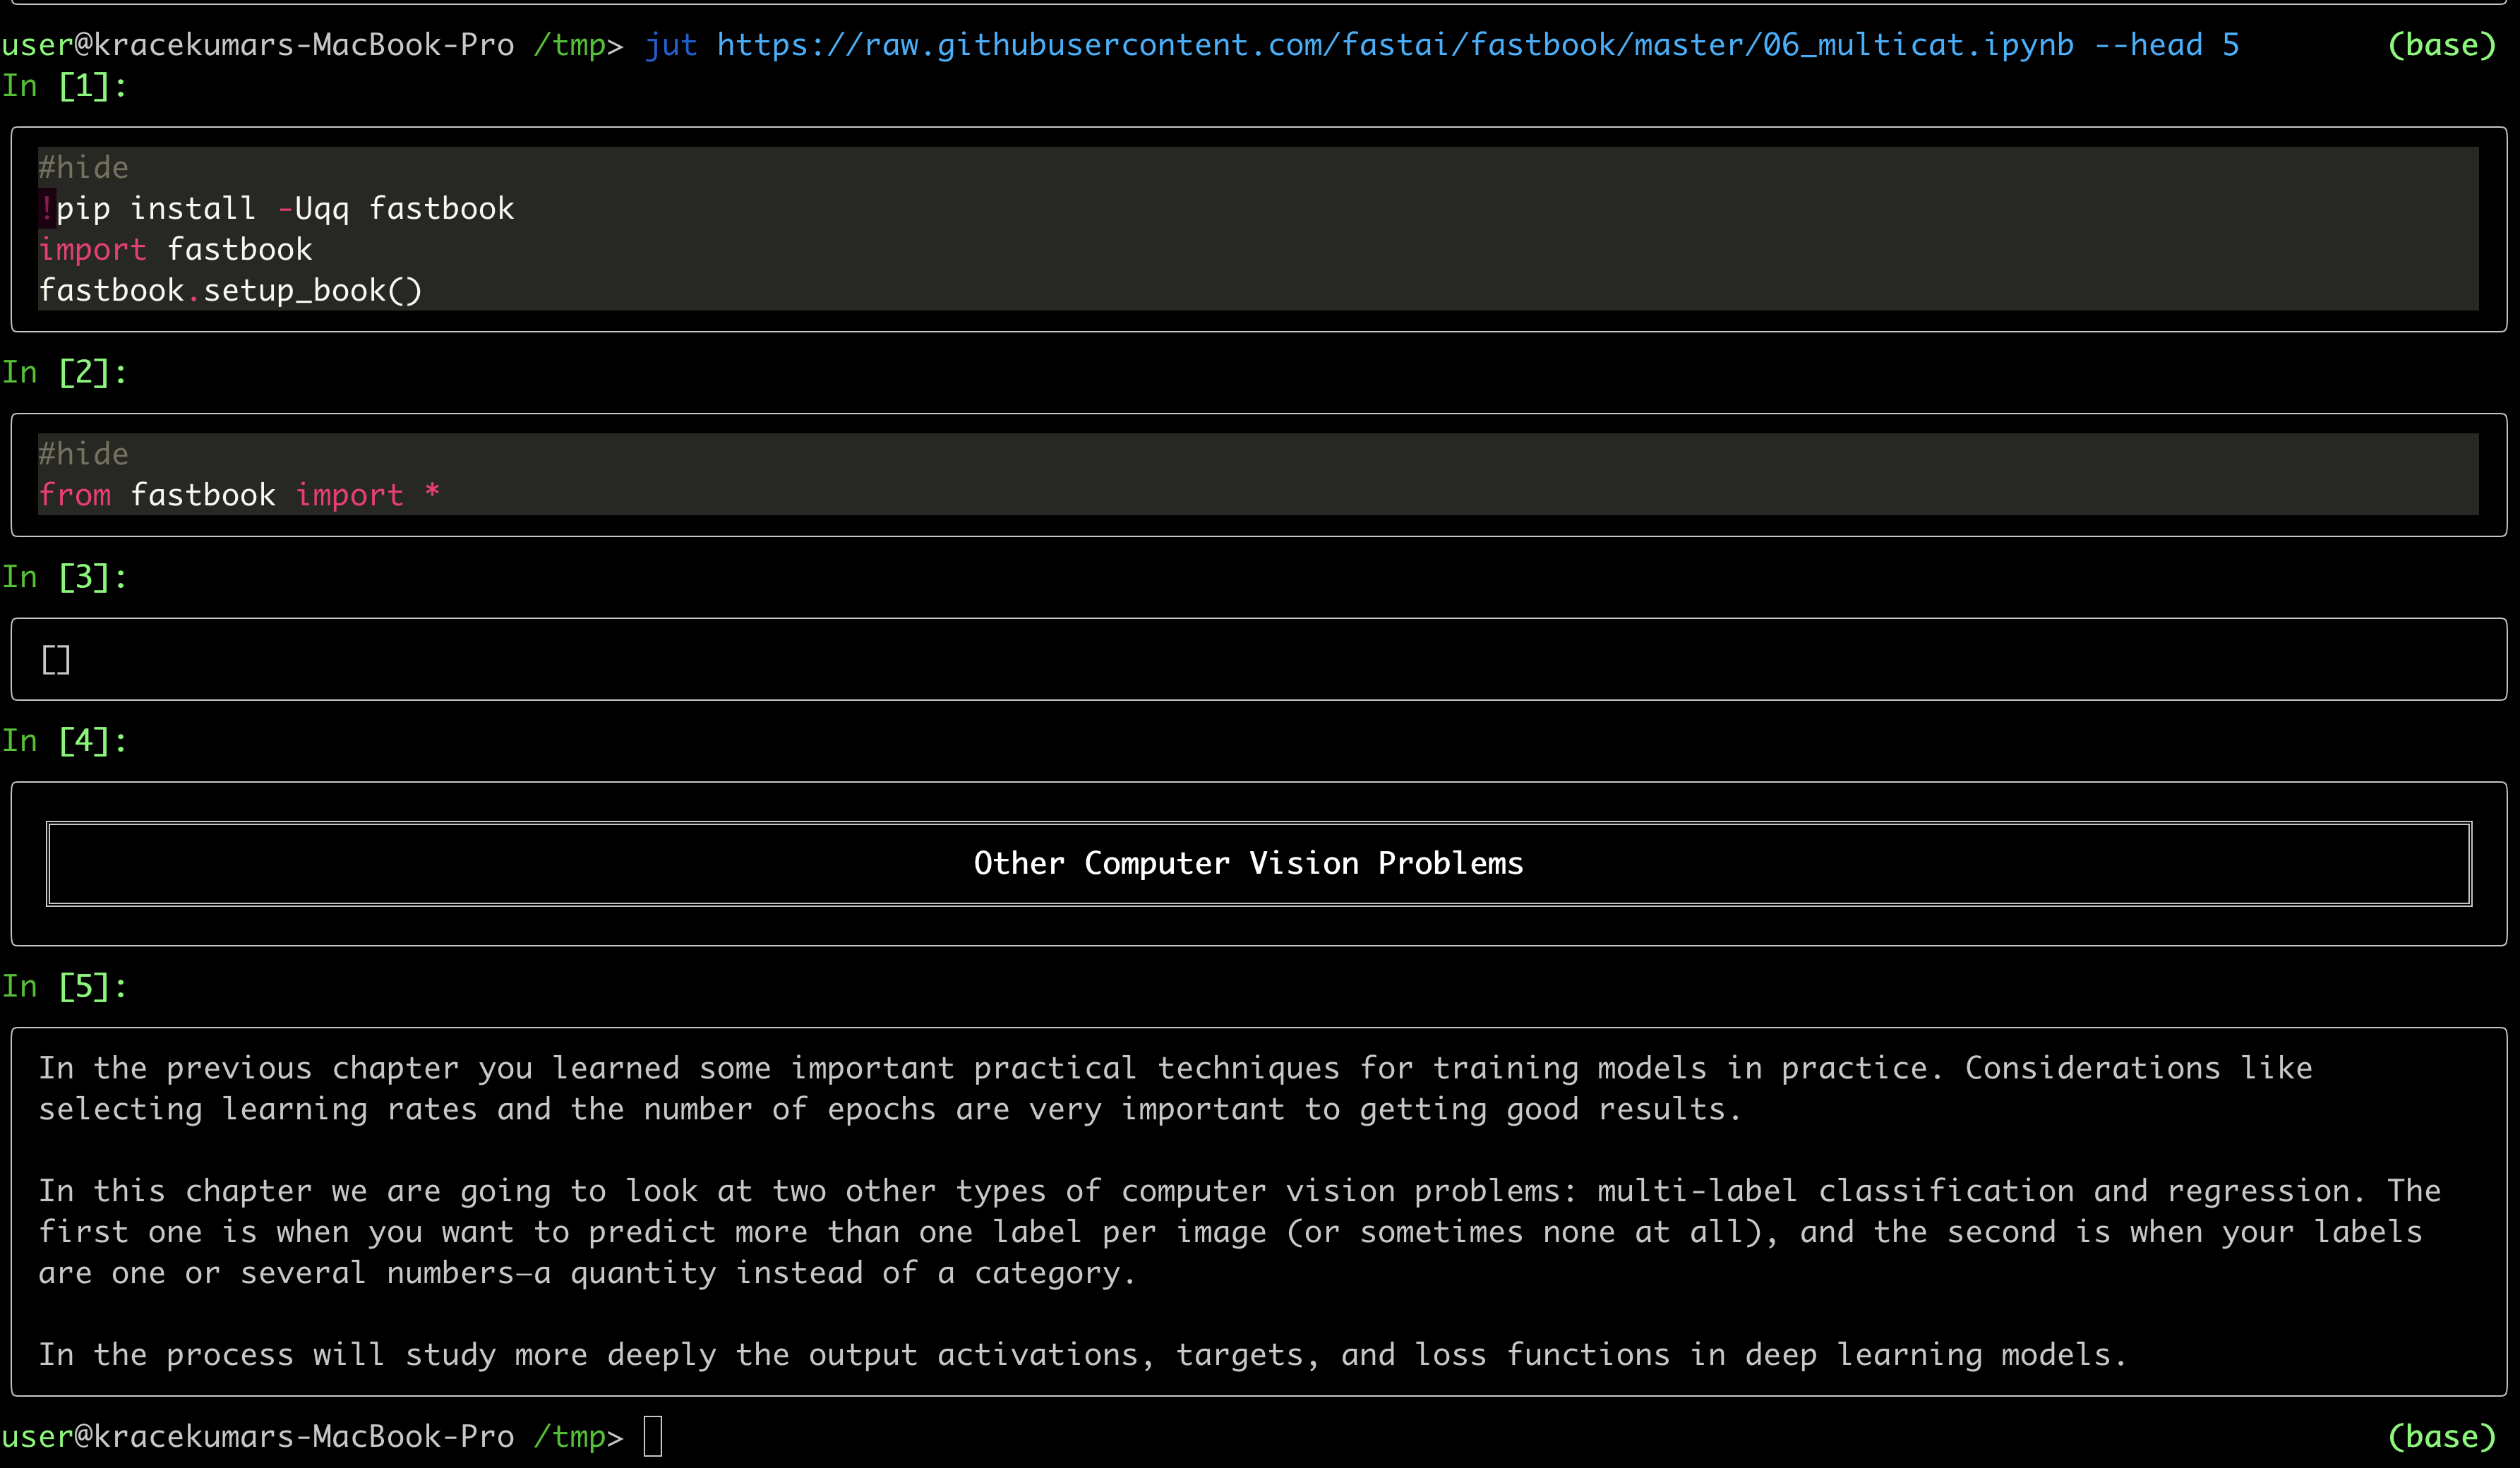
ASCIICinema Demo

asciicast

Display first five cells

jut-head-example

Display last five cells

jut-tail-example

Download the file and display first five cells

jut-download-url

Owner
Kracekumar
Server side guy specializing in Python. I am interested in back-end technologies, machine learning, automation, systems and performance.
Kracekumar
A data visualization curriculum of interactive notebooks.

A data visualization curriculum of interactive notebooks, using Vega-Lite and Altair. This repository contains a series of Python-based Jupyter notebooks.

UW Interactive Data Lab 1.2k Dec 30, 2022
This repository contains a streaming Dataflow pipeline written in Python with Apache Beam, reading data from PubSub.

Sample streaming Dataflow pipeline written in Python This repository contains a streaming Dataflow pipeline written in Python with Apache Beam, readin

Israel Herraiz 9 Mar 18, 2022
Domain Connectivity Analysis Tools to analyze aggregate connectivity patterns across a set of domains during security investigations

DomainCAT (Domain Connectivity Analysis Tool) Domain Connectivity Analysis Tool is used to analyze aggregate connectivity patterns across a set of dom

DomainTools 34 Dec 09, 2022
Create Badges with stats of Scratch User, Project and Studio. Use those badges in Github readmes, etc.

Scratch-Stats-Badge Create customized Badges with stats of Scratch User, Studio or Project. Use those badges in Github readmes, etc. Examples Document

Siddhesh Chavan 5 Aug 28, 2022
Simple plotting for Python. Python wrapper for D3xter - render charts in the browser with simple Python syntax.

PyDexter Simple plotting for Python. Python wrapper for D3xter - render charts in the browser with simple Python syntax. Setup $ pip install PyDexter

D3xter 31 Mar 06, 2021
Peloton Stats to Google Sheets with Data Visualization through Seaborn and Plotly

Peloton Stats to Google Sheets with Data Visualization through Seaborn and Plotly Problem: 2 peloton users were looking for a way to track their metri

9 Jul 22, 2022
Handout for the tutorial "Creating publication-quality figures with matplotlib"

Handout for the tutorial "Creating publication-quality figures with matplotlib"

JB Mouret 1.9k Jan 02, 2023
Visual Python is a GUI-based Python code generator, developed on the Jupyter Notebook environment as an extension.

Visual Python is a GUI-based Python code generator, developed on the Jupyter Notebook environment as an extension.

Visual Python 564 Jan 03, 2023
a plottling library for python, based on D3

Hello August 2013 Hello! Maybe you're looking for a nice Python interface to build interactive, javascript based plots that look as nice as all those

Mike Dewar 1.4k Dec 28, 2022
The Metabolomics Integrator (MINT) is a post-processing tool for liquid chromatography-mass spectrometry (LCMS) based metabolomics.

MINT (Metabolomics Integrator) The Metabolomics Integrator (MINT) is a post-processing tool for liquid chromatography-mass spectrometry (LCMS) based m

Sören Wacker 0 May 04, 2022
Open-source demos hosted on Dash Gallery

Dash Sample Apps This repository hosts the code for over 100 open-source Dash apps written in Python or R. They can serve as a starting point for your

Plotly 2.7k Jan 07, 2023
Insert SVGs into matplotlib

Insert SVGs into matplotlib

Andrew White 35 Dec 29, 2022
A simple project on Data Visualization for CSCI-40 course.

Simple-Data-Visualization A simple project on Data Visualization for CSCI-40 course - the instructions can be found here SAT results in New York in 20

Hugo Matousek 8 Oct 27, 2021
Streamlit-template - A streamlit app template based on streamlit-option-menu

streamlit-template A streamlit app template for geospatial applications based on

Qiusheng Wu 41 Dec 10, 2022
python partial dependence plot toolbox

PDPbox python partial dependence plot toolbox Motivation This repository is inspired by ICEbox. The goal is to visualize the impact of certain feature

Li Jiangchun 723 Jan 07, 2023
Create charts with Python in a very similar way to creating charts using Chart.js

Create charts with Python in a very similar way to creating charts using Chart.js. The charts created are fully configurable, interactive and modular and are displayed directly in the output of the t

Nicolas H 68 Dec 08, 2022
Visualise top-rated GitHub repositories in a barchart by keyword

This python script was written for simple purpose -- to visualise top-rated GitHub repositories in a barchart by keyword. Script generates html-page with barchart and information about repository own

Cur1iosity 2 Feb 07, 2022
Plotting library for IPython/Jupyter notebooks

bqplot 2-D plotting library for Project Jupyter Introduction bqplot is a 2-D visualization system for Jupyter, based on the constructs of the Grammar

3.4k Dec 30, 2022
Generate a roam research like Network Graph view from your Notion pages.

Notion Graph View Export Notion pages to a Roam Research like graph view.

Steve Sun 214 Jan 07, 2023
Fast 1D and 2D histogram functions in Python

About Sometimes you just want to compute simple 1D or 2D histograms with regular bins. Fast. No nonsense. Numpy's histogram functions are versatile, a

Thomas Robitaille 237 Dec 18, 2022