Sentiment Analysis application created with Python and Dash, hosted at socialsentiment.net

Overview

Social Sentiment Dash Application

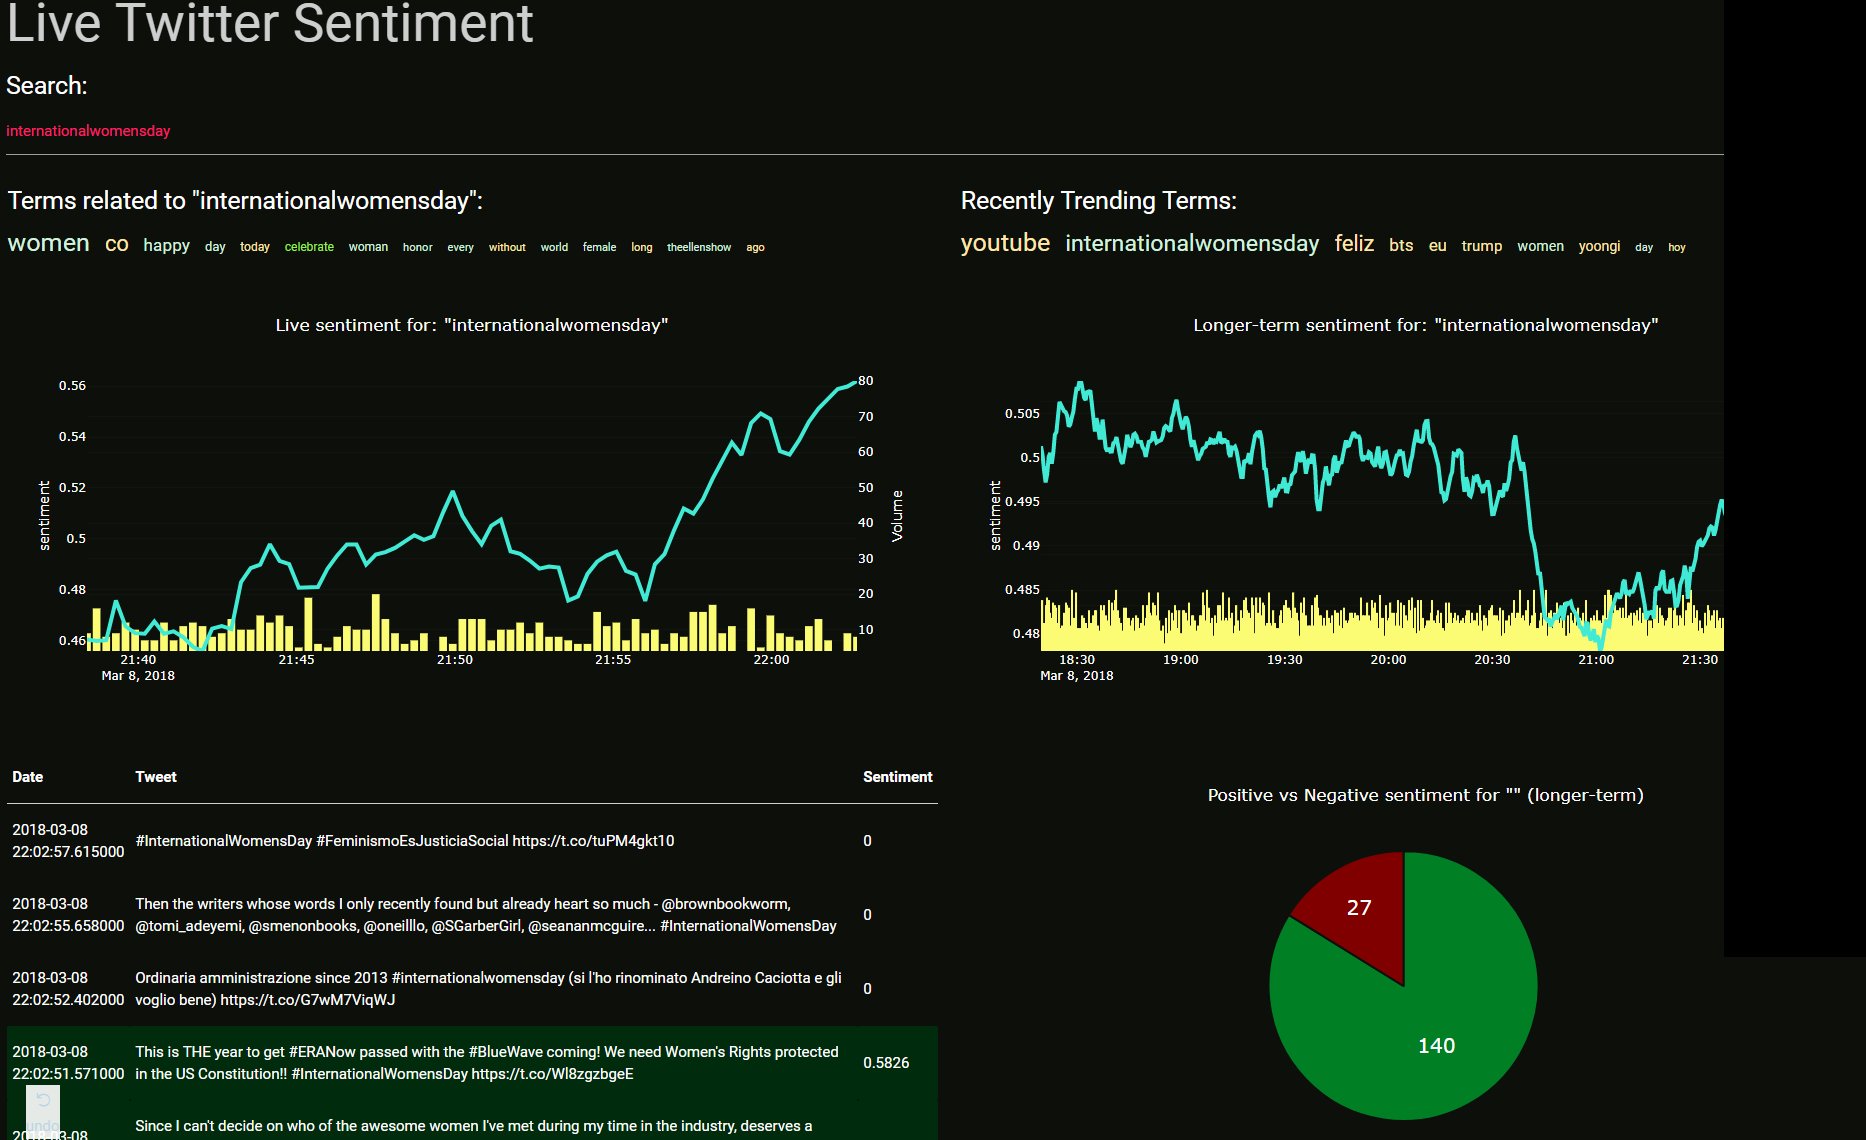
Live-streaming sentiment analysis application created with Python and Dash, hosted at SocialSentiment.net.

application example

Dash Tutorials

This application was created in conjunction with the Dash tutorial series.

Repo Contents:

  • dash_mess.py - This is currently the main front-end application code. Contains the dash application layouts, logic for graphs, interfaces with the database...etc. Name is descriptive of the overall state of code :) ...this code is setup to run on a flask instance. If you want to clone this and run it locally, you will be using the dev_server.py
  • dev_server.py - If you wish to run this application locally, on the dev server, run via this instead.
  • twitter_stream.py - This should run in the background of your application. This is what streams tweets from Twitter, storing them into the sqlite database, which is what the dash_mess.py file interfaces with.
  • config.py - Meant for many configurations, but right now it just contains stop words. Words we don't intend to ever count in the "trending"
  • cache.py - For caching purposes in effort to get things to run faster.
  • db-truncate.py - A script to truncate the infinitely-growing sqlite database. You will get about 3.5 millionish tweets per day, depending on how fast you can process. You can keep these, but, as the database grows, search times will dramatically suffer.

Quick start

  • Clone repo
  • install requirements.txt using pip install -r requirements.txt
  • Fill in your Twitter App credentials to twitter_stream.py. Go to apps.twitter.com to set that up if you need to.
  • Run twitter_stream.py to build database
  • If you're using this locally, you can run the application with the dev_server.py script. If you want to deploy this to a webserver, see my deploying Dash application tutorial
  • You might need the latest version of sqlite.
sudo add-apt-repository ppa:jonathonf/backports
sudo apt-get update && sudo apt-get install sqlite3
  • Consider running the db-truncate.py from time to time (or via a cronjob), to keep the database reasonably sized. In its current state, the database really doesn't need to store more than 2-3 days of data most likely.

Tips for Running on Server

  • You can use Gunicorn to run the server
gunicorn dash_mess:server -b 0.0.0.0:80 -w 4

Todo

Want to help contribute???

  • Code is ugly. Low hanging fruit is just making the code not so ugly. Up to this point, I've just been in "make it work" mode.
  • App is ugly. I am not a designer. This app is prettttttyyyyyy gross. Think you have a better design? Halp.
  • Click-able related terms and trending terms would be nice. I tried, but failed at this. It'd be cool to see a related term, and be able to just click on it, and this becomes the new searched term, for example.
  • The interactive search is cool, but also does a search in the database per-character. It would be nice if it didn't search per key-press. Not sure I want a search button, I like the streamlined interactivity, but maybe wait 0.2 seconds or something without any new keypresses to perform the search? Something like that might help with speeds. I really do not know the best option here, I just know this isn't idea.
  • Other manipulations or ideas for interactivity? Feel free to show them in a PR.

Credits

The speed of the application, especially with a database with 10's of millions of records is thanks entirely to Daniel Kukiela who helped us to convert from regular sqlite to using fts, helping with the queries, new database structure, caching, and more.
Owner
Harrison
Harrison
Debugging, monitoring and visualization for Python Machine Learning and Data Science

Welcome to TensorWatch TensorWatch is a debugging and visualization tool designed for data science, deep learning and reinforcement learning from Micr

Microsoft 3.3k Dec 27, 2022
CLAHE Contrast Limited Adaptive Histogram Equalization

A simple code to process images using contrast limited adaptive histogram equalization. Image processing is becoming a major part of data processig.

Happy N. Monday 4 May 18, 2022
CPG represent!

CoolPandasGroup CPG represent! Arianna Brandon Enne Luan Tracie Project requirements: use Pandas to clean and format datasets use Jupyter Notebook to

Enne 3 Feb 07, 2022
UNMAINTAINED! Renders beautiful SVG maps in Python.

Kartograph is not maintained anymore As you probably already guessed from the commit history in this repo, Kartograph.py is not maintained, which mean

1k Dec 09, 2022
Data Analysis: Data Visualization of Airlines

Data Analysis: Data Visualization of Airlines Anderson Cruz | London-UK | Linkedin | Nowa Capital Project: Traffic Airlines Airline Reporting Carrier

Anderson Cruz 1 Feb 10, 2022
A Python-based non-fungible token (NFT) generator built using Samilla and Matplotlib

PyNFT A Pythonic NF (non-fungible token) generator built using Samilla and Matplotlib Use python pynft.py [amount] The intention behind this generato

Ayush Gundawar 6 Feb 07, 2022
Drug design and development team HackBio internship is a virtual bioinformatics program that introduces students and professional to advanced practical bioinformatics and its applications globally.

-Nyokong. Drug design and development team HackBio internship is a virtual bioinformatics program that introduces students and professional to advance

4 Aug 04, 2022
Dimensionality reduction in very large datasets using Siamese Networks

ivis Implementation of the ivis algorithm as described in the paper Structure-preserving visualisation of high dimensional single-cell datasets. Ivis

beringresearch 284 Jan 01, 2023
Comparing USD and GBP Exchange Rates

Currency Data Visualization Comparing USD and GBP Exchange Rates This is a bar graph comparing GBP and USD exchange rates. I chose blue for the UK bec

5 Oct 28, 2021
China and India Population and GDP Visualization

China and India Population and GDP Visualization Historical Population Comparison between India and China This graph shows the population data of Indi

Nicolas De Mello 10 Oct 27, 2021
๐Ÿ“Š Extensions for Matplotlib

๐Ÿ“Š Extensions for Matplotlib

Nico Schlรถmer 519 Dec 30, 2022
The implementation of the paper "HIST: A Graph-based Framework for Stock Trend Forecasting via Mining Concept-Oriented Shared Information".

The HIST framework for stock trend forecasting The implementation of the paper "HIST: A Graph-based Framework for Stock Trend Forecasting via Mining C

Wentao Xu 111 Jan 03, 2023
High-level geospatial data visualization library for Python.

geoplot: geospatial data visualization geoplot is a high-level Python geospatial plotting library. It's an extension to cartopy and matplotlib which m

Aleksey Bilogur 1k Jan 01, 2023
๐ŸPyNode Next allows you to easily create beautiful graph visualisations and animations

PyNode Next A complete rewrite of PyNode for the modern era. Up to five times faster than the original PyNode. PyNode Next allows you to easily create

ehne 3 Feb 12, 2022
Cryptocurrency Centralized Exchange Visualization

This is a simple one that uses Grafina to visualize cryptocurrency from the Bitkub exchange. This service will make a request to the Bitkub API from your wallet and save the response to Postgresql. G

Popboon Mahachanawong 1 Nov 24, 2021
Wikipedia WordCloud App generate Wikipedia word cloud art created using python's streamlit, matplotlib, wikipedia and wordcloud packages

Wikipedia WordCloud App Wikipedia WordCloud App generate Wikipedia word cloud art created using python's streamlit, matplotlib, wikipedia and wordclou

Siva Prakash 5 Jan 02, 2022
๐Ÿ“Š Charts with pure python

A zero-dependency python package that prints basic charts to a Jupyter output Charts supported: Bar graphs Scatter plots Histograms ๐Ÿ‘ ๐Ÿ“Š ๐Ÿ‘ Examples

Max Humber 54 Oct 04, 2022
Create 3d loss surface visualizations, with optimizer path. Issues welcome!

MLVTK A loss surface visualization tool Simple feed-forward network trained on chess data, using elu activation and Adam optimizer Simple feed-forward

7 Dec 21, 2022
Graphical display tools, to help students debug their class implementations in the Carcassonne family of projects

carcassonne_tools Graphical display tools, to help students debug their class implementations in the Carcassonne family of projects NOTE NOTE NOTE The

1 Nov 08, 2021
Python histogram library - histograms as updateable, fully semantic objects with visualization tools. [P]ython [HYST]ograms.

physt P(i/y)thon h(i/y)stograms. Inspired (and based on) numpy.histogram, but designed for humans(TM) on steroids(TM). The goal is to unify different

Jan Pipek 120 Dec 08, 2022