BioMASS - A Python Framework for Modeling and Analysis of Signaling Systems

Overview

BioMASS

Actions Status Documentation Status PyPI version License Downloads PyPI pyversions Language grade: Python Code style: black

Mathematical modeling is a powerful method for the analysis of complex biological systems. Although there are many researches devoted on producing models to describe dynamical cellular signaling systems, most of these models are limited and do not cover multiple pathways. Therefore, there is a challenge to combine these models to enable understanding at a larger scale. Nevertheless, larger network means that it gets more difficult to estimate parameters to reproduce dynamic experimental data needed for deeper understanding of a system.

To overcome this problem, we developed BioMASS, a Python framework for Modeling and Analysis of Signaling Systems. The BioMASS framework allows efficient optimization of multiple parameter sets simultaneously and generates the multiple parameter candidates that explain the signaling dynamics of interest. These parameter candidates can be further evaluated by their distribution and sensitivity analysis as a part of alternative information about the hidden regulatory mechanism of the system.

Features

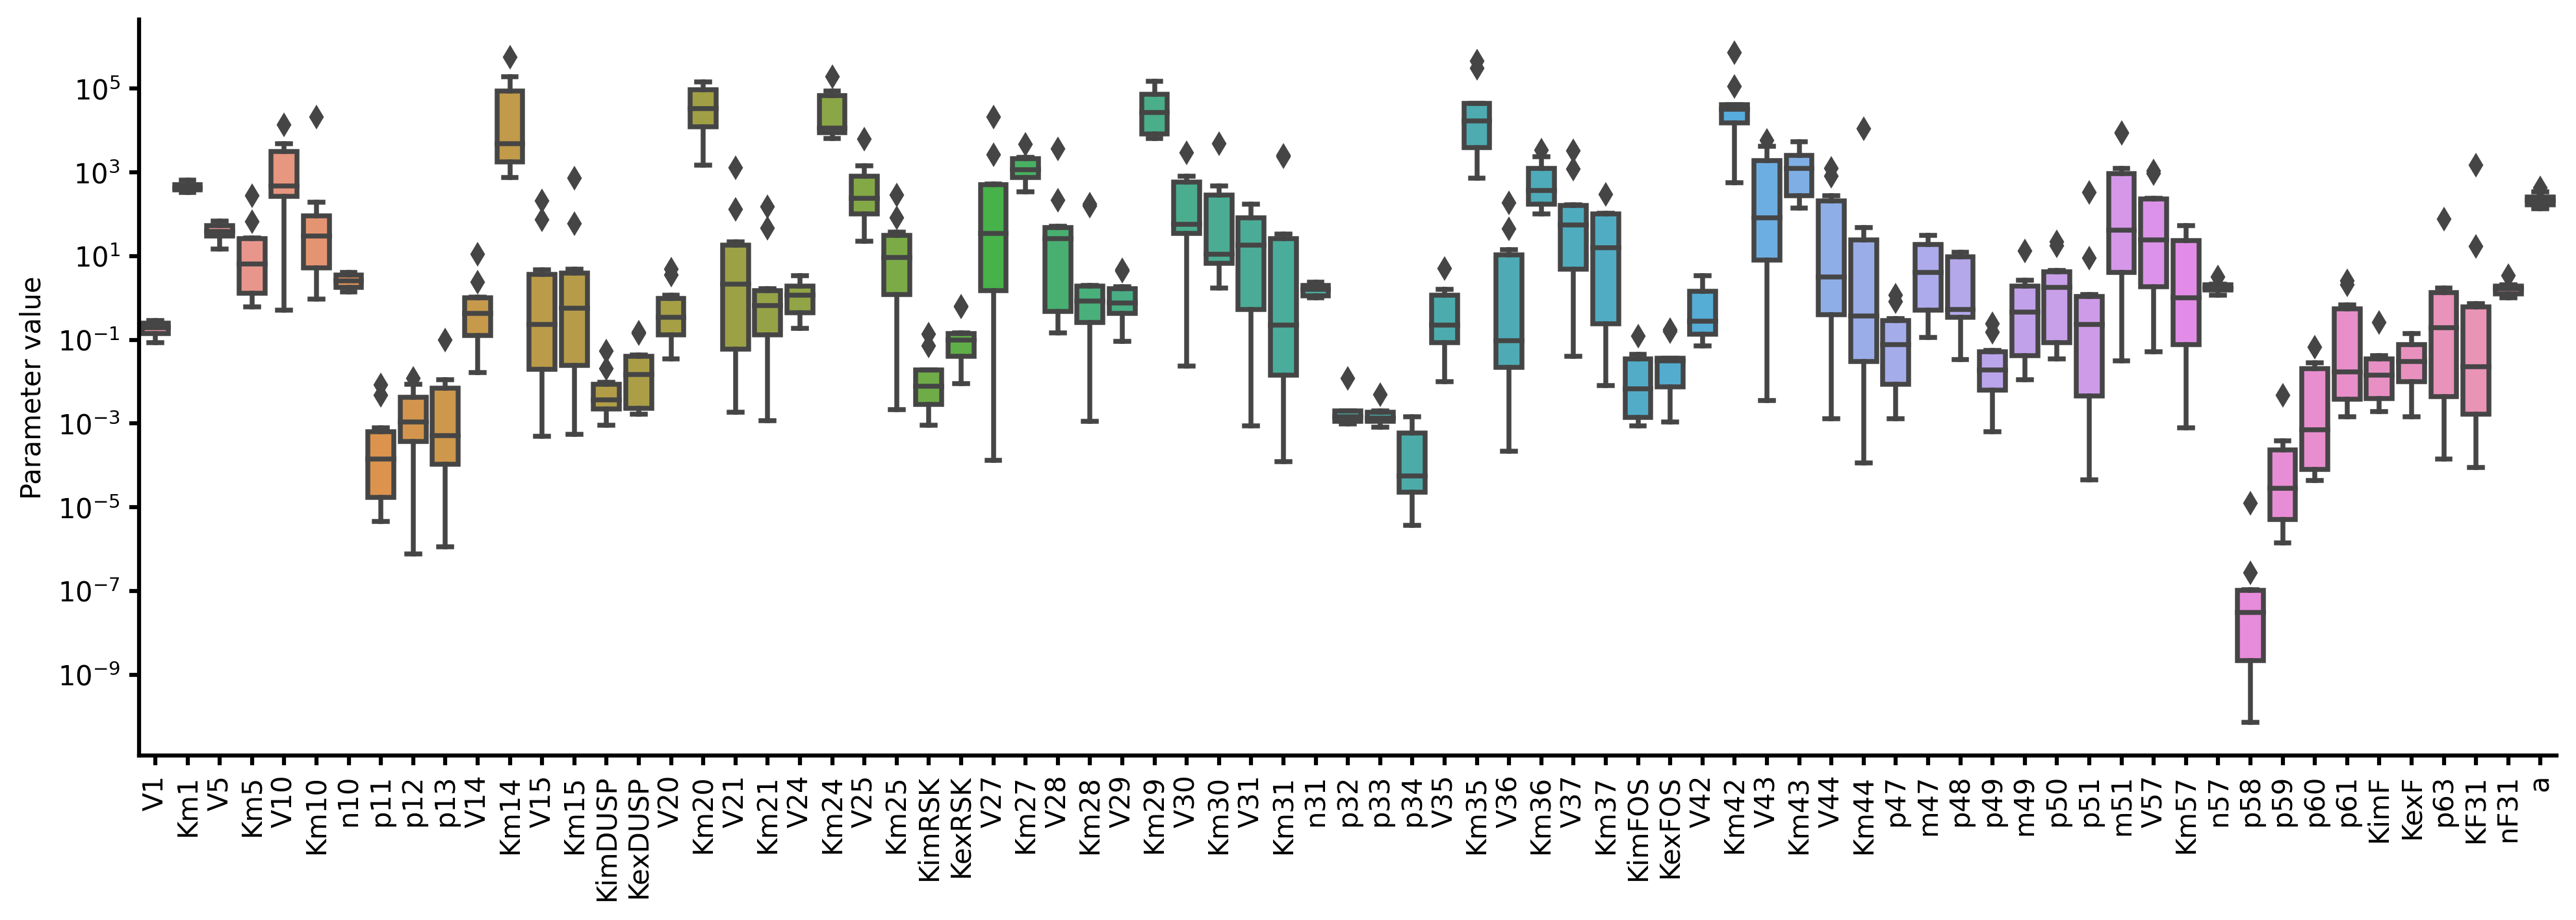
  • Parameter estimation of ODE models
  • Local sensitivity analysis
  • Effective visualization of simulation results

Documentation

Online documentation is available at https://biomass-core.readthedocs.io/.

Installation

The BioMASS library is available at the Python Package Index (PyPI).

$ pip install biomass

BioMASS supports Python 3.7 or newer.

Also, we provide BioMASS docker images on DockerHub.

Example

Parameter estimation

from biomass import Model, optimize
from biomass.models import Nakakuki_Cell_2010

model = Model(Nakakuki_Cell_2010.__package__).create()

optimize(model, x_id=range(1, 11))

estimated_parameter_sets

from biomass import run_simulation

run_simulation(model, viz_type="average", stdev=True)

simulation_average 
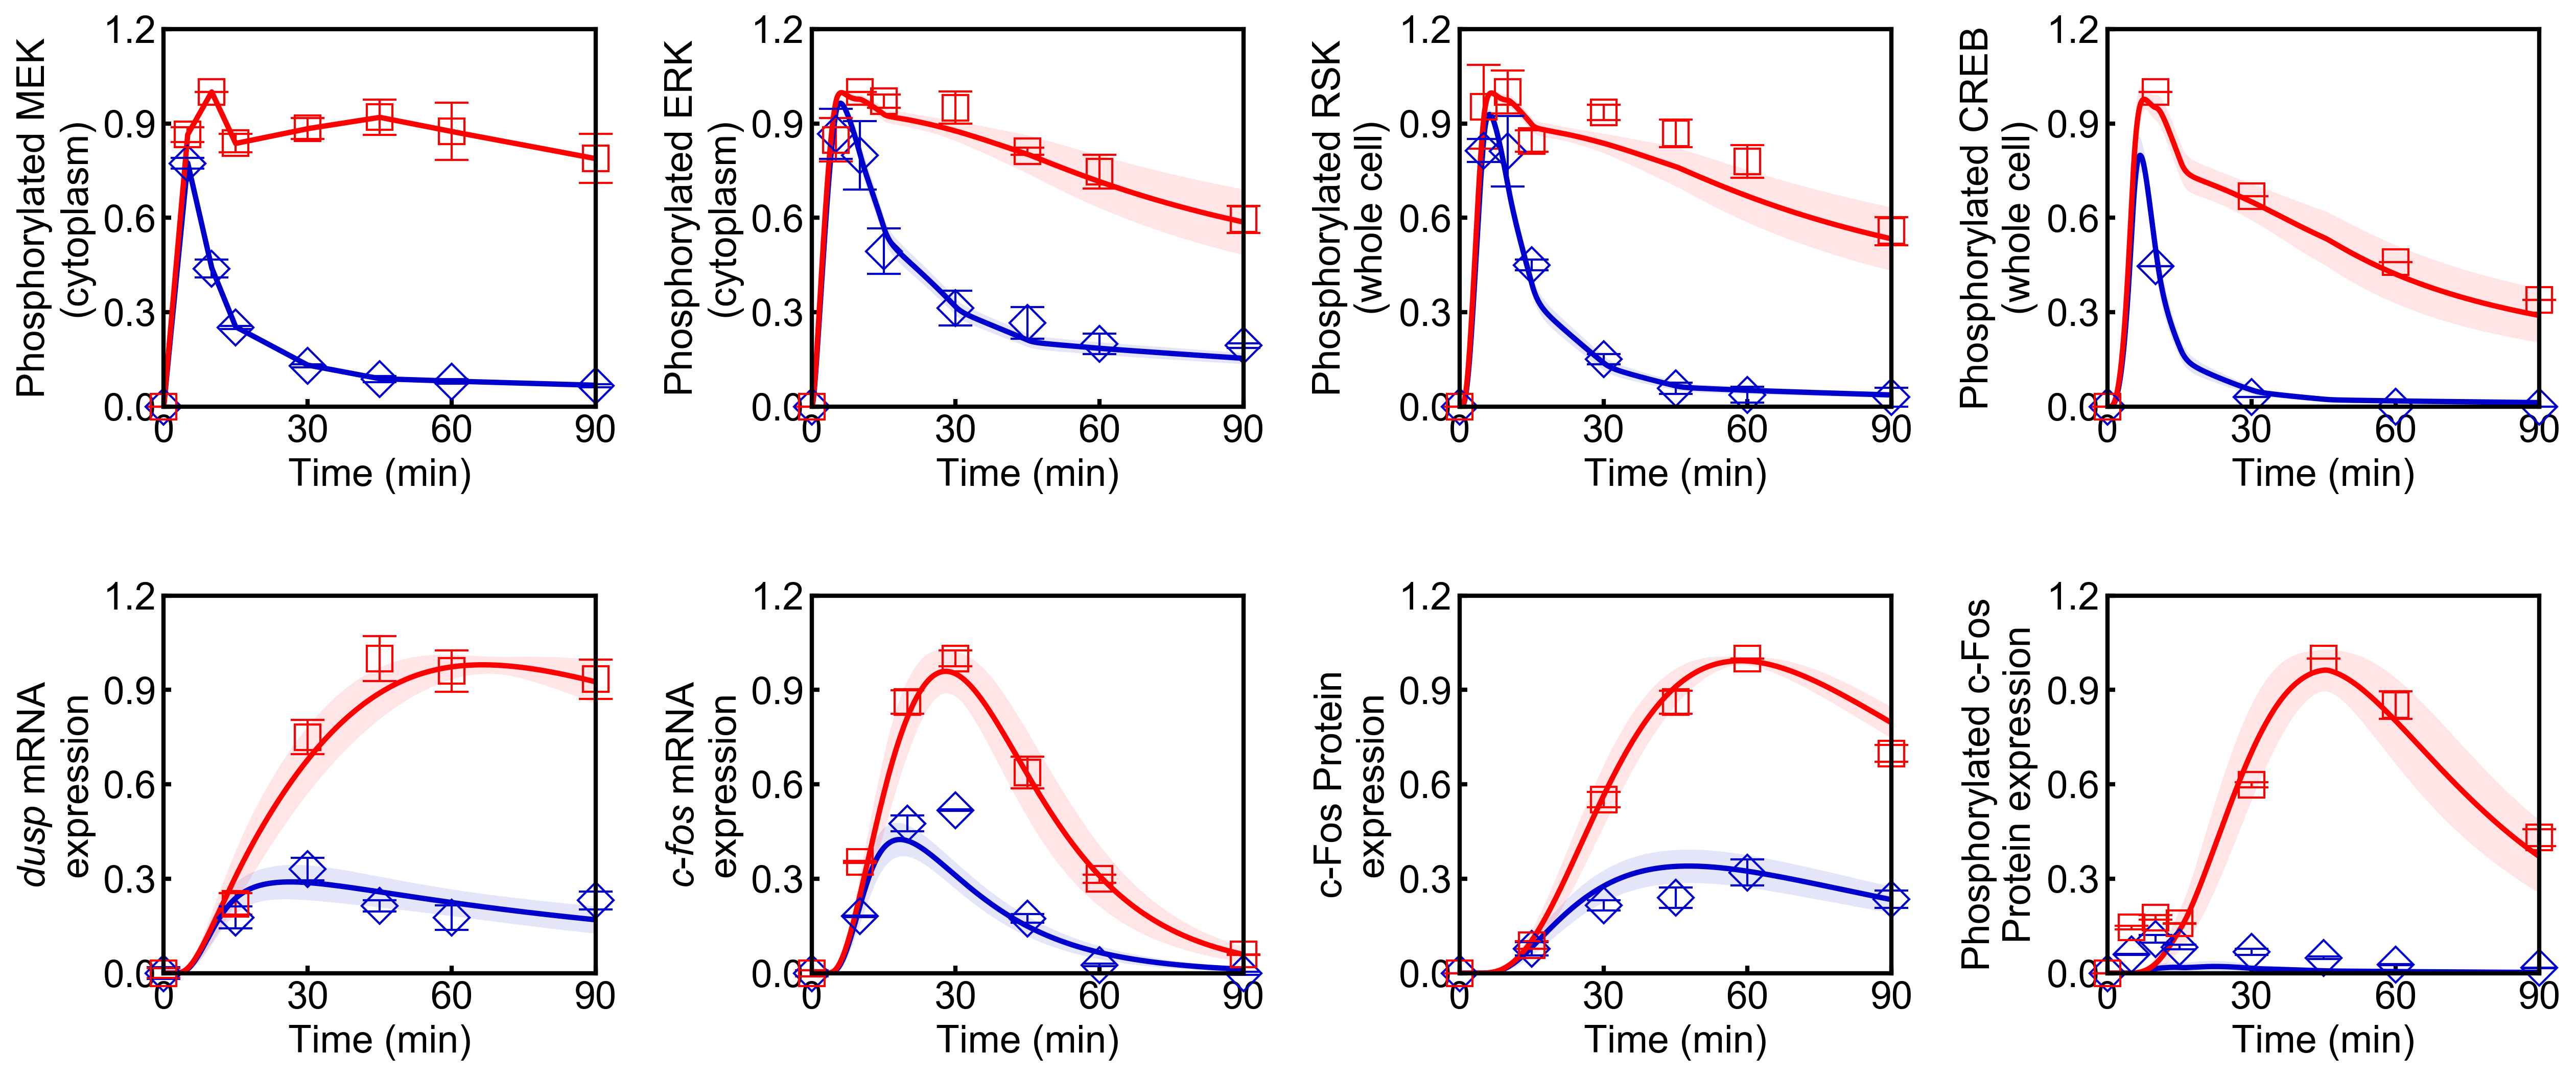
Points (blue diamonds, EGF; red squares, HRG) denote experimental data, solid lines denote simulations.

Sensitivity analysis

from biomass import run_analysis

run_analysis(model, target="reaction", metric="integral", style="barplot")

sensitivity_PcFos

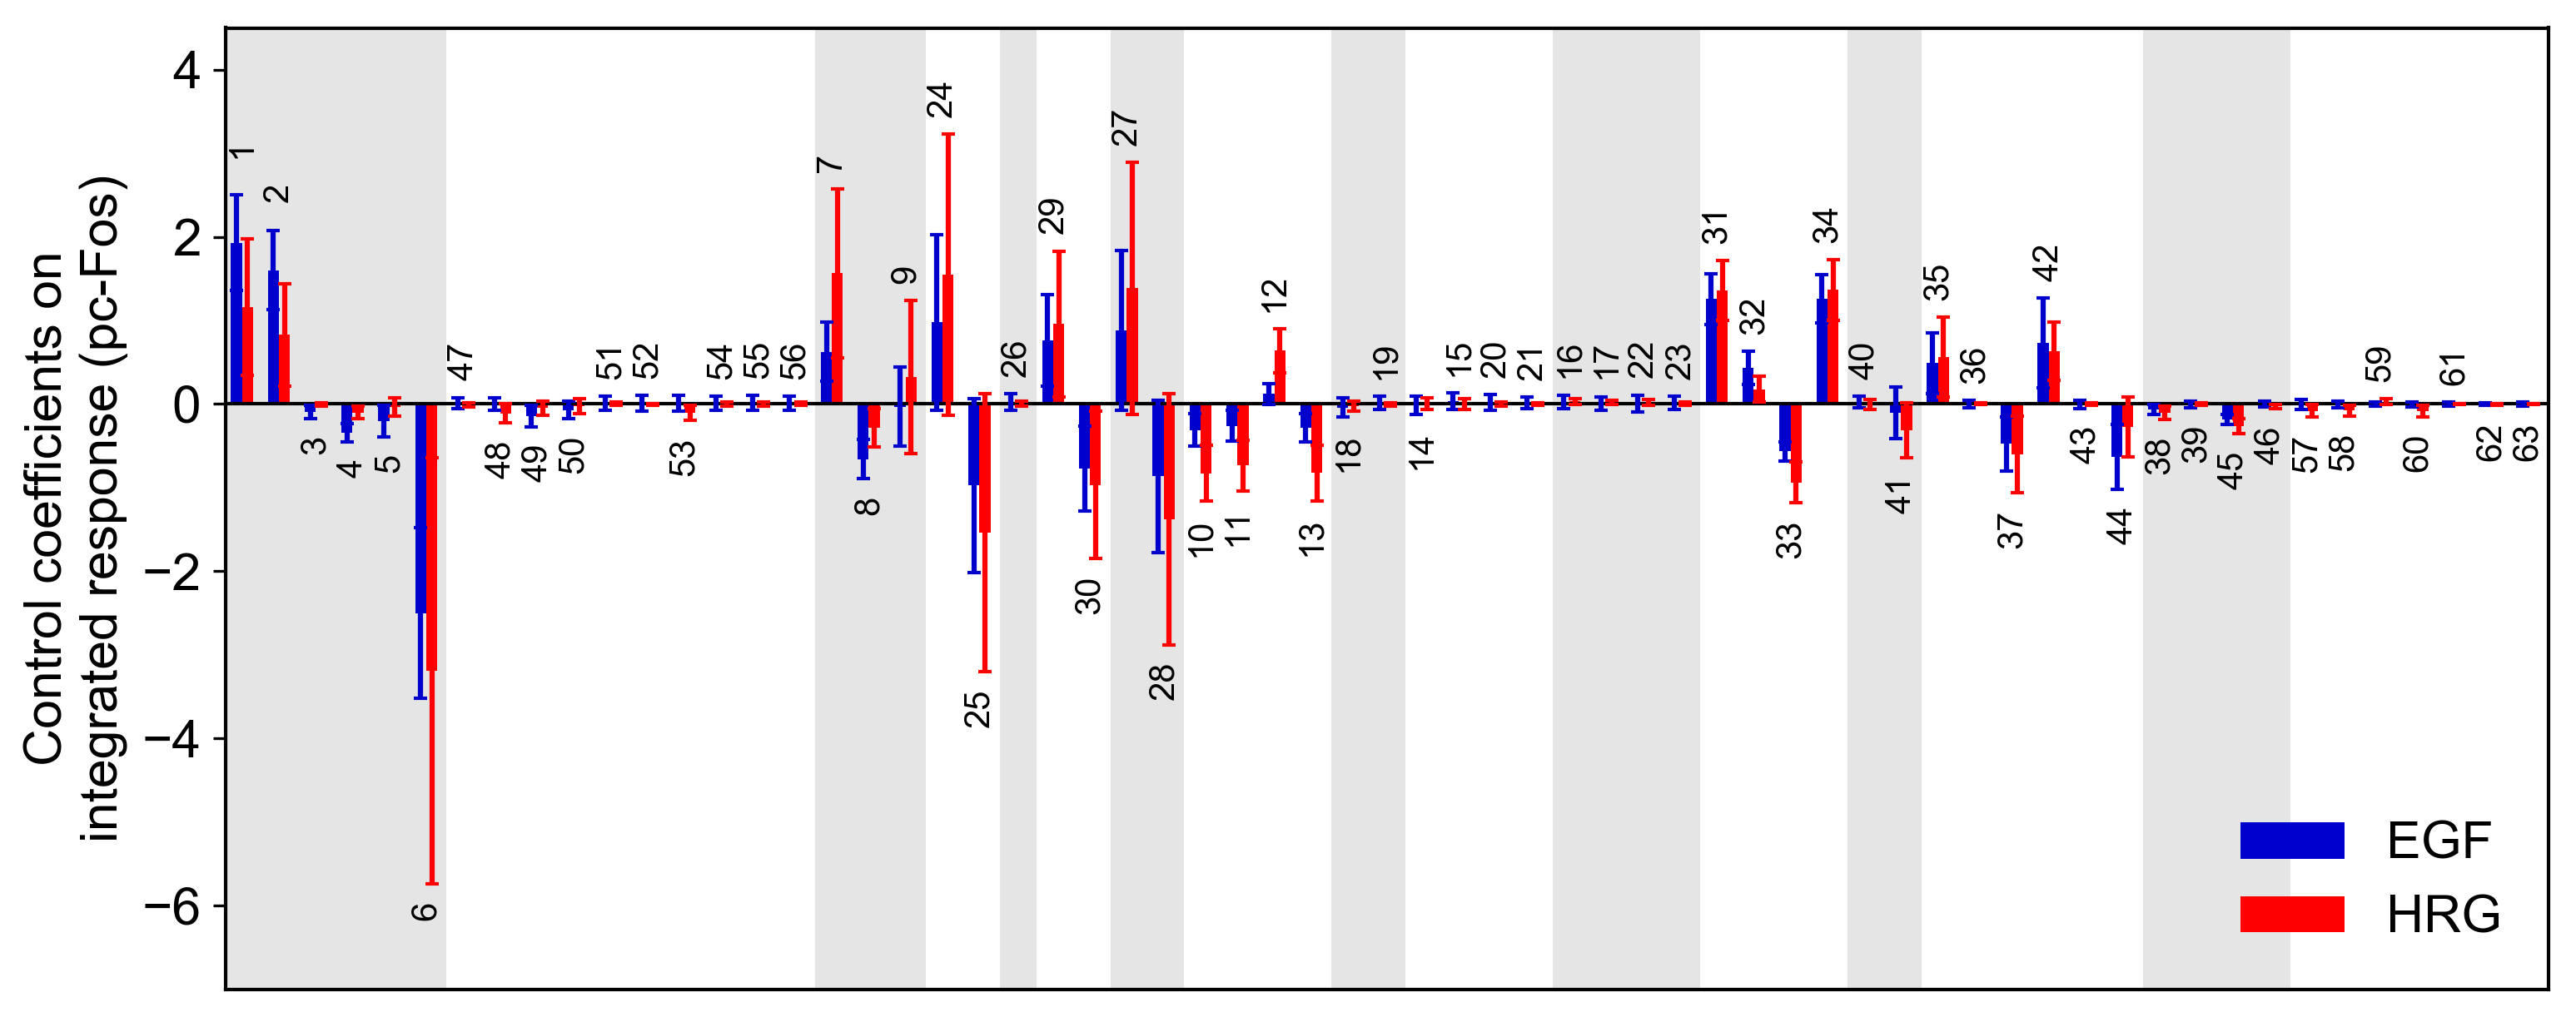
Control coefficients for integrated pc-Fos are shown by bars (blue, EGF; red, HRG). Numbers above bars indicate the reaction indices, and error bars correspond to simulation standard deviation.

Citation

When using BioMASS, please cite the following paper:

  • Imoto, H., Zhang, S. & Okada, M. A Computational Framework for Prediction and Analysis of Cancer Signaling Dynamics from RNA Sequencing Data—Application to the ErbB Receptor Signaling Pathway. Cancers 12, 2878 (2020). https://doi.org/10.3390/cancers12102878

Author

Hiroaki Imoto

License

Apache License 2.0

Comments
  • Unable to run provided models

    Unable to run provided models

    I am a beginner in both Python and data modeling and am having difficulties figuring out how to run this module based on the tutorials alone. I have been attempting to run the models provided but cannot get it to work. I had some help to install the module using pip, then I have downloaded the biomass_master file, and created a Python text file called biomass_test.py within the Nakakuki_Cell_2010 folder using Visual Studio Code. I have copied/pasted the commands `` from biomass import create_model from biomass.models import Nakakuki_Cell_2010

    model = create_model(Nakakuki_Cell_2010.package, show_info=True) ``

    within that text file, and ran it in a Python terminal in VS Code. It gives me the following error: FileNotFoundError: [Errno 2] No such file or directory: 'biomass\models\Nakakuki_Cell_2010\ode.py'`` The biomass_test.py and ode.py files are both in the Nakakuki_Cell_2010 folder. Could you please advise on what I may be doing wrong?

    question 
    opened by lhdp0110 9
  • Unexpected behavior for reversible reaction

    Unexpected behavior for reversible reaction

    Description:

    Text2Model of reversible reaction with one reactant and one product fails.

    Reproduce:

    Text file containing:

    A + C <--> B
    A <--> B
    

    Convert to model:

    from biomass import Text2Model
    model = Text2Model("test.txt")
    model.convert(overwrite=True)
    

    Raises:

    DetectionError Unregistered words in line2: A <--> B

    bug enhancement text2model 
    opened by formersbach 8
  • pytest on graphing fails with `pyvis==0.3`

    pytest on graphing fails with `pyvis==0.3`

    Hi @formersbach, I noticed that pytest on graphing fails with the latest stable pyvis (version 0.3.0). When I restrict pyvis version via pyvis>=0.2.1,<0.3, we don't see any errors. Some updates in pyvis from v0.2 to v0.3 might affect the graph generation.

    bug graph 
    opened by himoto 6
  • State transition

    State transition

    We have discussed the behavior of Text2Model in the issue #166. Accordingly, I added new reaction rule state_transition, in which simple mass action kinetics is applied when any rule words are not detected. In other words, this allows users to write a simple state transition, e.g., from A to B, as follows:

    A <--> B
    

    Also, this rule is direction-sensitive. If you use --> and <-->, the resulting reaction will be uni- and bi-directional, respectively.

    text2model 
    opened by himoto 6
  • Using BioMASS without Graphviz

    Using BioMASS without Graphviz

    Discussed in https://github.com/biomass-dev/biomass/discussions/158

    Originally posted by himoto July 23, 2022 BioMass requires users to manually install Graphviz for graph visualization but some packages derived from biomass, e.g., pasmpy, do not need it. Currently if we run import biomass without Graphviz, it will raise an ImportError. I would like to make this optional so that biomass-derived packages can be run without error even if Graphviz is not installed.

    Ideas:

    • [x] Move pygraphviz and pyvis from requirements.txt to extras_require in setup.py
    • [x] Modify graph.py as follows:
    
    def to_graph(self):
        try:
            import pygraphviz as pgv
        except ImportError:
            print("pygraphviz is required to run this function.")
        ...
    
    def dynamic_plot(self, ...):
        try:
            from pyvis.network import Network
        except ImportError:
            print("pyvis is required to run this function.")


    @formersbach I would be grateful if you could give me comments on this. I have a branch working on this and if it's ok, I will send a PR.

    graph 
    opened by himoto 6
  • Graph representation of biological model

    Graph representation of biological model

    Will add support for graphic representation of biological model. Requires graphviz program and pygraphviz package. Minor changes to exec_model.py to make create_graph callable on model object.

    opened by formersbach 4
  • Error for the simulation example in the readme

    Error for the simulation example in the readme

    The following error was produced when running the example in the readme

    RuntimeWarning: invalid value encountered in double_scalars
      + (y[V.Fn] / x[C.KF31]) ** x[C.nF31]
    

    The code:

    from biomass import Model, optimize
    from biomass.models import Nakakuki_Cell_2010
    
    model = Model(Nakakuki_Cell_2010.__package__).create()
    run_simulation(model, viz_type="average", stdev=True)
    

    I think it is caused by an undefined parameter and thus, I propose changing the model used in the exampleto another model that does not require manual input of parameters, or to pre-input the default parameter for the model.

    Please let me know if this is a misunderstanding.

    opened by johannesnicolaus 3
  • Unexpected behavior in reaction_rules

    Unexpected behavior in reaction_rules

    Description:

    Equation where 1 reactant reacts to 2 products is not covered by state_transition function but rather raises ValueError in _bind_and_dissociate. I was trying to create a transcription event with mass action kinetics. I'm not sure whether this is "right" or "wrong", maybe you have an idea @himoto !

    Reproduce:

    Text file containing:

    nNfk --> nNfk + mIkb
    

    Convert to model:

    from biomass import Text2Model, create_model
    model = Text2Model("test.txt")
    model.convert(overwrite=True)
    

    Observed behavior

    Raises :

    ValueError
    line1: nNfk <- Use a different name.
    

    Desired behavior

    ODE:

    dmIkb/dt = kf1 * nNfk
    dnNfk/dt = 0
    
    help wanted text2model 
    opened by formersbach 2
  • Type of `show_controls` in the example code

    Type of `show_controls` in the example code

    Hi @formersbach, I thinks the type of show_controls in the example code of dynamic_plot() should be boolean, not string:

    model.dynamic_plot(save_dir='example_dir', file_name='nfkb_dynamic.html' show_controls='True', which_controls=['physics', 'layout'])
    

    If yes, I have a fix-doc branch and fix this. Thank you!

    documentation question 
    opened by himoto 2
  • Add note for `run_analysis` function

    Add note for `run_analysis` function

    By default, run_analysis does not overwrite calculation results. If you would like to overwrite the results, you will need to set options['overwrite'] to False. This info should be emphasized at docstring.

    opened by himoto 1
  • Phosphorylation generates duplicate ODE

    Phosphorylation generates duplicate ODE

    Description:

    If "is phosphorylated" reaction rule is used with a unphosphorylated species that has been previously used, a second ODE is mistakenly generated.

    Reproduce:

    Text file containing:

    TNFR phosphorylates Ikk --> pIkk   
    Ikk is phosphorylated <--> pIkk
    pIkk is phosphorylated <--> ppIkk
    

    Convert to model:

    from biomass import Text2Model, create_model
    model = Text2Model("test.txt")
    model.convert(overwrite=True)
    model = create_model(test)
    

    Proposed changes:

    Add missing format string in line 1099:

    elif "dydt[V.{phosphorylated_form}]" in eq:
    

    to

    elif f"dydt[V.{phosphorylated_form}]" in eq:
    
    bug text2model 
    opened by formersbach 1
  • Typo in state_transition rule

    Typo in state_transition rule

    Description:

    Modifier parsed with state_transition reaction rule leads to wrong kinetic information.

    Reproduce:

    Text file containing:

    A + B --> A + pB

    Convert to model:

    from biomass import Text2Model, create_model
    model = Text2Model("test.txt")
    model.convert(overwrite=True)
    print(model.kinetics.rate)
    

    Expected:

    kf1 * pB * A

    Observed:

    kf1 * pB * A]

    Proposed fix:

    remove typo in line 1724 of reaction_rules.py: [f"{modifier}]" to [f"{modifier}"

    opened by formersbach 2
  • Numerical structural identifiability analysis

    Numerical structural identifiability analysis

    I believe identifiability analysis is a very useful tool in model development and experiment design! Based on the work of Joubert and Stigter I have implemented the numerical part of their algorithm in a proof of concept script. Structural identifiability is a structural property of any model. To quote Joubert et al: "One way of characterizing structural identifiability is to say that at least 1 parameter has a confidence interval that spans the interval negative infinity to positive infinity. Any form of unidentifiability [...] calls into question the predictive power of a model and urges its user to interpret all results with caution" The idea of their algorithm is to analyze the so called parametric output sensitivity matrix (OSM). Full rank of the OSM is a sufficient condition for structural identifiability. Rank deficiency indicates non-influence by parameters or correlation between parameters. The rank of the OSM is calculated using singular value decomposition. Since all calculations are numerical and non-exhaustive there is a non-zero possibility of false negatives (identifiable parameter is deemed unidentifiable).

    In principle no user input is required. A user defined observable matrix can be supplied however.

    The script is ~ 100 lines long and requires the sympy package for symbolic calculations.

    The only information required is a Text2Model object. Where in Pasmopy/Biomass do you think this should go? Should I just provide you the proof of concept script?

    enhancement text2model 
    opened by formersbach 2
Releases(v0.10.0)
  • v0.10.0(Sep 22, 2022)

    What's Changed

    • State transition by @himoto in https://github.com/biomass-dev/biomass/pull/169
    • Generalisation of mass action kinetics by @formersbach in https://github.com/biomass-dev/biomass/pull/172
    • Drop support for old template by @himoto in https://github.com/biomass-dev/biomass/pull/176
    • Fix typo in tutorial by @himoto in https://github.com/biomass-dev/biomass/pull/178
    • Fix module name: model_object by @himoto in https://github.com/biomass-dev/biomass/pull/181
    • Transfer graphing from BioMass to Text2Model by @formersbach in https://github.com/biomass-dev/biomass/pull/177
    • Update docs to be compatible with the newest features by @himoto in https://github.com/biomass-dev/biomass/pull/182
    • Fix f-string in is_phosphorylated rule by @himoto in https://github.com/biomass-dev/biomass/pull/184
    • Refactor code for sensitivity analysis by @himoto in https://github.com/biomass-dev/biomass/pull/186
    • Redirect rules by @himoto in https://github.com/biomass-dev/biomass/pull/188
    • Fix issue #189 by @formersbach in https://github.com/biomass-dev/biomass/pull/190
    • Fix docstring by @himoto in https://github.com/biomass-dev/biomass/pull/191
    • Fixes #192 by @formersbach in https://github.com/biomass-dev/biomass/pull/193
    • Update graphing tutorial to new graph function. by @formersbach in https://github.com/biomass-dev/biomass/pull/195

    Full Changelog: https://github.com/biomass-dev/biomass/compare/v0.9.1...v0.10.0

    Source code(tar.gz)
    Source code(zip)
  • v0.9.1(Jul 27, 2022)

    What's Changed

    • Enable running biomass without Graphviz by @himoto in https://github.com/biomass-dev/biomass/pull/162

    Full Changelog: https://github.com/biomass-dev/biomass/compare/v0.9.0...v0.9.1

    Source code(tar.gz)
    Source code(zip)
  • v0.9.0(Jul 21, 2022)

    What's Changed

    • Adding interactive plotting option. by @formersbach in https://github.com/biomass-dev/biomass/pull/144
    • Changed how graph is passed to pygraphvis, fixing issue #147 by @formersbach in https://github.com/biomass-dev/biomass/pull/148
    • Add graph visualization tutorial, resolves #145 by @formersbach in https://github.com/biomass-dev/biomass/pull/149
    • [pre-commit.ci] pre-commit autoupdate by @pre-commit-ci in https://github.com/biomass-dev/biomass/pull/146
    • Fixes documentation and changes default save directory of graph.py by @formersbach in https://github.com/biomass-dev/biomass/pull/154
    • Remove exec by @himoto in https://github.com/biomass-dev/biomass/pull/157

    Full Changelog: https://github.com/biomass-dev/biomass/compare/v0.8.0...v0.9.0

    Source code(tar.gz)
    Source code(zip)
  • v0.8.0(Jun 30, 2022)

    What's Changed

    • Graph representation of biological model by @formersbach in https://github.com/biomass-dev/biomass/pull/131
    • Drop support of Python <= 3.7 by @himoto in https://github.com/biomass-dev/biomass/pull/132
    • Update graph.py by @himoto in https://github.com/biomass-dev/biomass/pull/133
    • From text to model by @himoto in https://github.com/biomass-dev/biomass/pull/136
    • Release v0.8.0 by @himoto in https://github.com/biomass-dev/biomass/pull/138
    • Fix error in multi_observables_options by @himoto in https://github.com/biomass-dev/biomass/pull/140
    • Fix dead link by @himoto in https://github.com/biomass-dev/biomass/pull/142

    New Contributors

    • @formersbach made their first contribution in https://github.com/biomass-dev/biomass/pull/131

    Full Changelog: https://github.com/biomass-dev/biomass/compare/v0.7.2...v0.8.0

    Source code(tar.gz)
    Source code(zip)
  • v0.7.2(Jun 16, 2022)

    What's Changed

    • Make error messages more user friendly by @himoto in https://github.com/biomass-dev/biomass/pull/123
    • Fix #124 by @himoto in https://github.com/biomass-dev/biomass/pull/125
    • Release v0.7.2 by @himoto in https://github.com/biomass-dev/biomass/pull/128

    Full Changelog: https://github.com/biomass-dev/biomass/compare/v0.7.1...v0.7.2

    Source code(tar.gz)
    Source code(zip)
  • v0.7.1(Jun 12, 2022)

    What's Changed

    • Create tutorial by @himoto in https://github.com/biomass-dev/biomass/pull/118
    • Update logo by @himoto in https://github.com/biomass-dev/biomass/pull/119
    • Release v0.7.1 by @himoto in https://github.com/biomass-dev/biomass/pull/121

    Full Changelog: https://github.com/biomass-dev/biomass/compare/v0.7.0...v0.7.1

    Source code(tar.gz)
    Source code(zip)
  • v0.7.0(Jun 1, 2022)

    What's Changed

    • Add support for Python 3.10 by @himoto in https://github.com/biomass-dev/biomass/pull/110
    • Add CITATION.cff by @himoto in https://github.com/biomass-dev/biomass/pull/111
    • Add InitialPopulation by @himoto in https://github.com/biomass-dev/biomass/pull/113
    • Release v0.7.0 by @himoto in https://github.com/biomass-dev/biomass/pull/116

    Renamed BioMASS modules:

    | Old | New | | --- | ----- | | set_model.py | ode.py | | set_search_param.py | search_param.py | | fitness.py | problem.py |

    Full Changelog: https://github.com/biomass-dev/biomass/compare/v0.6.2...v0.7.0

    Source code(tar.gz)
    Source code(zip)
  • v0.6.2(May 16, 2022)

    What's Changed

    • Release v0.6.2 by @himoto in https://github.com/biomass-dev/biomass/pull/107

    Full Changelog: https://github.com/biomass-dev/biomass/compare/v0.6.1...v0.6.2

    Source code(tar.gz)
    Source code(zip)
  • v0.6.1(Apr 26, 2022)

    What's Changed

    • [pre-commit.ci] pre-commit autoupdate by @pre-commit-ci in https://github.com/biomass-dev/biomass/pull/97
    • docs: git clone biomass by @himoto in https://github.com/biomass-dev/biomass/pull/98
    • Add model of the G1/S cell cycle transition by @himoto in https://github.com/biomass-dev/biomass/pull/99
    • Set 'LSODA' as default ODE solver by @himoto in https://github.com/biomass-dev/biomass/pull/100
    • Add model for the proliferation–quiescence decision by @himoto in https://github.com/biomass-dev/biomass/pull/101
    • Update example code for ExternalOptimizer by @himoto in https://github.com/biomass-dev/biomass/pull/103
    • Release v0.6.1 by @himoto in https://github.com/biomass-dev/biomass/pull/104

    Full Changelog: https://github.com/biomass-dev/biomass/compare/v0.6.0...v0.6.1

    Source code(tar.gz)
    Source code(zip)
  • v0.6.0(Apr 1, 2022)

    What's Changed

    • Release v0.6.0 by @himoto in https://github.com/biomass-dev/biomass/pull/95
    • [pre-commit.ci] pre-commit autoupdate by @pre-commit-ci in https://github.com/biomass-dev/biomass/pull/87

    Full Changelog: https://github.com/biomass-dev/biomass/compare/v0.5.5...v0.6.0

    Source code(tar.gz)
    Source code(zip)
  • v0.5.5(Dec 30, 2021)

    What's Changed

    • Fix error message for incorrect visualization options by @himoto in https://github.com/biomass-dev/biomass/pull/72
    • Fix sensitivity analysis visualization problem by @himoto in https://github.com/biomass-dev/biomass/pull/81
    • Add more tests by @himoto in https://github.com/biomass-dev/biomass/pull/83
    • Release v0.5.5 by @himoto in https://github.com/biomass-dev/biomass/pull/84
    • [pre-commit.ci] pre-commit autoupdate by @pre-commit-ci in https://github.com/biomass-dev/biomass/pull/70

    Full Changelog: https://github.com/biomass-dev/biomass/compare/v0.5.4...v0.5.5

    Source code(tar.gz)
    Source code(zip)
  • v0.5.4(Oct 27, 2021)

    • Docs:

      • Add simulation results for each model, see here
    • Core functions:

      • Add method to check model indices
    • Solver:

      • Update function to equilibrate a system (#68)
    Source code(tar.gz)
    Source code(zip)
  • v0.5.3(Oct 11, 2021)

  • v0.5.2(Aug 20, 2021)

    • Template

      • Update viz.py

        Use this template for creating models with biomass>=0.5.2

        from matplotlib import pyplot as plt
        
        from biomass.plotting import *
        
        from .observable import Observable
        
        
        class Visualization(Observable):
            """
            Plotting parameters for customizing figure properties.
        
            Attributes
            ----------
            cm : matplotlib.colors.ListedColormap (default: `plt.cm.get_cmap('tab10')`)
                Choosing colormaps for `cmap`.
            single_observable_options : list of SingleObservable
                Visualization options for time-course simulation (single-observable).
            multiple_observables_options : MultipleObservables
                Visualization options for time-course simulation (multi-observables).
            sensitivity_options : SensitivityOptions
                Visualization options for sensitivity analysis results.
            """
        
            def __init__(self):
                super().__init__()
        
                self.cm = plt.cm.get_cmap("tab10")
                self.single_observable_options = [
                    SingleObservable(self.cm, obs_name) for obs_name in self.obs_names
                ]
                self.multiple_observables_options = MultipleObservables(self.cm)
                self.sensitivity_options = SensitivityOptions(self.cm)
        
            def get_single_observable_options(self):
        
                return self.single_observable_options
        
            def get_multiple_observables_options(self):
        
                return self.multiple_observables_options
        
            def get_sensitivity_options(self):
        
                return self.sensitivity_options
        
            @staticmethod
            def set_timecourse_rcParams():
                """figure/simulation"""
                plt.rcParams["font.size"] = 12
                plt.rcParams["axes.linewidth"] = 1.5
                plt.rcParams["xtick.major.width"] = 1.5
                plt.rcParams["ytick.major.width"] = 1.5
                plt.rcParams["lines.linewidth"] = 1.8
                plt.rcParams["lines.markersize"] = 12
                plt.rcParams["savefig.bbox"] = "tight"
                # plt.rcParams["savefig.format"] = "pdf"
                # plt.rcParams['font.family'] = 'Arial'
                # plt.rcParams['mathtext.fontset'] = 'custom'
                # plt.rcParams['mathtext.it'] = 'Arial:italic'
        
            @staticmethod
            def set_sensitivity_rcParams():
                """figure/sensitivity"""
                plt.rcParams["font.size"] = 12
                plt.rcParams["axes.linewidth"] = 1.2
                plt.rcParams["xtick.major.width"] = 1.2
                plt.rcParams["ytick.major.width"] = 1.2
                plt.rcParams["savefig.bbox"] = "tight"
                # plt.rcParams["savefig.format"] = "pdf"
                # plt.rcParams['font.family'] = 'Arial'
        
            @staticmethod
            def convert_species_name(name):
                """figure/sensitivity/initial_condition
                - Sensitivity for species with nonzero initial conditions
                """
                return name
        
    • Core functions

      • Fix default workers in optimize function (#58)
    • Parameter estimation

      • Fix a bug (#59)
    • Other

      • Bump minimal sicpy version to 1.6
        • integrate.simps was renamed to integrate.simpson
    Source code(tar.gz)
    Source code(zip)
  • v0.5.1(Jul 14, 2021)

    • Template

      • Add new key: legend_kws
        • legend_loc becomes invalid
      • Several updates to default rcParams
    • Core functions

      • Remove save_format from arguments in run_simulation and run_analysis
        • To modify save_format, edit viz.py in the model.
      • Use x_id to specify the index (indices) of parameter sets when running optimize
        • start and end become invalid
      • Add create_metrics : Dict[str, Callable[[np.ndarray], Union[int, float]]], optional to run_analysis
        • Allowing users to crete signaling metrics for sensitivity analysis
    Source code(tar.gz)
    Source code(zip)
  • v0.5.0(Jun 23, 2021)

    • Dependencies

      • Add pandas (See requirements.txt)
    • Template

      • Update fitness.py

        • Create OptimizationProblem
        • Add bounds for external optimizer
      • Update viz.py

        • Add figsize (default: (4, 3)) to timecourse_options and multiplot_options
    • biomass.result

      • Move visualization of estimated parameter sets to biomass.OptimizationResults.savefig()

        >>> from biomass import Model, OptimizationResults
        >>> from biomass.models import Nakakuki_Cell_2010
        >>> model = Model(Nakakuki_Cell_2010.__package__).create()
        >>> res = OptimizationResults(model)
        >>> res.savefig(figsize=(16,5), boxplot_kws={"orient": "v"})
        

    • biomass.estimation

      • Create new class: ExternalOptimizer

        >>> from scipy.optimize import differential_evolution
        >>> from biomass import Model
        >>> from biomass.models import Nakakuki_Cell_2010
        >>> model = Model(Nakakuki_Cell_2010.__package__).create()
        >>> optimizer = ExternalOptimizer(model, differential_evolution)
        >>> res = optimizer.run(
        ...     model.problem.objective,
        ...     model.problem.bounds,
        ...     strategy="best2bin",
        ...     maxiter=100,
        ...     tol=1e-4,
        ...     mutation=0.1,
        ...     recombination=0.5,
        ...     disp=True,
        ...     polish=False,
        ...     workers=-1,
        ... )
        

        differential_evolution step 1: f(x)= 7.05589 differential_evolution step 2: f(x)= 5.59166 differential_evolution step 3: f(x)= 2.80301 ... differential_evolution step 100: f(x)= 0.538524

        >>> from biomass import run_simulation
        >>> optimizer.import_solution(res.x, x_id=0)
        >>> run_simulation(model, viz_type="0")
        
    Source code(tar.gz)
    Source code(zip)
  • v0.4.1(Jun 1, 2021)

    • Create docs: https://biomass-core.readthedocs.io/en/latest/

    • Core functions

      • Update default values: https://biomass-core.readthedocs.io/en/latest/modules/core.html
    • Optimization results

      • Set estimated params and initials to be plotted in one figure
    Source code(tar.gz)
    Source code(zip)
  • v0.4.0(May 10, 2021)

    • License

    • Template

      • Don't use exec in name2idx

        Use make_dataclass instead.

        NAMES: List[str] = [...]
        
        NUM: int = len(NAMES)
        
        Parameters = make_dataclass(
            cls_name="Parameters",
            fields=[(name, int) for name in NAMES],
            namespace={"NAMES": NAMES, "NUM": NUM},
            frozen=True,
        )
        
        name2idx: Dict[str, int] = {k: v for v, k in enumerate(NAMES)}
        
        C = Parameters(**name2idx)
        
        del name2idx
        
    • Model construction

      • Use Model class

        >>> from biomass import Model
        >>> import your_model
        >>> model = Model(your_model.__package__).create()
        
    • Sensitivity analysis

      • Fix path to save sensitivity coefficients

        {your_model}/sensitivity_coefficients/{target}/{metric}.npy

    • Other

    Source code(tar.gz)
    Source code(zip)
  • v0.3.5(Mar 31, 2021)

    • Models

      • Add the insulin-dependent AKT pathway model

      • Reference:

        • Kubota, H. et al. Temporal Coding of Insulin Action through Multiplexing of the AKT Pathway. Mol. Cell 46, 820–832 (2012). https://doi.org/10.1016/j.molcel.2012.04.018
      • BioModels:

    • Template for BioMASS model construction

      • Update reaction_network.py

        from typing import Dict, List
        
        from biomass.analysis.reaction import is_duplicate
        
        
        class ReactionNetwork(object):
            """
            Reaction indices grouped according to biological processes.
            This is used for sensitivity analysis (target='reaction').
            """
        
            def __init__(self) -> None:
                self.reactions: Dict[str, List[int]] = {}
        
            def group(self):
                """
                Group reactions according to biological processes
                """
                biological_processes = []
                for process, indices in self.reactions.items():
                    if not isinstance(indices, list):
                        raise TypeError("Use list for reaction indices in {}".format(process))
                    biological_processes.append(indices)
        
                if not is_duplicate(self.reactions, biological_processes):
                    return biological_processes
        
        
    • Output

      • Update _write_best_fit_param.py

      • Example:

        # parameter set: 9
        
        
        def param_values():
            x = [0] * C.NUM
            x[C.V1] = 9.152e-02
            x[C.Km1] = 3.761e+02
            x[C.V2] = 2.200e-01
            x[C.Km2] = 3.500e+02
            x[C.V3] = 7.200e-01
            x[C.Km3] = 1.600e+02
            x[C.V4] = 6.480e-01
            x[C.Km4] = 6.000e+01
            x[C.V5] = 6.913e+01
            x[C.Km5] = 2.727e+01
            x[C.V6] = 6.913e+01
            x[C.Km6] = 2.727e+01
            x[C.KimERK] = 1.200e-02
            x[C.KexERK] = 1.800e-02
            x[C.KimpERK] = 1.200e-02
            x[C.KexpERK] = 1.800e-02
            x[C.KimppERK] = 1.100e-02
            x[C.KexppERK] = 1.300e-02
            x[C.V10] = 4.275e+02
            x[C.Km10] = 1.469e+01
            x[C.n10] = 2.593e+00
            x[C.p11] = 2.191e-04
            x[C.p12] = 1.156e-03
            x[C.p13] = 6.951e-04
            x[C.V14] = 3.090e-01
            x[C.Km14] = 8.111e+02
            x[C.V15] = 2.049e+02
            x[C.Km15] = 7.803e-03
            x[C.p16] = 2.570e-04
            x[C.p17] = 9.630e-05
            x[C.KimDUSP] = 1.832e-03
            x[C.KexDUSP] = 4.328e-02
            x[C.KimpDUSP] = 1.832e-03
            x[C.KexpDUSP] = 4.328e-02
            x[C.V20] = 3.512e-01
            x[C.Km20] = 1.321e+05
            x[C.V21] = 5.249e-02
            x[C.Km21] = 1.184e-03
            x[C.p22] = 2.570e-04
            x[C.p23] = 9.630e-05
            x[C.V24] = 3.440e+00
            x[C.Km24] = 1.912e+05
            x[C.V25] = 1.109e+02
            x[C.Km25] = 4.527e+00
            x[C.KimRSK] = 2.519e-03
            x[C.KexRSK] = 1.024e-02
            x[C.V27] = 1.390e+01
            x[C.Km27] = 4.619e+03
            x[C.V28] = 4.295e-01
            x[C.Km28] = 1.165e+00
            x[C.V29] = 9.103e-02
            x[C.Km29] = 6.333e+03
            x[C.V30] = 5.958e+01
            x[C.Km30] = 7.801e+00
            x[C.V31] = 5.691e+01
            x[C.Km31] = 1.543e-02
            x[C.n31] = 1.713e+00
            x[C.p32] = 1.100e-03
            x[C.p33] = 1.959e-03
            x[C.p34] = 7.572e-04
            x[C.V35] = 5.050e+00
            x[C.Km35] = 1.795e+03
            x[C.V36] = 1.218e-01
            x[C.Km36] = 2.394e+03
            x[C.V37] = 1.178e+03
            x[C.Km37] = 1.062e+02
            x[C.p38] = 2.570e-04
            x[C.p39] = 9.630e-05
            x[C.KimFOS] = 1.205e-01
            x[C.KexFOS] = 1.590e-01
            x[C.KimpcFOS] = 1.205e-01
            x[C.KexpcFOS] = 1.590e-01
            x[C.V42] = 9.649e-02
            x[C.Km42] = 5.639e+02
            x[C.V43] = 3.568e-03
            x[C.Km43] = 1.382e+02
            x[C.V44] = 1.290e-03
            x[C.Km44] = 2.725e-02
            x[C.p45] = 2.570e-04
            x[C.p46] = 9.630e-05
            x[C.p47] = 2.140e-01
            x[C.m47] = 1.288e+01
            x[C.p48] = 3.351e-02
            x[C.p49] = 4.279e-02
            x[C.m49] = 2.331e+00
            x[C.p50] = 3.491e-02
            x[C.p51] = 1.053e-03
            x[C.m51] = 4.536e+00
            x[C.p52] = 2.140e-01
            x[C.m52] = 1.288e+01
            x[C.p53] = 3.351e-02
            x[C.p54] = 4.279e-02
            x[C.m54] = 2.331e+00
            x[C.p55] = 3.491e-02
            x[C.p56] = 1.053e-03
            x[C.m56] = 4.536e+00
            x[C.V57] = 2.366e+02
            x[C.Km57] = 7.976e-04
            x[C.n57] = 1.649e+00
            x[C.p58] = 2.471e-09
            x[C.p59] = 2.889e-06
            x[C.p60] = 6.575e-02
            x[C.p61] = 2.517e+00
            x[C.KimF] = 2.058e-02
            x[C.KexF] = 7.998e-02
            x[C.p63] = 1.731e+00
            x[C.KF31] = 3.337e-03
            x[C.nF31] = 1.001e+00
            x[C.a] = 3.380e+02
            x[C.Vn] = 2.200e-01
            x[C.Vc] = 9.400e-01
            x[C.Ligand] = 0.000e+00
            x[C.EGF] = 0.000e+00
            x[C.HRG] = 1.000e+00
            x[C.no_ligand] = 2.000e+00
        
        
        def initial_values():
            y0 = [0] * V.NUM
            y0[V.CREBn] = 1.000e+03
            y0[V.ERKc] = 9.600e+02
            y0[V.Elk1n] = 1.510e+03
            y0[V.RSKc] = 3.530e+02
        
    • Visualization

      • Close #45
    • Other

      • Update function to get the steady state for the untreated condition

        • Use scipy.integrate.ode
      • Use math.isnan for single floats

      • code refactoring

    Source code(tar.gz)
    Source code(zip)
  • v0.3.4(Mar 9, 2021)

  • v0.3.3(Feb 16, 2021)

    Update optimize

    • Add new option: initial_threshold

      • initial_threshold : float (default: 1e12)

      Threshold on objective function value used to generate initial population. Default value is 1e12 (numerically solvable).

    def optimize(
        model: ModelObject,
        start: int,
        end: Optional[int] = None,
        options: Optional[dict] = None,
    ) -> None:
        """
        Run GA for parameter estimation.
    
        Paremters
        ---------
        model : ModelObject
            Model for parameter estimation.
    
        start : int
            Index of parameter set to estimate.
    
        end : int, optional
            When `end` is specified, parameter sets from `start` to `end` will be estimated.
    
        options : dict, optional
            popsize : int (default: 5)
                A multiplier for setting the total population size.
                The population has popsize * len(search_param) individuals.
    
            max_generation : int (default: 10000)
                Stop optimization if Generation > max_generation.
    
            initial_threshold : float (default: 1e12)
                Threshold on objective function value used to generate initial population.
                Default value is 1e12 (numerically solvable).
    
            allowable_error : float (default: 0.0)
                Stop optimization if Best Fitness <= allowable_error.
    
            local_search_method : str (default: 'mutation')
                Method used in local search. Should be one of
                * 'mutation' : NDM/MGG
                * 'Powell' : Modified Powell method
                * 'DE' : Differential Evolution (strategy: best2bin)
    
            n_children : int (default: 200)
                (method='mutation') The number of children generated in NDM/MGG.
    
            maxiter : int (default: 10)
                (method='Powell' or 'DE') The maximum number of iterations
                over which the entire population is evolved.
    
            workers : int (default: -1 if `end` is None else 1)
                (method='DE') The population is subdivided into workers sections and
                evaluated in parallel (uses multiprocessing.Pool). Supply -1 to use
                all available CPU cores. Set workers to 1 when searching multiple
                parameter sets simultaneously.
    
            overwrite : bool (default: False)
                If True, the out/n folder will be overwritten.
    
        Example
        -------
        >>> from biomass.models import Nakakuki_Cell_2010
        >>> from biomass import optimize
        >>> model = Nakakuki_Cell_2010.create()
        >>> optimize(
                model=model, start=1, end=10,
                options={
                    'max_generation': 10000,
                    'allowable_error': 0.5
                }
            )
        """
        ...
    

    Update run_analysis

    def run_analysis(
        model: ModelObject,
        target: str,
        metric: str = "integral",
        style: str = "barplot",
        save_format: str = "pdf",
        options: Optional[dict] = None,
    ) -> None:
        """
        Perform sensitivity analysis to identify critical parameters, species or
        reactions in the complex biological network.
    
        The sensitivity S(y,x) was calculated according to the following equation:
        S(y,x) = d ln(yi) / d ln (xj), where yi is the signaling metric and xj is
        each nonzero species, parameter value or reaction rate.
    
        Paremters
        ---------
        model : ModelObject
            Model for sensitivity analysis.
    
        target : str
            * 'reaction'
            * 'initial_condition'
            * 'parameter'
    
        metric : str (default: 'integral')
            * 'maximum' : The maximum value.
            * 'minimum' : The minimum value.
            * 'argmax' : The time to reach the maximum value.
            * 'argmin' : The time to reach the minimum value.
            * 'timepoint' : The simulated value at the time point set via options['timepoint'].
            * 'duration' :  The time it takes to decline below the threshold set via options['duration'].
            * 'integral' : The integral of concentration over the observation time.
    
        style : str (default: 'barplot')
            * 'barplot'
            * 'heatmap'
    
        save_format : str (default: "pdf")
            Either "png" or "pdf", indicating whether to save figures
            as png or pdf format.
    
        options : dict, optional
            show_indices : bool (default: True)
                (target == 'reaction') Set to True to put reaction index on each bar.
    
            excluded_params : list of strings
                (target == 'parameter') List of parameters which are not used for analysis.
    
            excluded_initials : list of strings
                (target == 'initial_condition') List of species which are not used for analysis.
    
            timepoint : int (default: model.sim.t[-1])
                (metric == 'timepoint') Which timepoint to use.
    
            duration : float (default: 0.5)
                (metric == 'duration') 0.1 for 10% of its maximum.
    
        Example
        -------
        >>> from biomass.models import Nakakuki_Cell_2010
        >>> from biomass import run_analysis
        >>> model = Nakakuki_Cell_2010.create()
    
        1. Parameter
        >>> run_analysis(
                model,
                target='parameter',
                options = {
                    'excluded_params': [
                        'a', 'Vn', 'Vc', 'Ligand', 'EGF', 'HRG', 'no_ligand'
                    ]
                }
            )
    
        2. Initial condition
        >>> run_analysis(
                model,
                target='initial_condition',
            )
    
        3. Reaction
        >>> run_analysis(
                model,
                target='reaction',
            )
    
        """
        ...
    
    Source code(tar.gz)
    Source code(zip)
  • v0.3.2(Jan 27, 2021)

    Coding style

    Code is formatted with black. Coding style is checked with flake8 and isort.

    $ pip install pre-commit
    
    $ pre-commit install
    

    Display model information

    Rename function: ~~show_properties~~ → show_info

    from biomass.models import Nakakuki_Cell_2010
    
    Nakakuki_Cell_2010.show_info()
    

    Nakakuki_Cell_2010 information
    ------------------------------
    36 species
    115 parameters, of which 75 to be estimated
    

    Add new method to OptimizationResults: trace_obj

    Visualize objective function traces for different optimization runs.

    from biomass.models import Nakakuki_Cell_2010
    from biomass.result import OptimizationResults
    
    model = Nakakuki_Cell_2010.create()
    res = OptimizationResults(model)
    
    res.trace_obj()
    
    Source code(tar.gz)
    Source code(zip)
  • v0.3.1(Jan 15, 2021)

    Updates:

    New model

    Dynamic pathway model of TNFα-induced NFκB signal transduction

    Oppelt, A. et al. Model-based identification of TNFα-induced IKKβ-mediated and IκBα-mediated regulation of NFκB signal transduction as a tool to quantify the impact of drug-induced liver injury compounds. npj Syst. Biol. Appl. 4, 23 (2018). https://doi.org/10.1038/s41540-018-0058-z

    Sensitivity analysis

    New signaling metrics

    • 'argmax' : The time to reach the maximum value.
    • 'argmin' : The time to reach the minimum value.
    • 'timepoint' : The simulated value at the time point set via options['timepoint'].
    • 'duration' : The time it takes to decline below the threshold set via options['duration'].

    Parameter estimation

    • Set mutation constant (differential weight: F) to 0.1

    • Set recombination constant (crossover probability: CR) to 0.9

    Source code(tar.gz)
    Source code(zip)
  • v0.3.0(Jan 6, 2021)

    Updates:

    • Use BioMassModel for the first argument of core functions

    Example usage

    1. Create an executable model

      from biomass.models import Nakakuki_Cell_2010
      
      model = Nakakuki_Cell_2010.create()
      
    2. Estimate model parameters from experimental data

      from biomass import optimize
      
      optimize(
          model=model, start=1, options={
              "popsize": 3,
              "max_generation": 1000,
              "allowable_error": 0.5,
              "local_search_method": "DE",
          }
      )
      
    3. Export optimized parameters in CSV format

      from biomass.result import OptimizationResults
      
      res = OptimizationResults(model)
      res.to_csv()
      
    4. Visualize simulation results

      from biomass import run_simulation
      
      run_simulation(model, viz_type='average', show_all=False, stdev=True)
      
    5. Perform sensitivity analysis

      from biomass import run_analysis
      
      run_analysis(model, target='reaction', metric='integral', style='barplot')
      
    Source code(tar.gz)
    Source code(zip)
  • v0.2.3(Dec 26, 2020)

  • v0.2.2(Dec 14, 2020)

    Updates:

    Added new local search method: "Powell" and "DE"

    def optimize(model, *args, options: Optional[dict] = None) -> None:
        """
        Run GA for parameter estimation.
    
        Paremters
        ---------
        model : module
            Model for parameter estimation.
    
        options: dict, optional
            popsize : int (default: 5)
                A multiplier for setting the total population size.
                The population has popsize * len(search_param) individuals.
    
            max_generation : int (default: 10000)
                Stop if Generation > max_generation.
    
            allowable_error : float (default: 0.0)
                Stop if Best Fitness <= allowable_error.
    
            local_search_method : str (default: 'mutation')
                Method used in local search. Should be one of
                - 'mutation' : NDM/MGG
                - 'Powell' : Modified Powell method
                - 'DE' : Differential Evolution (strategy: best2bin)
    
            n_children : int (default: 200)
                (method='mutation') The number of children generated in NDM/MGG.
    
            workers : int (default: -1 if len(args) == 1 else 1)
                (method='DE') The population is subdivided into workers sections and
                evaluated in parallel (uses multiprocessing.Pool). Supply -1 to use
                all available CPU cores. Set workers to 1 when searching multiple
                parameter sets simultaneously.
    
            overwrite : bool (default: False)
                If True, the out/n folder will be overwritten.
        """
    

    Example usage

    from biomass.models import Nakakuki_Cell_2010
    from biomass import optimize
    
    optimize(
        Nakakuki_Cell_2010, 1, options={
            'popsize': 3,
            'allowable_error': 0.5,
            'local_search_method': 'DE'
        }
    )
    
    Source code(tar.gz)
    Source code(zip)
  • v0.2.1(Nov 25, 2020)

  • v0.2.0(Nov 21, 2020)

    Updates:

    • Change sim.normalization type from bool to dict (nested):

      def __init__(self):
          super().__init__(perturbation={})
          self.normalization = {}
          for obs_name in observables:
              self.normalization[obs_name] = {
                  'timepoint' : None,
                  'condition' : []
              }
      
      • 'timepoint' : Optional[int]

        • The time point at which simulated values are normalized. If None, the maximum value will be used for normalization.
      • 'condition' : list of strings

        • The experimental conditions to use for normalization. If empty, all conditions defined in sim.conditions will be used.
    • Move documentation to https://github.com/okadalabipr/biomass_docs.jl

    Source code(tar.gz)
    Source code(zip)
Owner
BioMASS
Open-source software project providing tools for modeling and analysis of signaling systems.
BioMASS
Snakemake workflow for converting FASTQ files to self-contained CRAM files with maximum lossless compression.

Snakemake workflow: name A Snakemake workflow for description Usage The usage of this workflow is described in the Snakemake Workflow Catalog. If

Algorithms for reproducible bioinformatics (Koesterlab) 1 Dec 16, 2021
Universal data analysis tools for atmospheric sciences

U_analysis Universal data analysis tools for atmospheric sciences Script written in python 3. This file defines multiple functions that can be used fo

Luis Ackermann 1 Oct 10, 2021
Udacity-api-reporting-pipeline - Udacity api reporting pipeline

udacity-api-reporting-pipeline In this exercise, you'll use portions of each of

Fabio Barbazza 1 Feb 15, 2022
Hue Editor: Open source SQL Query Assistant for Databases/Warehouses

Hue Editor: Open source SQL Query Assistant for Databases/Warehouses

Cloudera 759 Jan 07, 2023
Uses MIT/MEDSL, New York Times, and US Census datasources to analyze per-county COVID-19 deaths.

Covid County Executive summary Setup Install miniconda, then in the command line, run conda create -n covid-county conda activate covid-county conda i

Ahmed Fasih 1 Dec 22, 2021
Developed for analyzing the covariance for OrcVIO

about This repo is developed for analyzing the covariance for OrcVIO environment setup platform ubuntu 18.04 using conda conda env create --file envir

Sean 1 Dec 08, 2021
PyNHD is a part of HyRiver software stack that is designed to aid in watershed analysis through web services.

A part of HyRiver software stack that provides access to NHD+ V2 data through NLDI and WaterData web services

Taher Chegini 23 Dec 14, 2022
Average time per match by division

HW_02 Unzip matches.rar to access .json files for matches. Get an API key to access their data at: https://developer.riotgames.com/ Average time per m

11 Jan 07, 2022
CSV database for chihuahua (HUAHUA) blockchain transactions

super-fiesta Shamelessly ripped components from https://github.com/hodgerpodger/staketaxcsv - Thanks for doing all the hard work. This code does only

Arlene Macciaveli 1 Jan 07, 2022
MotorcycleParts DataAnalysis python

We work with the accounting department of a company that sells motorcycle parts. The company operates three warehouses in a large metropolitan area.

NASEEM A P 1 Jan 12, 2022
Time ranges with python

timeranges Time ranges. Read the Docs Installation pip timeranges is available on pip: pip install timeranges GitHub You can also install the latest v

Micael Jarniac 2 Sep 01, 2022
Hangar is version control for tensor data. Commit, branch, merge, revert, and collaborate in the data-defined software era.

Overview docs tests package Hangar is version control for tensor data. Commit, branch, merge, revert, and collaborate in the data-defined software era

Tensorwerk 193 Nov 29, 2022
NumPy aware dynamic Python compiler using LLVM

Numba A Just-In-Time Compiler for Numerical Functions in Python Numba is an open source, NumPy-aware optimizing compiler for Python sponsored by Anaco

Numba 8.2k Jan 07, 2023
WaveFake: A Data Set to Facilitate Audio DeepFake Detection

WaveFake: A Data Set to Facilitate Audio DeepFake Detection This is the code repository for our NeurIPS 2021 (Track on Datasets and Benchmarks) paper

Chair for Sys­tems Se­cu­ri­ty 27 Dec 22, 2022
Implementation in Python of the reliability measures such as Omega.

OmegaPy Summary Simple implementation in Python of the reliability measures: Omega Total, Omega Hierarchical and Omega Hierarchical Total. Name Link O

Rafael Valero Fernández 2 Apr 27, 2022
An orchestration platform for the development, production, and observation of data assets.

Dagster An orchestration platform for the development, production, and observation of data assets. Dagster lets you define jobs in terms of the data f

Dagster 6.2k Jan 08, 2023
Mining the Stack Overflow Developer Survey

Mining the Stack Overflow Developer Survey A prototype data mining application to compare the accuracy of decision tree and random forest regression m

1 Nov 16, 2021
t-SNE and hierarchical clustering are popular methods of exploratory data analysis, particularly in biology.

tree-SNE t-SNE and hierarchical clustering are popular methods of exploratory data analysis, particularly in biology. Building on recent advances in s

Isaac Robinson 61 Nov 21, 2022
Includes all files needed to satisfy hw02 requirements

HW 02 Data Sets Mean Scale Score for Asian and Hispanic Students, Grades 3 - 8 This dataset provides insights into the New York City education system

7 Oct 28, 2021
Feature Detection Based Template Matching

Feature Detection Based Template Matching The classification of the photos was made using the OpenCv template Matching method. Installation Use the pa

Muhammet Erem 2 Nov 18, 2021