LabGraph is a a Python-first framework used to build sophisticated research systems with real-time streaming, graph API, and parallelism.

Overview

labgraph-interactive

LabGraph Interactive

Learning LabGraph online.

What is LabGraph?

LabGraph is a a Python-first framework used to build sophisticated research systems with real-time streaming, graph API, and parallelism. Facebook Researchers use it prototype wearable hardware systems and process digital signals under their VR/AR efforts into the Metaverse.

To put it simply, LabGraph sets the relationship between the inputs and outputs of computations and provides the needed tooling to run them in parallel to help developers focus on algorithms instead of the environment.

What is LabGraph Interactive?

As MLH Fellows who have not used LabGraph before, we had a hard time understanding its purpose, how to set it up correctly, and what to expect from the library. So we decided to help future MLH Fellows get up to speed both on concepts and usage with an interactive tool.

We built the interactive tool to let users get the taste of LabGraph with zero commitments. The interactive terminal lets the users run simulations we prepared with different numbers of features and see their expected outputs.

How to Use LabGraph Interactive?

  1. Navigate to the website hosted on GitHub Pages at mlh-fellowship.github.io/labgraph-interactive
  2. Type help into the terminal
  3. Run the commands you would like to try out
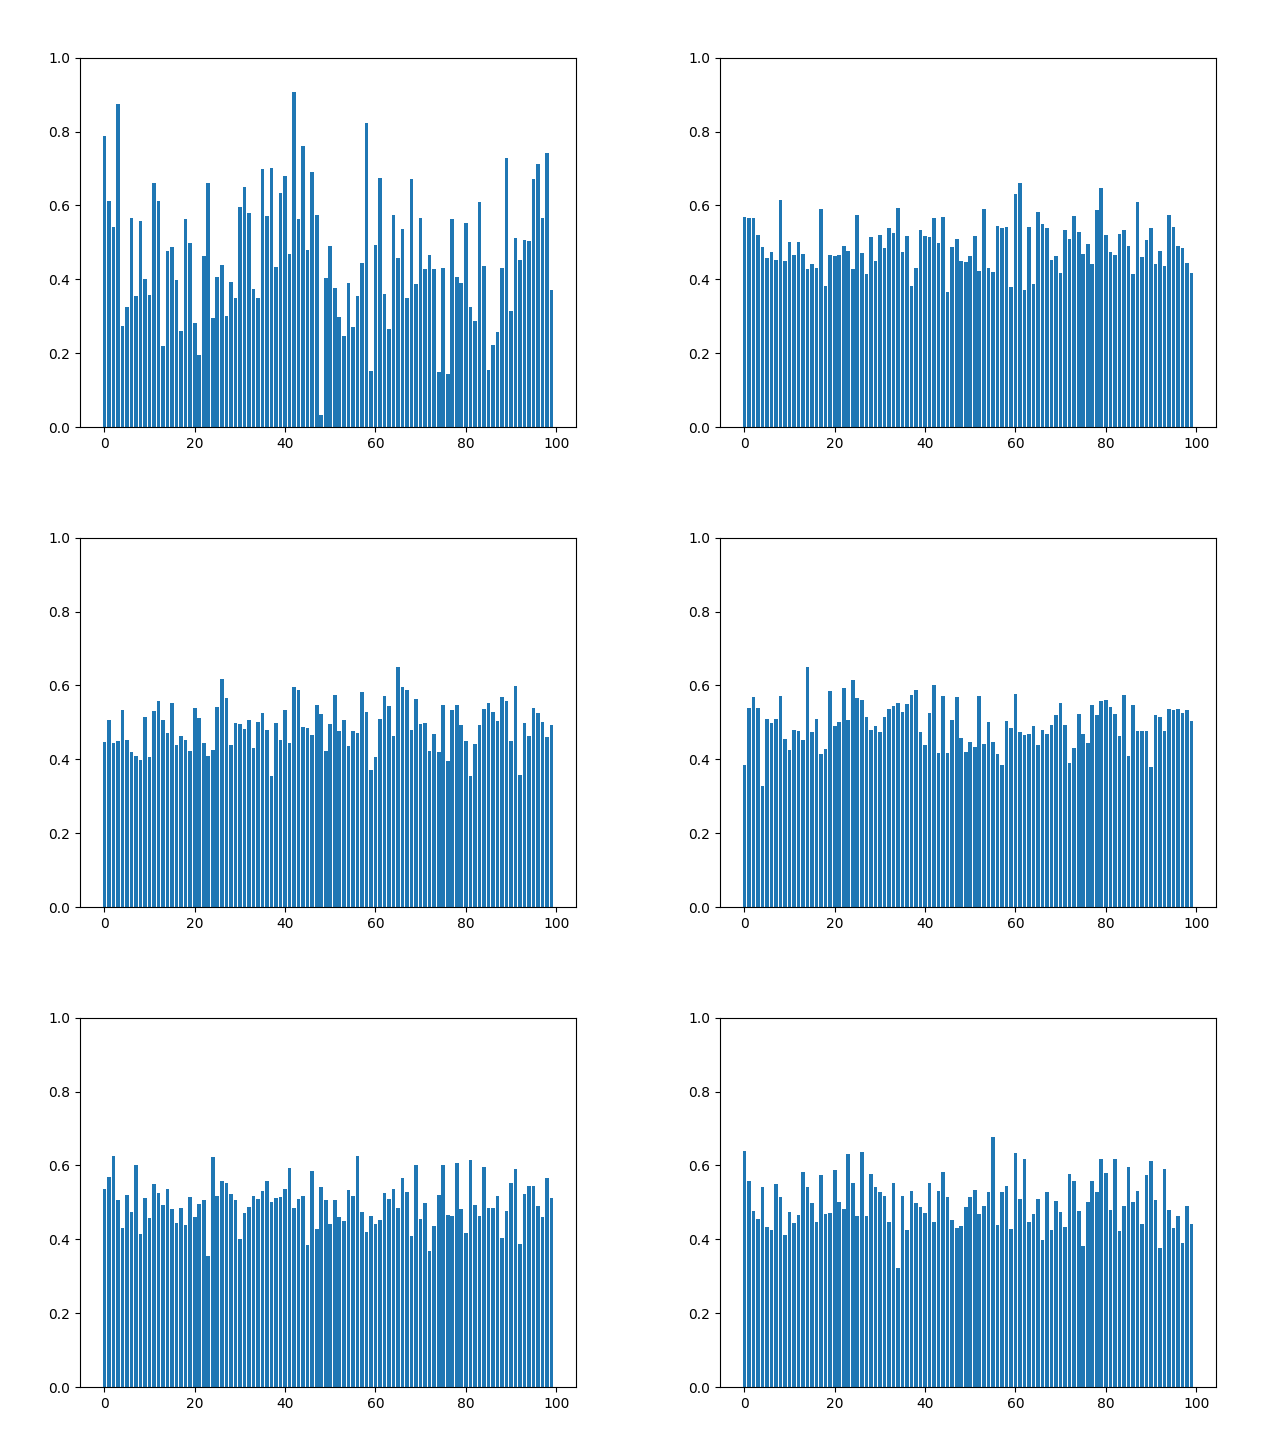
  4. Check the resulted graph built with random data

How to Use LabGraph?

To run LabGraph simulations on your machine, follow steps listed below:

  1. Run pip install labgraph to install LabGraph along with its dependecieis
  2. Run python setup.py install to work with the simulation we prepared and listed under random_labgraph/simulation.py
  3. Run python random_labgraph/simulation.py 100 to get a graph produced with LabGraph's node in real-time

License

This project is served unded the MIT License.

MIT License

Copyright (c) 2022 MLH Fellowship

Permission is hereby granted, free of charge, to any person obtaining a copy
of this software and associated documentation files (the "Software"), to deal
in the Software without restriction, including without limitation the rights
to use, copy, modify, merge, publish, distribute, sublicense, and/or sell
copies of the Software, and to permit persons to whom the Software is
furnished to do so, subject to the following conditions:

The above copyright notice and this permission notice shall be included in all
copies or substantial portions of the Software.

THE SOFTWARE IS PROVIDED "AS IS", WITHOUT WARRANTY OF ANY KIND, EXPRESS OR
IMPLIED, INCLUDING BUT NOT LIMITED TO THE WARRANTIES OF MERCHANTABILITY,
FITNESS FOR A PARTICULAR PURPOSE AND NONINFRINGEMENT. IN NO EVENT SHALL THE
AUTHORS OR COPYRIGHT HOLDERS BE LIABLE FOR ANY CLAIM, DAMAGES OR OTHER
LIABILITY, WHETHER IN AN ACTION OF CONTRACT, TORT OR OTHERWISE, ARISING FROM,
OUT OF OR IN CONNECTION WITH THE SOFTWARE OR THE USE OR OTHER DEALINGS IN THE
SOFTWARE.
Owner
MLH Fellowship
An internship alternative for software engineers, by Major League Hacking
MLH Fellowship
An automatic prover for tautologies in Metamath

completeness An automatic prover for tautologies in Metamath This program implements the constructive proof of the Completeness Theorem for propositio

Scott Fenton 2 Dec 15, 2021
Squidpy is a tool for the analysis and visualization of spatial molecular data.

Squidpy is a tool for the analysis and visualization of spatial molecular data. It builds on top of scanpy and anndata, from which it inherits modularity and scalability. It provides analysis tools t

Theis Lab 251 Dec 19, 2022
a plottling library for python, based on D3

Hello August 2013 Hello! Maybe you're looking for a nice Python interface to build interactive, javascript based plots that look as nice as all those

Mike Dewar 1.4k Dec 28, 2022
a python function to plot a geopandas dataframe

Pretty GeoDataFrame A minimum python function (~60 lines) to draw pretty geodataframe. Based on matplotlib, shapely, descartes. Installation just use

haoming 27 Dec 05, 2022
Python package to visualize and cluster partial dependence.

partial_dependence A python library for plotting partial dependence patterns of machine learning classifiers. The technique is a black box approach to

NYU Visualization Lab 25 Nov 14, 2022
Data Visualization Guide for Presentations, Reports, and Dashboards

This is a highly practical and example-based guide on visually representing data in reports and dashboards.

Anton Zhiyanov 395 Dec 29, 2022
HW 02 for CS40 - matplotlib practice

HW 02 for CS40 - matplotlib practice project instructions https://github.com/mikeizbicki/cmc-csci040/tree/2021fall/hw_02 Drake Lyric Analysis Bar Char

13 Oct 27, 2021
Cryptocurrency Centralized Exchange Visualization

This is a simple one that uses Grafina to visualize cryptocurrency from the Bitkub exchange. This service will make a request to the Bitkub API from your wallet and save the response to Postgresql. G

Popboon Mahachanawong 1 Nov 24, 2021
Attractors is a package for simulation and visualization of strange attractors.

attractors Attractors is a package for simulation and visualization of strange attractors. Installation The simplest way to install the module is via

Vignesh M 45 Jul 31, 2022
A tool for automatically generating 3D printable STLs from freely available lidar scan data.

mini-map-maker A tool for automatically generating 3D printable STLs from freely available lidar scan data. Screenshots Tutorial To use this script, g

Mike Abbott 51 Nov 06, 2022
A central task in drug discovery is searching, screening, and organizing large chemical databases

A central task in drug discovery is searching, screening, and organizing large chemical databases. Here, we implement clustering on molecular similarity. We support multiple methods to provide a inte

NVIDIA Corporation 124 Jan 07, 2023
A set of useful perceptually uniform colormaps for plotting scientific data

Colorcet: Collection of perceptually uniform colormaps Build Status Coverage Latest dev release Latest release Docs What is it? Colorcet is a collecti

HoloViz 590 Dec 31, 2022
A Jupyter - Leaflet.js bridge

ipyleaflet A Jupyter / Leaflet bridge enabling interactive maps in the Jupyter notebook. Usage Selecting a basemap for a leaflet map: Loading a geojso

Jupyter Widgets 1.3k Dec 27, 2022
A gui application to visualize various sorting algorithms using pure python.

Sorting Algorithm Visualizer A gui application to visualize various sorting algorithms using pure python. Language : Python 3 Libraries required Tkint

Rajarshi Banerjee 19 Nov 30, 2022
Visualization Library

CamViz Overview // Installation // Demos // License Overview CamViz is a visualization library developed by the TRI-ML team with the goal of providing

Toyota Research Institute - Machine Learning 67 Nov 24, 2022
Graphing communities on Twitch.tv in a visually intuitive way

VisualizingTwitchCommunities This project maps communities of streamers on Twitch.tv based on shared viewership. The data is collected from the Twitch

Kiran Gershenfeld 312 Jan 07, 2023
I'm doing Genuary, an aritifiacilly generated month to build code that make beautiful things

Genuary 2022 I'm doing Genuary, an aritifiacilly generated month to build code that make beautiful things. Every day there is a new prompt for making

JoaquĆ­n Feltes 1 Jan 10, 2022
Simple Inkscape Scripting

Simple Inkscape Scripting Description In the Inkscape vector-drawing program, how would you go about drawing 100 diamonds, each with a random color an

Scott Pakin 140 Dec 27, 2022
A Python package that provides evaluation and visualization tools for the DexYCB dataset

DexYCB Toolkit DexYCB Toolkit is a Python package that provides evaluation and visualization tools for the DexYCB dataset. The dataset and results wer

NVIDIA Research Projects 107 Dec 26, 2022
Movies-chart - A CLI app gets the top 250 movies of all time from imdb.com and the top 100 movies from rottentomatoes.com

movies-chart This CLI app gets the top 250 movies of all time from imdb.com and

3 Feb 17, 2022