Project: Netflix Data Analysis and Visualization with Python

Overview

Project: Netflix Data Analysis and Visualization with Python

MyNetflixDashboard

Table of Contents

  1. General Info
  2. Installation
  3. Demo
  4. Usage and Main Functionalities
  5. Contributing

General Info

This is a compact Data Visualization project I worked on for fun and to deepen my knowledge about visualizations and graphs using python libraries.

From conception and design to every line of code, the entire Dashboard was worked on by myself. During this project, I was able to repeat and deepen what I had previously learned in my Data Science course of study. Especially, I was able to familiarize myself with pandas and work on my data visualization skills, which I greatly enjoied!

The dataset I used for the Netflix data analytics task consists of my personal Netflix data, which I requested through their website. You can get access to your own data through this link. Feel free to download it and use my code to look into your own viewing behaviour :)

Installation

Requirements: Make sure you have Python 3.7+ installed on your computer. You can download the latest version of Python here.

Req. Packages:

  • pandas
  • dash
  • dash_bootstrap_components
  • ploty.express
  • plotly.graph_objects

Demo

Demo_MyNetflixDashboard_komprimiert.mov

Usage and Main Functionalities

Want to know more about your own Netflix behaviour? For test usage you can download your own Netflix data. Just follow this link and Netflix will send you your personal data.

Please also refer to the comments within the code itself to get more information on the functionalities of the program.


0. Preparing the data for analysis

  • This part cleans up the original data and prepares it for analysis.
  • In the process, columns that are not needed are dropped.
  • Time data is converted into appropriate time formats and split into several columns. The days of the week are added.
  • In addition, the titles of the movies/series are split (title, season number, episode name).

1. Analysis

  • This part of the code is about analyzing the data.
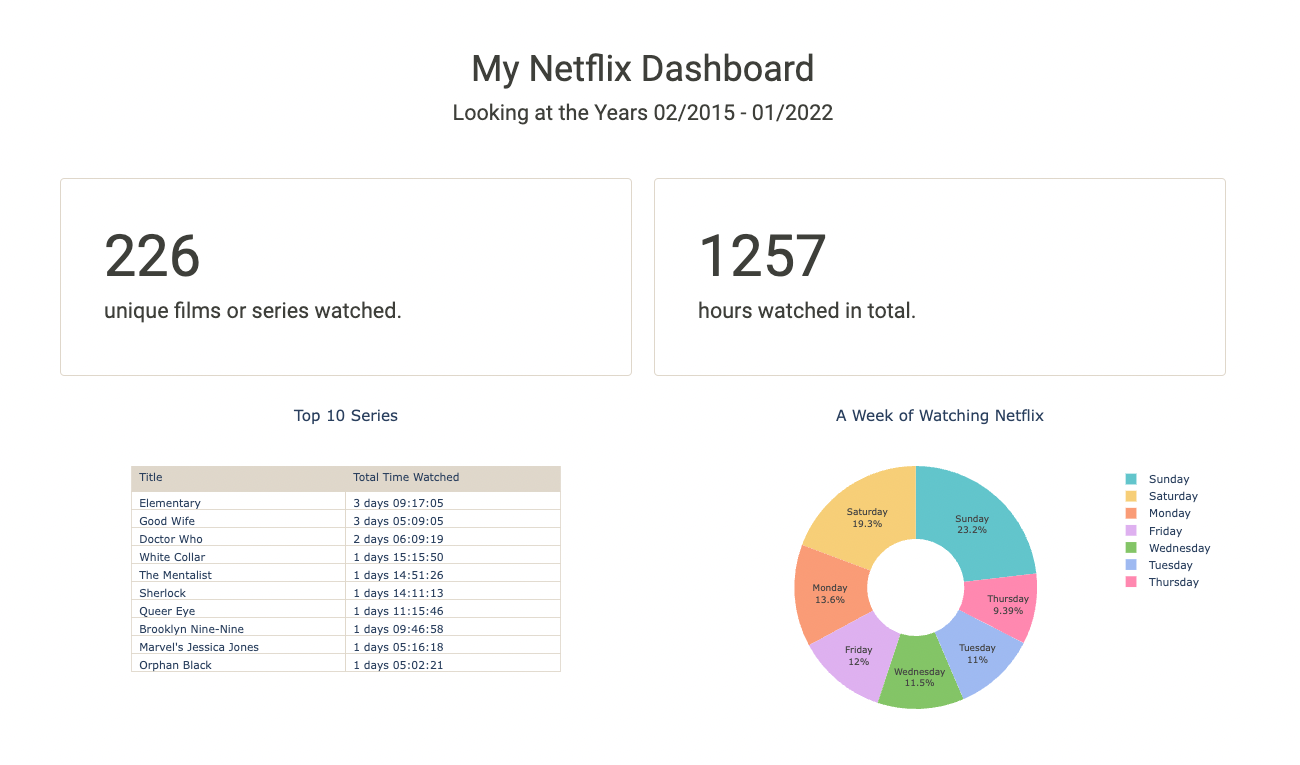
  • We find out how many movies or series were watched over the entire period. We also count the total number of hours Netflix was watched.
  • A pie chart is created that shows which days of the week are watched.
  • In addition, the top 10 series that were watched the longest (in terms of total duration) are displayed.
  • A line chart shows Netflix viewing behavior over the years, counting the total number of hours Netflix was watched.

NetflixOverTime

2. Dash App Layout

  • plotly's Dash is now used to create an Interactive Dashboard of Netflix data.
  • The individual graphics and texts are arranged in rows and containers.
  • This part also includes a dropdown menu that the user can interact with.

3. App Callback

  • Here we connect an interactive bar chart to the Dash Components.
  • The chart represents our total annual hours of Netflix watched, grouped by month. The chart is filterable by year.

MonthlyViews

Contributing

Your comments, suggestions, and contributions are welcome. Please feel free to contribute pull requests or create issues for bugs and feature requests.
Owner
Kathrin Hälbich
Data Science Student and PR- & Marketing-Expert
Kathrin Hälbich
A highly efficient and modular implementation of Gaussian Processes in PyTorch

GPyTorch GPyTorch is a Gaussian process library implemented using PyTorch. GPyTorch is designed for creating scalable, flexible, and modular Gaussian

3k Jan 02, 2023
Automatic earthquake catalog building workflow: EQTransformer + Siamese EQTransformer + PickNet + REAL + HypoInverse

Automatic regional-scale earthquake catalog building workflow: EQTransformer + Siamese EQTransforme

Xiao Zhuowei 9 Nov 27, 2022
Cleaning and analysing aggregated UK political polling data.

Analysing aggregated UK polling data The tweet collection & storage pipeline used in email-service is used to also collect tweets from @britainelects.

Ajay Pethani 0 Dec 22, 2021
Accurately separate the TLD from the registered domain and subdomains of a URL, using the Public Suffix List.

tldextract Python Module tldextract accurately separates the gTLD or ccTLD (generic or country code top-level domain) from the registered domain and s

John Kurkowski 1.6k Jan 03, 2023
PySpark bindings for H3, a hierarchical hexagonal geospatial indexing system

h3-pyspark: Uber's H3 Hexagonal Hierarchical Geospatial Indexing System in PySpark PySpark bindings for the H3 core library. For available functions,

Kevin Schaich 12 Dec 24, 2022
Pipeline to convert a haploid assembly into diploid

HapDup (haplotype duplicator) is a pipeline to convert a haploid long read assembly into a dual diploid assembly. The reconstructed haplotypes

Mikhail Kolmogorov 50 Jan 05, 2023
Tuplex is a parallel big data processing framework that runs data science pipelines written in Python at the speed of compiled code

Tuplex is a parallel big data processing framework that runs data science pipelines written in Python at the speed of compiled code. Tuplex has similar Python APIs to Apache Spark or Dask, but rather

Tuplex 791 Jan 04, 2023
Investigating EV charging data

Investigating EV charging data Introduction: Got an opportunity to work with a home monitoring technology company over the last 6 months whose goal wa

Yash 2 Apr 07, 2022
CubingB is a timer/analyzer for speedsolving Rubik's cubes, with smart cube support

CubingB is a timer/analyzer for speedsolving Rubik's cubes (and related puzzles). It focuses on supporting "smart cubes" (i.e. bluetooth cubes) for recording the exact moves of a solve in real time.

Zach Wegner 5 Sep 18, 2022
A simple and efficient tool to parallelize Pandas operations on all available CPUs

Pandaral·lel Without parallelization With parallelization Installation $ pip install pandarallel [--upgrade] [--user] Requirements On Windows, Pandara

Manu NALEPA 2.8k Dec 31, 2022
Streamz helps you build pipelines to manage continuous streams of data

Streamz helps you build pipelines to manage continuous streams of data. It is simple to use in simple cases, but also supports complex pipelines that involve branching, joining, flow control, feedbac

Python Streamz 1.1k Dec 28, 2022
CINECA molecular dynamics tutorial set

High Performance Molecular Dynamics Logging into CINECA's computer systems To logon to the M100 system use the following command from an SSH client ss

J. W. Dell 0 Mar 13, 2022
Desafio 1 ~ Bantotal

Challenge 01 | Bantotal Please read the instructions for the challenge by selecting your preferred language below: Español Português License Copyright

Maratona Behind the Code 44 Sep 28, 2022
Find exposed data in Azure with this public blob scanner

BlobHunter A tool for scanning Azure blob storage accounts for publicly opened blobs. BlobHunter is a part of "Hunting Azure Blobs Exposes Millions of

CyberArk 250 Jan 03, 2023
PyPSA: Python for Power System Analysis

1 Python for Power System Analysis Contents 1 Python for Power System Analysis 1.1 About 1.2 Documentation 1.3 Functionality 1.4 Example scripts as Ju

758 Dec 30, 2022
Statistical & Probabilistic Analysis of Store Sales, University Survey, & Manufacturing data

Statistical_Modelling Statistical & Probabilistic Analysis of Store Sales, University Survey, & Manufacturing data Statistical Methods for Decision Ma

Avnika Mehta 1 Jan 27, 2022
Analyse the limit order book in seconds. Zoom to tick level or get yourself an overview of the trading day.

Analyse the limit order book in seconds. Zoom to tick level or get yourself an overview of the trading day. Correlate the market activity with the Apple Keynote presentations.

2 Jan 04, 2022
A Python package for Bayesian forecasting with object-oriented design and probabilistic models under the hood.

Disclaimer This project is stable and being incubated for long-term support. It may contain new experimental code, for which APIs are subject to chang

Uber Open Source 1.6k Dec 29, 2022
AWS Glue ETL Code Samples

AWS Glue ETL Code Samples This repository has samples that demonstrate various aspects of the new AWS Glue service, as well as various AWS Glue utilit

AWS Samples 1.2k Jan 03, 2023
Probabilistic reasoning and statistical analysis in TensorFlow

TensorFlow Probability TensorFlow Probability is a library for probabilistic reasoning and statistical analysis in TensorFlow. As part of the TensorFl

3.8k Jan 05, 2023