ETL Pipeline with Airflow, Spark, s3, MongoDB and Amazon Redshift
About • Scenario • Base Concepts • Prerequisites • Set-up • Installation • Airflow Interface • Pipeline Task by Task • Shut Down and Restart Airflow • Learning Resources
About
Educational project on how to build an ETL (Extract, Transform, Load) data pipeline, orchestrated with Airflow.
An AWS s3 bucket is used as a Datalake in which json files are stored. The data is extracted from a json and parsed (cleaned). It is then transformed/processed with Spark (PySpark) and loaded/stored in either a Mongodb database or in an Amazon Redshift Data Warehouse.
The pipeline architecture - author's interpretation:

Note: Since this project was built for learning purposes and as an example, it functions only for a single scenario and data schema.
The project is built in Python and it has 2 main parts:
- The Airflow DAG file, dags/dagRun.py, which orchestrates the data pipeline tasks.
- The PySpark data transformation/processing script, located in sparkFiles/sparkProcess.py
Note: The code and especially the comments in the python files dags/dagRun.py and sparkFiles/sparkProcess.py are intentionally verbose for a better understanding of the functionality.
Scenario
The Romanian COVID-19 data, provided by https://datelazi.ro/, contains COVID-19 data for each county, including the total COVID numbers from one day to the next. It does not contain the difference in numbers between the days (i.e. for county X in day 1 there were 7 cases, in day 2 there were 37 cases). This data is loaded as a json file in the s3 bucket.
Find the differences between days for all counties (i.e. for county X there were 30 more cases in day 2 than in day 1). If the difference is smaller than 0 (e.g. because of a data recording error), then the difference for that day should be 0.
Base concepts
- Data Engineering
- ETL (Extract, Transform, Load)
- Pipeline
- Data Lake
- Data Warehouse
- Data Schema
- Apache Airflow (wikipedia page)
- Airflow DAG
- Airflow XCom
- Apache Spark, speciffically the PySpark api (wikipedia page)
- Amazon Web Services (AWS) (wikipedia page)
- s3 (wikipedia page)
- Redshift (Wikipedia page)
- mongoDB (wikipedia page)
Prerequisites
Set-up
Download / pull the repo to your desired location.
You will have to create an AWS s3 user specifficaly for Airflow to interact with the s3 bucket. The credentials for that user will have to be saved in the s3 file found the directory /airflow-data/creds:
[airflow-spark1]
aws_access_key_id =
aws_secret_access_key =
On rows 17 and 18 in dags/dagRun.py you have the option to choose what databases system to use, mongoDB (noSQL) or Amazon Redshift (RDBMS), just by commenting/uncommenting one or the other:
# database = 'mongoDB'
database = 'Redshift'
If you want to use mongoDB, you will have to enter the mongoDB connection string (or environment variable or file with the string) in the dags/dagRun.py file, line 22:
client = pymongo.MongoClient('mongoDB_connection_string')
If you want to use a Redshift cluster, you will have to provide your Amazon Redshift database name, host and the rest of the credentials from row 29 to 34 in dags/dagRun.py:
dbname = 'testairflow'
host = '*******************************.eu-central-1.redshift.amazonaws.com'
port = '****'
user = '*********'
password = '********************'
awsIAMrole = 'arn:aws:iam::************:role/*******
You will have to change the s3 bucket name and file key (the name of the file saved in the s3 bucket) located at lines 148 and line 150 in dags/dagRun.py:
# name of the file in the AWS s3 bucket
key = 'countyData.json'
# name of the AWS s3 bucket
bucket = 'renato-airflow-raw'
In the repo directory, execute the following command that will create the .env file containig the Airflow UID and GID needed by docker-compose:
echo -e "AIRFLOW_UID=$(id -u)\nAIRFLOW_GID=0" > .env
Installation
Start the installation with:
docker-compose up -d
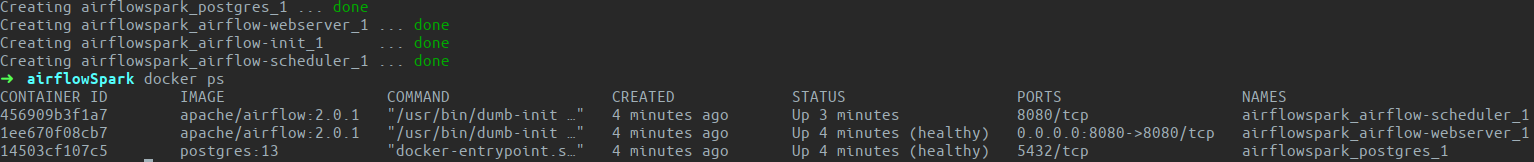
This command will pull and create Docker images and containers for Airflow, according to the instructions in the docker-compose.yml file:

After everything has been installed, you can check the status of your containers (if they are healthy) with:
docker ps
Note: it might take up to 30 seconds for the containers to have the healthy flag after starting.
Airflow Interface
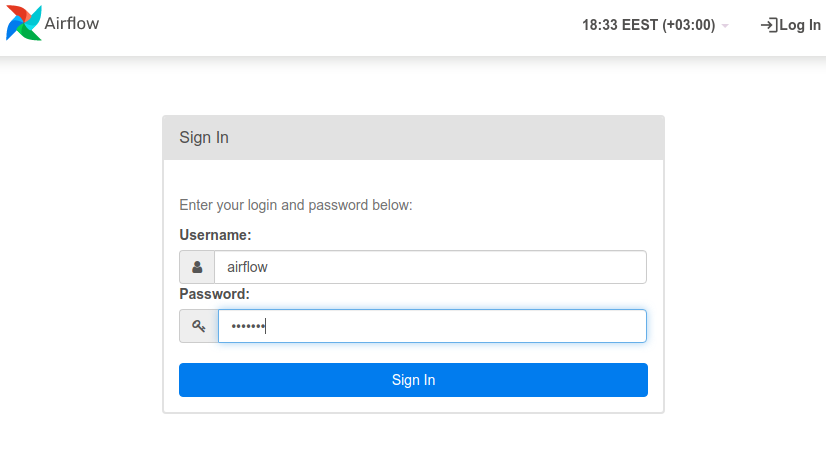
You can now access the Airflow web interface by going to http://localhost:8080/. If you have not changed them in the docker-compose.yml file, the default user is airflow and password is airflow:
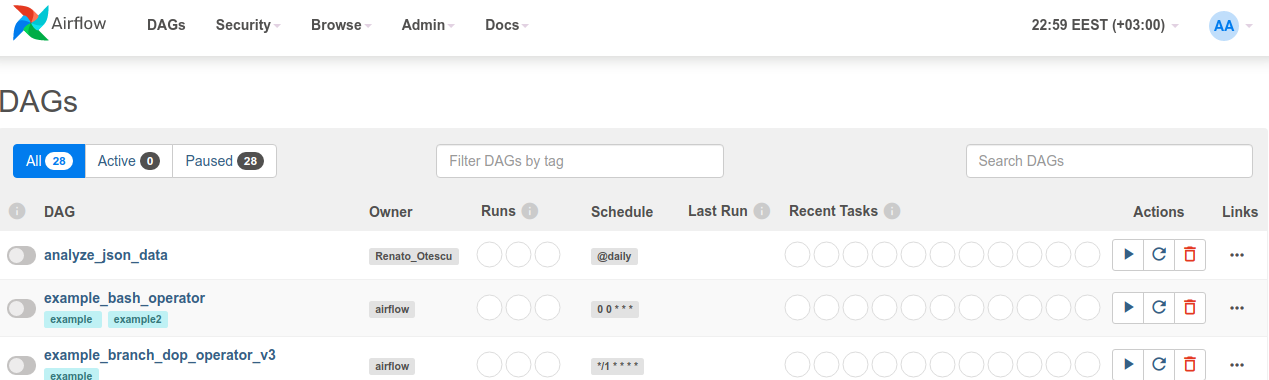
After signing in, the Airflow home page is the DAGs list page. Here you will see all your DAGs and the Airflow example DAGs, sorted alphabetically.
Any DAG python script saved in the directory dags/, will show up on the DAGs page (e.g. the first DAG, analyze_json_data, is the one built for this project).
Note: If you update the code in the python DAG script, the airflow DAGs page has to be refreshed
Note: If you do not want to see any Airflow example dags, se the AIRFLOW__CORE__LOAD_EXAMPLES: flag to False in the docker-compose.yml file before starting the installation.
Click on the name of the dag to open the DAG details page:
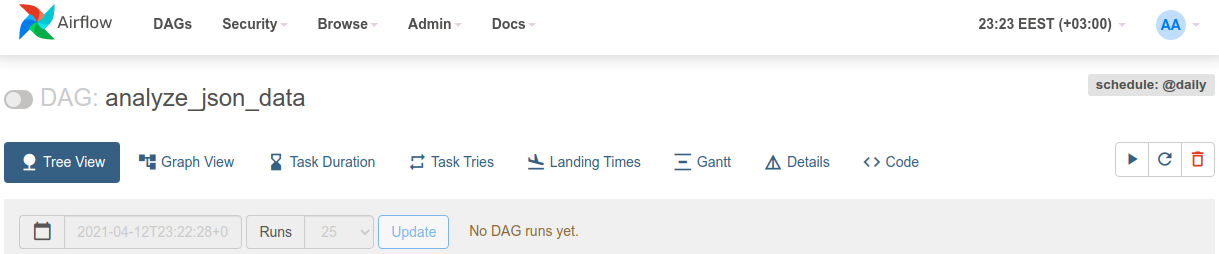
On the Graph View page you can see the dag running through each task (getLastProcessedDate, getDate, etc) after it has been unpaused and trigerred:

Pipeline Task by Task
Task getLastProcessedDate
Finds the last processed date in the mongo database and saves/pushes it in an Airflow XCom
Task getDate
Grabs the data saved in the XCom and depending of the value pulled, returns the task id parseJsonFile or the task id endRun
Task parseJsonFile
The json contains unnecessary data for this case, so it needs to be parsed to extract only the daily total numbers for each county.
If there is any new data to be processed (the date extracted in the task getLastProcessedDate is older than dates in the data) it is saved in a temp file in the directory sparkFiles:

i.e.: for the county AB, on the 7th of April, there were 1946 COVID cases, on the 8th of April there were 19150 cases
It also returns the task id endRun if there was no new data, or the task ID processParsedData
Task processParsedData
Executes the PySpark script sparkFiles/sparkProcess.py.
The parsed data is processed and the result is saved in another temporary file in the sparkFiles directory:
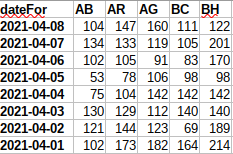
i.e.: for the county AB, on the 8th of April there were 104 more cases than on the 7th of April
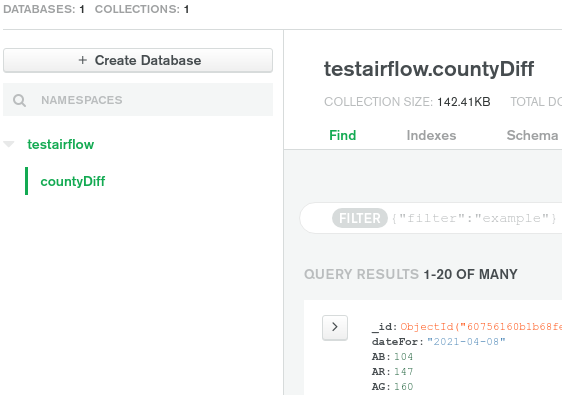
Task saveToDB
Save the processed data either in the mongoDB database:
Or in Redshift:

Note: The Redshift column names are the full name of the counties as the short version for some of them conflicts with SQL reserved words
Task endRun
Dummy task used as the end of the pipeline
Shut Down and Restart Airflow
If you want to make changes to any of the configuration files docker-compose.yml, Dockerfile, requirements.txt you will have to shut down the Airflow instance with:
docker-compose down
This command will shut down and delete any containers created/used by Airflow.
For any changes made in the configuration files to be applied, you will have to rebuild the Airflow images with the command:
docker-compose build
Recreate all the containers with:
docker-compose up -d
Learning Resources
These are some useful learning resources for anyone interested in Airflow and Spark:
- Apache Airflow Documentation
- Spark by examples
- DataScience Made Simple
- Marc Lambreti
- Medium
- Towards Data Science
- Precocity
- Databricks
License
You can check out the full license here
This project is licensed under the terms of the MIT license.

 1.3k Dec 30, 2022
 42 Dec 16, 2022
 5 Jan 03, 2023
 2 Jan 06, 2022
 302 Dec 29, 2022
 10 May 10, 2022
 2 Jan 20, 2022
 1 Nov 18, 2021
 2 Nov 18, 2022
 502 Jan 03, 2023
 4 Jan 12, 2022
 6 Nov 30, 2022
 59 Dec 25, 2022
 1 Feb 07, 2022
 5 Jun 11, 2022
 1.1k Dec 28, 2022
 1 Feb 15, 2022
 411 Dec 27, 2022
 2 Jan 31, 2022
 4 Feb 11, 2022