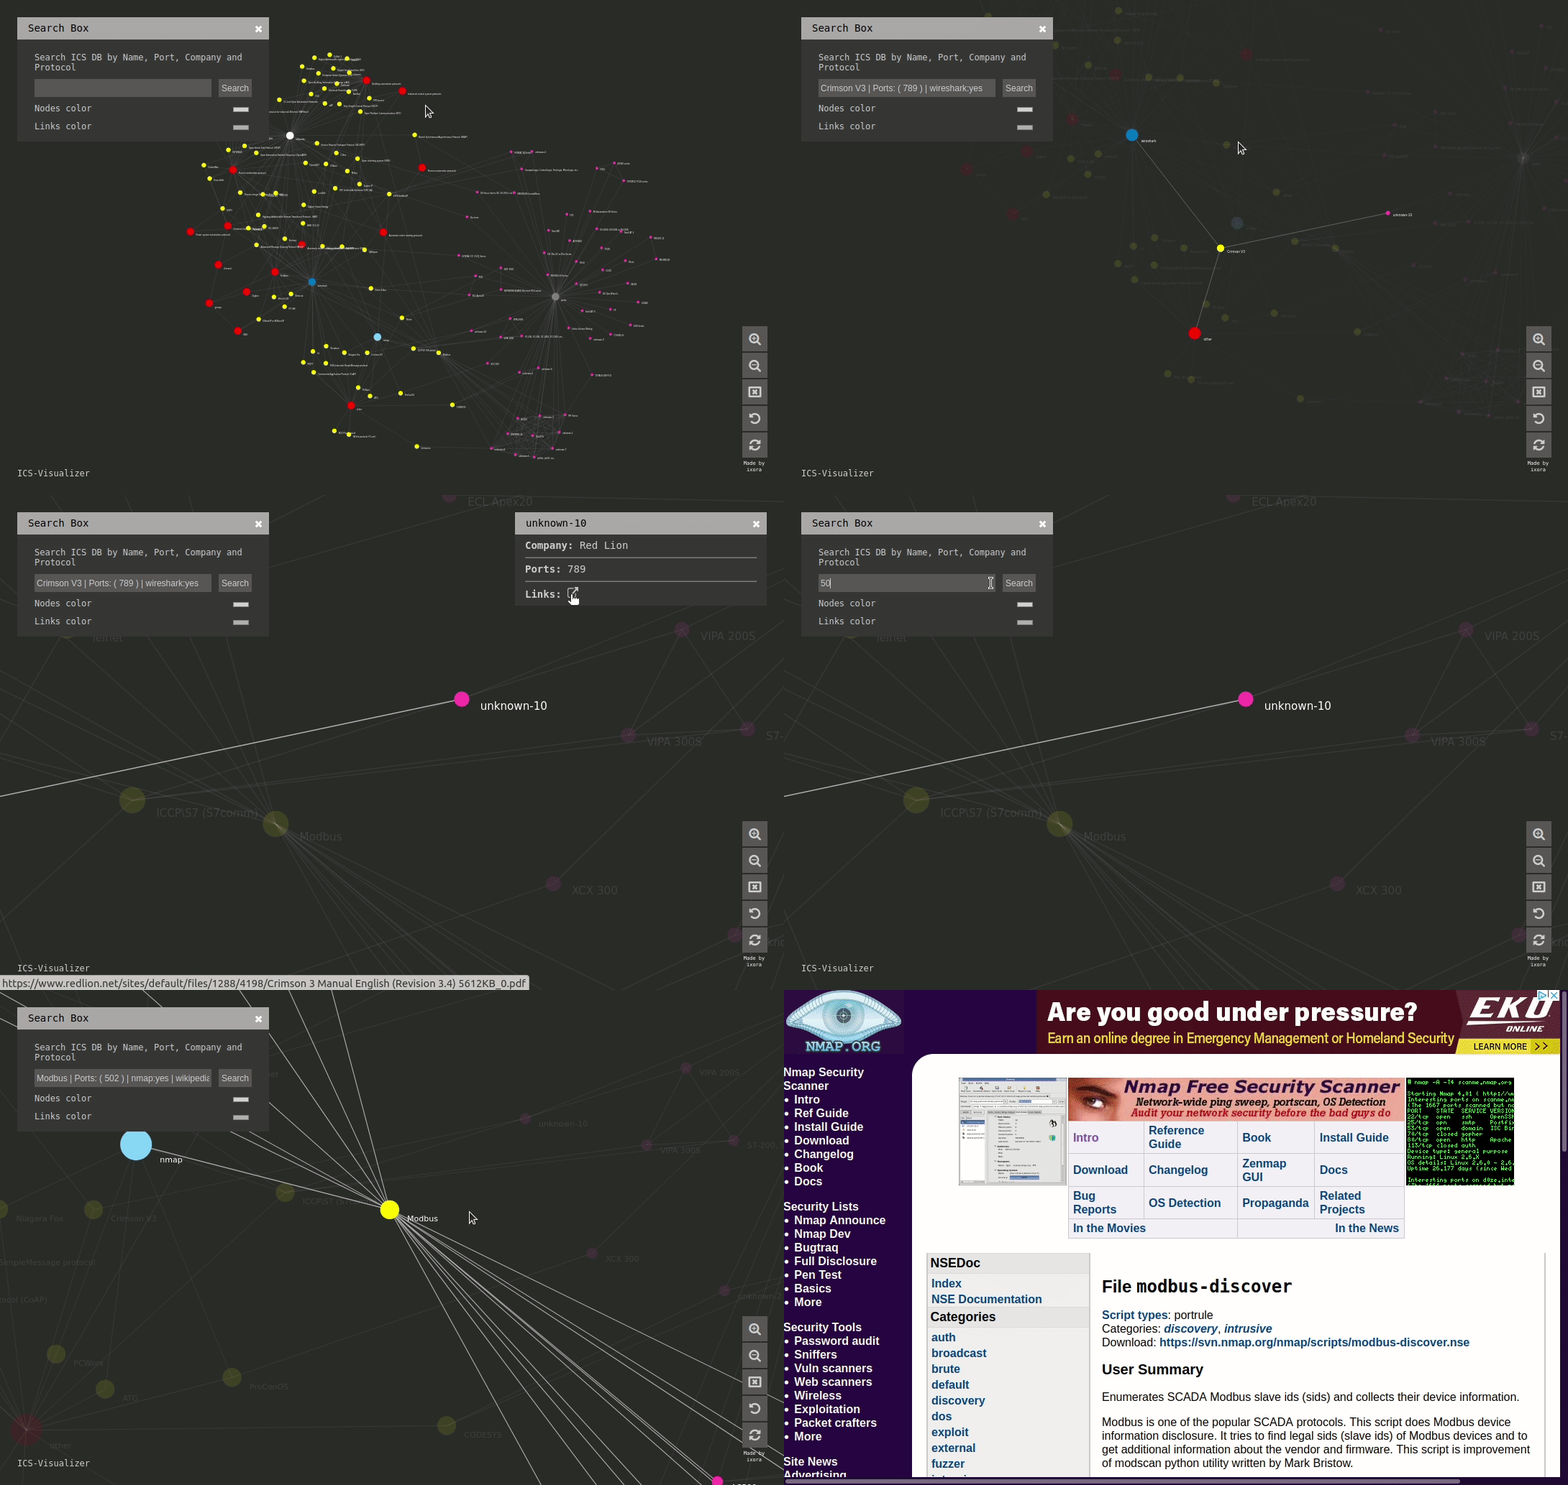
ICS-Visualizer is an interactive Industrial Control Systems (ICS) network graph that contains up-to-date ICS metadata

Overview

Generic badge Generic badge Generic badge Generic badge

ICS-Visualizer is an interactive Industrial Control Systems (ICS) network graph that contains up-to-date ICS metadata (Name, company, port, user manuals, external links, and mapped wireshark\namp modules and scripts).

Interface

Live

https://qeeqbox.github.io/ics-visualizer/

Features

  • ICS metadata (Name, company, port and info)
  • Mapped Wireshark and NMAP modules\scripts
  • External links to great ICS resources (Articles, manuals and projects)
  • Optimized canvas (Fast interaction)
  • Search function (Target item will be highlighted)
  • Zoom-in, zoom-out & reset options

Notes

  • ICS metadata db was compiled using my previous experience with ICS and a lot of great external articles\researches\projects (Do not forget to check them out!)

Resources

d3js.org wikipedia wireshark nmap and more

Other Licenses

By using this framework, you are accepting the license terms of each package listed below: D3, fontawesome, jQuery & JavaScript

Other Projects

Owner
QeeqBox
Security Projects for Red, Blue and Purple Teams
QeeqBox
Streaming pivot visualization via WebAssembly

Perspective is an interactive visualization component for large, real-time datasets. Originally developed for J.P. Morgan's trading business, Perspect

The Fintech Open Source Foundation (www.finos.org) 5.1k Dec 27, 2022
Gesture controlled media player

Media Player Gesture Control Gesture controller for media player with MediaPipe, VLC and OpenCV. Contents About Setup About A tool for using gestures

Atharva Joshi 2 Dec 22, 2021
Schema validation for Xarray objects

xarray-schema Schema validation for Xarray installation This package is in the early stages of development. Install it from source: pip install git+gi

carbonplan 22 Oct 31, 2022
Info for The Great DataTas plot-a-thon

The Great DataTas plot-a-thon Datatas is organising a Data Visualisation competition: The Great DataTas plot-a-thon We will be using Tidy Tuesday data

2 Nov 21, 2021
kyle's vision of how datadog's python client should look

kyle's datadog python vision/proposal not for production use See examples/comprehensive.py for a mostly working example of the proposed API. 📈 🐶 ❤️

Kyle Verhoog 2 Nov 21, 2021
Shaded 😎 quantile plots

shadyquant 😎 This python package allows you to quantile and plot lines where you have multiple samples, typically for visualizing uncertainty. Your d

Mehrad Ansari 13 Sep 29, 2022
A Simple Flask-Plotly Example for NTU 110-1 DSSI Class

A Simple Flask-Plotly Example for NTU 110-1 DSSI Class Live Demo Prerequisites We will use Flask and Ploty to build a Flask application. If you haven'

Ting Ni Wu 1 Dec 11, 2021
Jupyter notebook and datasets from the pandas Q&A video series

Python pandas Q&A video series Read about the series, and view all of the videos on one page: Easier data analysis in Python with pandas. Jupyter Note

Kevin Markham 2k Jan 05, 2023
Dipto Chakrabarty 7 Sep 06, 2022
Visualizations of some specific solutions of different differential equations.

Diff_sims Visualizations of some specific solutions of different differential equations. Heat Equation in 1 Dimension (A very beautiful and elegant ex

2 Jan 13, 2022
finds grocery stores and stuff next to route (gpx)

Route-Report Route report is a command-line utility that can be used to locate points-of-interest near your planned route (gpx). The results are based

Clemens Mosig 5 Oct 10, 2022
With Holoviews, your data visualizes itself.

HoloViews Stop plotting your data - annotate your data and let it visualize itself. HoloViews is an open-source Python library designed to make data a

HoloViz 2.3k Jan 04, 2023
flask extension for integration with the awesome pydantic package

Flask-Pydantic Flask extension for integration of the awesome pydantic package with Flask. Installation python3 -m pip install Flask-Pydantic Basics v

249 Jan 06, 2023
Sprint planner considering JIRA issues and google calendar meetings schedule.

Sprint planner Sprint planner is a Python script for planning your Jira tasks based on your calendar availability. Installation Use the package manage

Apptension 2 Dec 05, 2021
CLAHE Contrast Limited Adaptive Histogram Equalization

A simple code to process images using contrast limited adaptive histogram equalization. Image processing is becoming a major part of data processig.

Happy N. Monday 4 May 18, 2022
100 data puzzles for pandas, ranging from short and simple to super tricky (60% complete)

100 pandas puzzles Puzzles notebook Solutions notebook Inspired by 100 Numpy exerises, here are 100* short puzzles for testing your knowledge of panda

Alex Riley 1.9k Jan 08, 2023
A small timeseries transformation API built on Flask and Pandas

#Mcflyin ###A timeseries transformation API built on Pandas and Flask This is a small demo of an API to do timeseries transformations built on Flask a

Rob Story 84 Mar 25, 2022
A blender import/export system for Defold

defold-blender-export A Blender export system for the Defold game engine. Setup Notes There are no exhaustive documents for this tool yet. Its just no

David Lannan 27 Dec 30, 2022
Backend app for visualizing CANedge log files in Grafana (directly from local disk or S3)

CANedge Grafana Backend - Visualize CAN/LIN Data in Dashboards This project enables easy dashboard visualization of log files from the CANedge CAN/LIN

13 Dec 15, 2022
JSNAPY example: Validate NAT policies

JSNAPY example: Validate NAT policies Overview This example will show how to use JSNAPy to make sure the expected NAT policy matches are taking place.

Calvin Remsburg 1 Jan 07, 2022