Pizza Orders Data Pipeline Usecase Solved by SQL, Sqoop, HDFS, Hive, Airflow.

Overview

PizzaOrders_DataPipeline

There is a Tony who is owning a New Pizza shop.
He knew that pizza alone was not going to help him get seed funding to expand his new Pizza Empire
so he had one more genius idea to combine with it - he was going to Uberize it - and so Pizza Runner was launched!

Tony started by recruiting “runners” to deliver fresh pizza from Pizza Runner Headquarters (otherwise known as Tony’s house) and also maxed out his credit card to pay freelance developers to build a mobile app to accept orders from customers.

Now he wants to know how is his business going on he needs some answers to his questions from the data. but the data which is stored is not in an appropriate format. He Approaches a Data Engineer to process and store the data for him and get the answers to his question

The data are stored in the different CSV files

  • customer_orders.csv
    Columns=>order_id,customer_id,pizza_id,exclusions,extras,order_time
  • pizza_names.csv
    Columns=> pizza_id,pizza_name
  • pizza_recipes.csv
    Columns=>pizza_id,toppings
  • pizza_toppings.csv
    Columns=>topping_id,topping_name
  • runner_orders.csv
    Columns=>order_id,runner_id,pickup_time,distance,duration,cancellation
  • runners.csv
    Columns=> runner_id,registration_date

The Answers the Tony wanted for

  1. How many pizzas were ordered?
  2. How many unique customer orders were made?
  3. How many successful orders were delivered by each runner?
  4. How many of each type of pizza was delivered?
  5. How many Vegetarian and Meatlovers were ordered by each customer?
  6. What was the maximum number of pizzas delivered in a single order?
  7. For each customer, how many delivered pizzas had at least 1 change and how many had no changes?
  8. How many pizzas were delivered that had both exclusions and extras?
  9. What was the total volume of pizzas ordered for each hour of the day?
  10. Wh/at was the volume of orders for each day of the week?

Requirements

  1. Store the data In MY SQL table
  2. Using Sqoop Store the Data in Hive
  3. Using the PySpark the get the Results for the question
  4. Store the Results in Seperate Table
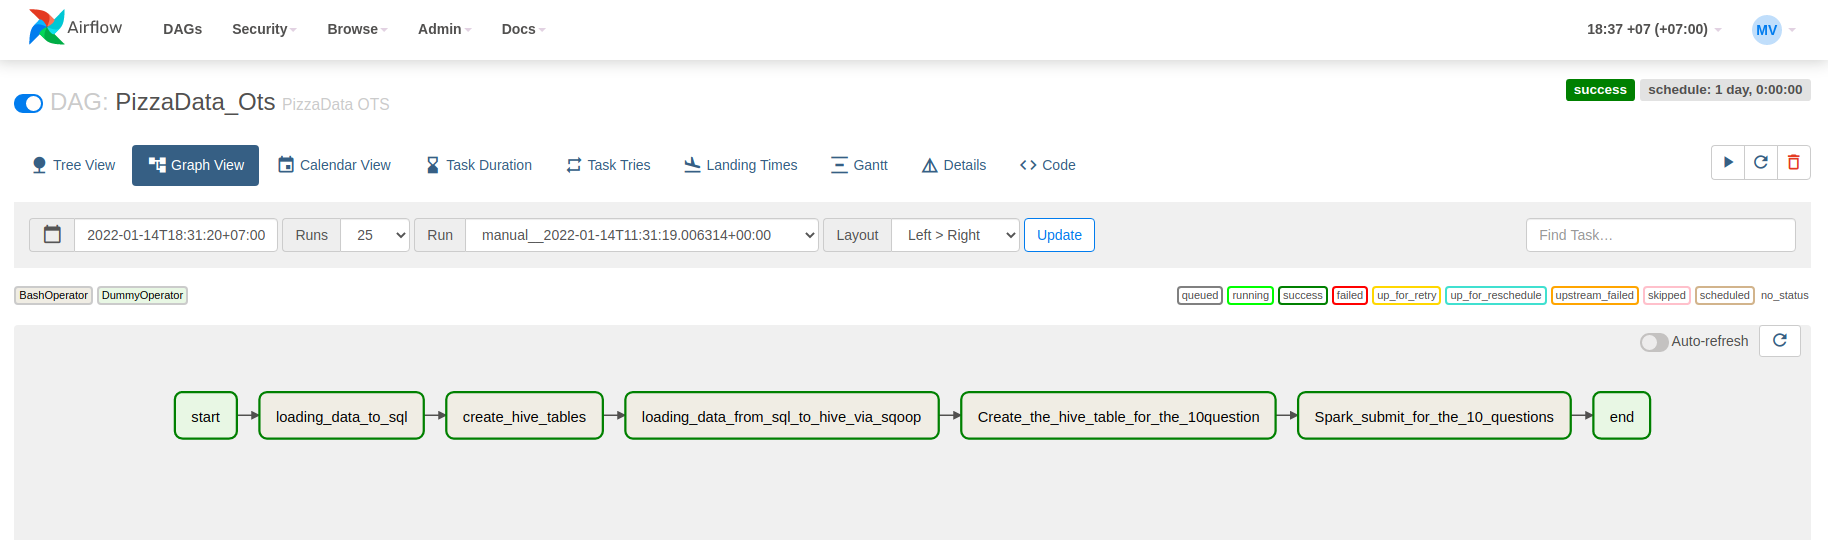
  5. Automate entire process in the Airflow

AirFlow Output

Owner
Melwin Varghese P
Melwin Varghese P
A library to create multi-page Streamlit applications with ease.

A library to create multi-page Streamlit applications with ease.

Jackson Storm 107 Jan 04, 2023
Synthetic Data Generation for tabular, relational and time series data.

An Open Source Project from the Data to AI Lab, at MIT Website: https://sdv.dev Documentation: https://sdv.dev/SDV User Guides Developer Guides Github

The Synthetic Data Vault Project 1.2k Jan 07, 2023
This is a tool for speculation of ancestral allel, calculation of sfs and drawing its bar plot.

superSFS This is a tool for speculation of ancestral allel, calculation of sfs and drawing its bar plot. It is easy-to-use and runing fast. What you s

3 Dec 16, 2022
Describing statistical models in Python using symbolic formulas

Patsy is a Python library for describing statistical models (especially linear models, or models that have a linear component) and building design mat

Python for Data 866 Dec 16, 2022
Tokyo 2020 Paralympics, Analytics

Tokyo 2020 Paralympics, Analytics Thanks for checking out my app! It was built entirely using matplotlib and Tokyo 2020 Paralympics data. This applica

Petro Ivaniuk 1 Nov 18, 2021
Unsub is a collection analysis tool that assists libraries in analyzing their journal subscriptions.

About Unsub is a collection analysis tool that assists libraries in analyzing their journal subscriptions. The tool provides rich data and a summary g

9 Nov 16, 2022
CubingB is a timer/analyzer for speedsolving Rubik's cubes, with smart cube support

CubingB is a timer/analyzer for speedsolving Rubik's cubes (and related puzzles). It focuses on supporting "smart cubes" (i.e. bluetooth cubes) for recording the exact moves of a solve in real time.

Zach Wegner 5 Sep 18, 2022
Evaluation of a Monocular Eye Tracking Set-Up

Evaluation of a Monocular Eye Tracking Set-Up As part of my master thesis, I implemented a new state-of-the-art model that is based on the work of Che

Pascal 19 Dec 17, 2022
ETL pipeline on movie data using Python and postgreSQL

Movies-ETL ETL pipeline on movie data using Python and postgreSQL Overview This project consisted on a automated Extraction, Transformation and Load p

Juan Nicolas Serrano 0 Jul 07, 2021
Programmatically access the physical and chemical properties of elements in modern periodic table.

API to fetch elements of the periodic table in JSON format. Uses Pandas for dumping .csv data to .json and Flask for API Integration. Deployed on "pyt

the techno hack 3 Oct 23, 2022
Port of dplyr and other related R packages in python, using pipda.

Unlike other similar packages in python that just mimic the piping syntax, datar follows the API designs from the original packages as much as possible, and is tested thoroughly with the cases from t

179 Dec 21, 2022
The official pytorch implementation of ViTAE: Vision Transformer Advanced by Exploring Intrinsic Inductive Bias

ViTAE: Vision Transformer Advanced by Exploring Intrinsic Inductive Bias Introduction | Updates | Usage | Results&Pretrained Models | Statement | Intr

104 Nov 27, 2022
COVID-19 deaths statistics around the world

COVID-19-Deaths-Dataset COVID-19 deaths statistics around the world This is a daily updated dataset of COVID-19 deaths around the world. The dataset c

Nisa Efendioğlu 4 Jul 10, 2022
.npy, .npz, .mtx converter.

npy-converter Matrix Data Converter. Expand matrix for multi-thread, multi-process Divid matrix for multi-thread, multi-process Support: .mtx, .npy, .

taka 1 Feb 07, 2022
An ETL framework + Monitoring UI/API (experimental project for learning purposes)

Fastlane An ETL framework for building pipelines, and Flask based web API/UI for monitoring pipelines. Project structure fastlane |- fastlane: (ETL fr

Dan Katz 2 Jan 06, 2022
BioMASS - A Python Framework for Modeling and Analysis of Signaling Systems

Mathematical modeling is a powerful method for the analysis of complex biological systems. Although there are many researches devoted on produ

BioMASS 22 Dec 27, 2022
Using Data Science with Machine Learning techniques (ETL pipeline and ML pipeline) to classify received messages after disasters.

Using Data Science with Machine Learning techniques (ETL pipeline and ML pipeline) to classify received messages after disasters.

1 Feb 11, 2022
yt is an open-source, permissively-licensed Python library for analyzing and visualizing volumetric data.

The yt Project yt is an open-source, permissively-licensed Python library for analyzing and visualizing volumetric data. yt supports structured, varia

The yt project 367 Dec 25, 2022
Display the behaviour of a realtime program with a scope or logic analyser.

1. A monitor for realtime MicroPython code This library provides a means of examining the behaviour of a running system. It was initially designed to

Peter Hinch 17 Dec 05, 2022
Python implementation of Principal Component Analysis

Principal Component Analysis Principal Component Analysis (PCA) is a dimension-reduction algorithm. The idea is to use the singular value decompositio

Ignacio Darago 1 Nov 06, 2021