VHub - An API that permits uploading of vulnerability datasets and return of the serialized data

Related tags

Data Analysisvhub
Overview

VHub

VHub is an API that permits uploading of vulnerability datasets based on the following pattern of columns:

ASSET - HOSTNAME ASSET - IP_ADDRESS VULNERABILITY - TITLE VULNERABILITY - SEVERITY VULNERABILITY - CVSS VULNERABILITY - PUBLICATION_DATE

The data are provided by endpoints to handle it and possibly to generate tables and chats to get insights about the vulnerability data.


Pre-requisites


Installation

To install the package, clone the repository on github and run the following command:

poetry install

Next, enter the virtualenv to be able getting access to django, with:

poetry shell

Setting up environment variables

Before continue, you need to generate the SECRET_KEY. To do this, rename the file .env.example to .env, generate the token and put it as value to SECRET_KEY.

Setting up the database

To setup the databse run:

python manage.py migrate

Running the API

Finally, run the Vhub API with:

python manage.py runserver

Now, access http://127.0.0.1:8000/api/swagger/ to see the Swagger documentation.

You might also like...
Udacity-api-reporting-pipeline - Udacity api reporting pipeline

udacity-api-reporting-pipeline In this exercise, you'll use portions of each of

 🧪 Panel-Chemistry - exploratory data analysis and build powerful data and viz tools within the domain of Chemistry using Python and HoloViz Panel.
🧪 Panel-Chemistry - exploratory data analysis and build powerful data and viz tools within the domain of Chemistry using Python and HoloViz Panel.

🧪📈 🐍. The purpose of the panel-chemistry project is to make it really easy for you to do DATA ANALYSIS and build powerful DATA AND VIZ APPLICATIONS within the domain of Chemistry using using Python and HoloViz Panel.

Reading streams of Twitter data, save them to Kafka, then process with Kafka Stream API and Spark Streaming

Using Streaming Twitter Data with Kafka and Spark Reading streams of Twitter data, publishing them to Kafka topic, process message using Kafka Stream

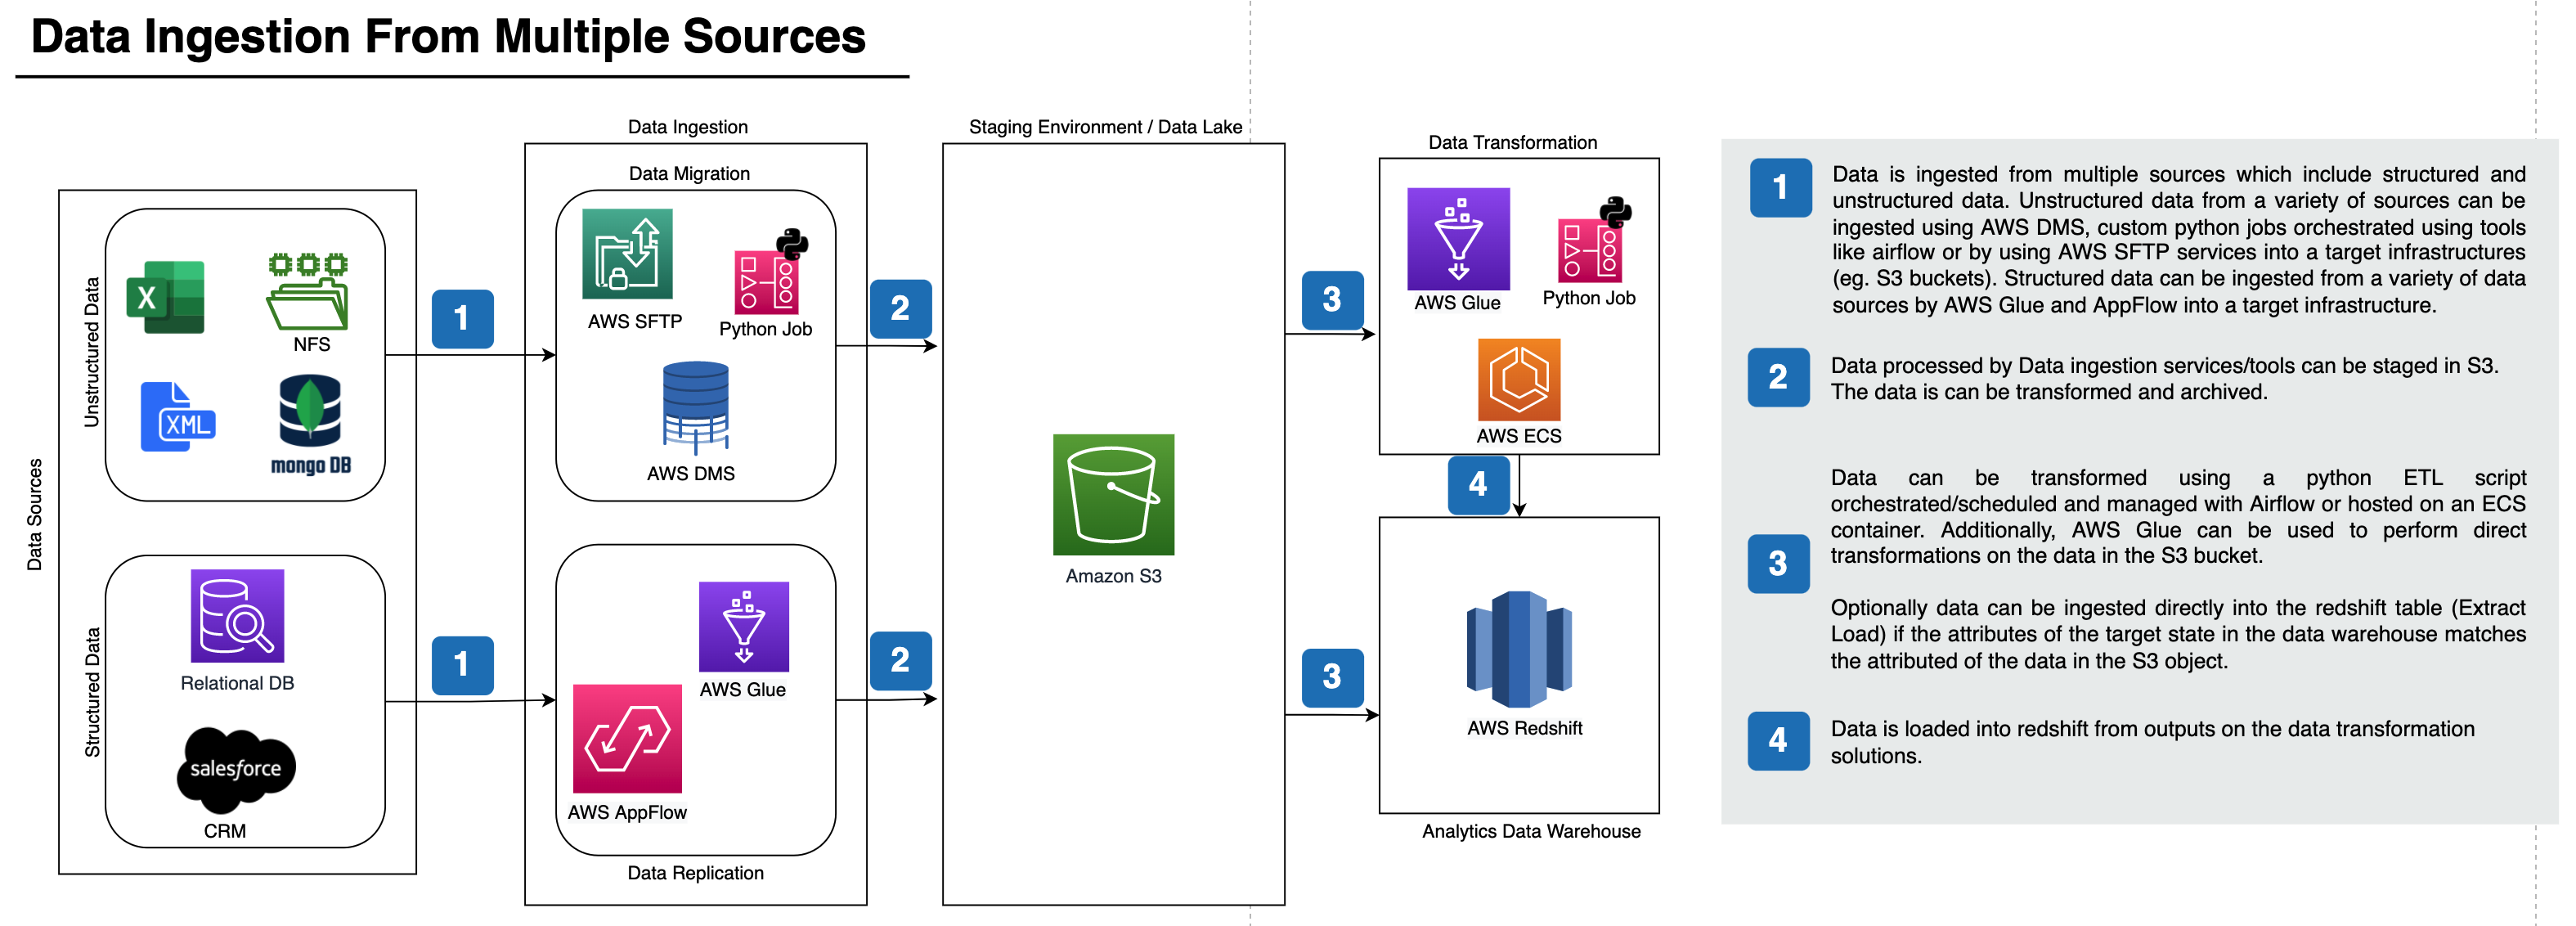
PrimaryBid - Transform application Lifecycle Data and Design and ETL pipeline architecture for ingesting data from multiple sources to redshift

Transform application Lifecycle Data and Design and ETL pipeline architecture for ingesting data from multiple sources to redshift This project is composed of two parts: Part1 and Part2

Minimal working example of data acquisition with nidaqmx python API

Data Aquisition using NI-DAQmx python API Based on this project It is a minimal working example for data acquisition using the NI-DAQmx python API. It

API>local_db>AWS_RDS - Disclaimer! All data used is for educational purposes only.
APIlocal_dbAWS_RDS - Disclaimer! All data used is for educational purposes only.

APIlocal_dbAWS_RDS Disclaimer! All data used is for educational purposes only. ETL pipeline diagram. Aim of project By creating a fully working pipe

Demonstrate a Dataflow pipeline that saves data from an API into BigQuery table

Overview dataflow-mvp provides a basic example pipeline that pulls data from an API and writes it to a BigQuery table using GCP's Dataflow (i.e., Apac

fds is a tool for Data Scientists made by DAGsHub to version control data and code at once.

Fast Data Science, AKA fds, is a CLI for Data Scientists to version control data and code at once, by conveniently wrapping git and dvc

Python data processing, analysis, visualization, and data operations

Python This is a Python data processing, analysis, visualization and data operations of the source code warehouse, book ISBN: 9787115527592 Descriptio

Releases(v0.1.1)
Owner
André Rodrigues
Python Developer. Computer Engineering.
André Rodrigues
Tools for the analysis, simulation, and presentation of Lorentz TEM data.

ltempy ltempy is a set of tools for Lorentz TEM data analysis, simulation, and presentation. Features Single Image Transport of Intensity Equation (SI

McMorran Lab 1 Dec 26, 2022
BigDL - Evaluate the performance of BigDL (Distributed Deep Learning on Apache Spark) in big data analysis problems

Evaluate the performance of BigDL (Distributed Deep Learning on Apache Spark) in big data analysis problems.

Vo Cong Thanh 1 Jan 06, 2022
Exploratory Data Analysis of the 2019 Indian General Elections using a dataset from Kaggle.

2019-indian-election-eda Exploratory Data Analysis of the 2019 Indian General Elections using a dataset from Kaggle. This project is a part of the Cou

Souradeep Banerjee 5 Oct 10, 2022
pandas: powerful Python data analysis toolkit

pandas is a Python package that provides fast, flexible, and expressive data structures designed to make working with "relational" or "labeled" data both easy and intuitive.

pandas 36.4k Jan 03, 2023
Predictive Modeling & Analytics on Home Equity Line of Credit

Predictive Modeling & Analytics on Home Equity Line of Credit Data (Python) HMEQ Data Set In this assignment we will use Python to examine a data set

Dhaval Patel 1 Jan 09, 2022
CSV database for chihuahua (HUAHUA) blockchain transactions

super-fiesta Shamelessly ripped components from https://github.com/hodgerpodger/staketaxcsv - Thanks for doing all the hard work. This code does only

Arlene Macciaveli 1 Jan 07, 2022
PyTorch implementation for NCL (Neighborhood-enrighed Contrastive Learning)

NCL (Neighborhood-enrighed Contrastive Learning) This is the official PyTorch implementation for the paper: Zihan Lin*, Changxin Tian*, Yupeng Hou* Wa

RUCAIBox 73 Jan 03, 2023
Project: Netflix Data Analysis and Visualization with Python

Project: Netflix Data Analysis and Visualization with Python Table of Contents General Info Installation Demo Usage and Main Functionalities Contribut

Kathrin Hälbich 2 Feb 13, 2022
pyETT: Python library for Eleven VR Table Tennis data

pyETT: Python library for Eleven VR Table Tennis data Documentation Documentation for pyETT is located at https://pyett.readthedocs.io/. Installation

Tharsis Souza 5 Nov 19, 2022
X-news - Pipeline data use scrapy, kafka, spark streaming, spark ML and elasticsearch, Kibana

X-news - Pipeline data use scrapy, kafka, spark streaming, spark ML and elasticsearch, Kibana

Nguyễn Quang Huy 5 Sep 28, 2022
Data Scientist in Simple Stock Analysis of PT Bukalapak.com Tbk for Long Term Investment

Data Scientist in Simple Stock Analysis of PT Bukalapak.com Tbk for Long Term Investment Brief explanation of PT Bukalapak.com Tbk Bukalapak was found

Najibulloh Asror 2 Feb 10, 2022
Minimal working example of data acquisition with nidaqmx python API

Data Aquisition using NI-DAQmx python API Based on this project It is a minimal working example for data acquisition using the NI-DAQmx python API. It

Pablo 1 Nov 05, 2021
Retentioneering 581 Jan 07, 2023
An ETL framework + Monitoring UI/API (experimental project for learning purposes)

Fastlane An ETL framework for building pipelines, and Flask based web API/UI for monitoring pipelines. Project structure fastlane |- fastlane: (ETL fr

Dan Katz 2 Jan 06, 2022
The repo for mlbtradetrees.com. Analyze any trade in baseball history!

The repo for mlbtradetrees.com. Analyze any trade in baseball history!

7 Nov 20, 2022
A lightweight interface for reading in output from the Weather Research and Forecasting (WRF) model into xarray Dataset

xwrf A lightweight interface for reading in output from the Weather Research and Forecasting (WRF) model into xarray Dataset. The primary objective of

National Center for Atmospheric Research 43 Nov 29, 2022
Sentiment analysis on streaming twitter data using Spark Structured Streaming & Python

Sentiment analysis on streaming twitter data using Spark Structured Streaming & Python This project is a good starting point for those who have little

Himanshu Kumar singh 2 Dec 04, 2021
A project consists in a set of assignements corresponding to a BI process: data integration, construction of an OLAP cube, qurying of a OPLAP cube and reporting.

TennisBusinessIntelligenceProject - A project consists in a set of assignements corresponding to a BI process: data integration, construction of an OLAP cube, qurying of a OPLAP cube and reporting.

carlo paladino 1 Jan 02, 2022
Zipline, a Pythonic Algorithmic Trading Library

Zipline is a Pythonic algorithmic trading library. It is an event-driven system for backtesting. Zipline is currently used in production as the backte

Quantopian, Inc. 15.7k Jan 07, 2023
Create HTML profiling reports from pandas DataFrame objects

Pandas Profiling Documentation | Slack | Stack Overflow Generates profile reports from a pandas DataFrame. The pandas df.describe() function is great

10k Jan 01, 2023