PrimaryBid - Transform application Lifecycle Data and Design and ETL pipeline architecture for ingesting data from multiple sources to redshift

Overview

PrimaryBid

Transform application Lifecycle Data and Design and ETL pipeline architecture for ingesting data from multiple sources to redshift This project is composed of two parts: Part1 and Part2

Part1

This part involves ingesting an application lifecycle raw data in .csv formats (“CC Application Lifecycle.csv”). The data is transformed to return various Application stages as column names, and the time of stage completion, as values against each customer ID via python.

Files included in this section include:

  • Solution Directory:
    • application_etl.py (Contains transformation class for application lifecycle raw data)
    • run_application_etl.py (Ingest and executes transformations for application lifecycle raw data)
  • Test Directory:
    • test_application_etl.py (runs a series of test for objects in the transformation class)
    • Input Directory (Contains all the input test files)
    • Output Directory (Contains all the output test files)

Execution:

  1. Execute run_application_etl.py to obtain output file for transformed application lifecycle data.

Modifications:

  1. Extra transformation, bug fixes and other modification can be added in application_etl.py as an object.
  2. For new transformations (new functions), add a test for the function in test_application_etl.py and execute it with pytest -vv.
  3. Call the object in run_application_etl.py after test passes to return desired output.

Part2

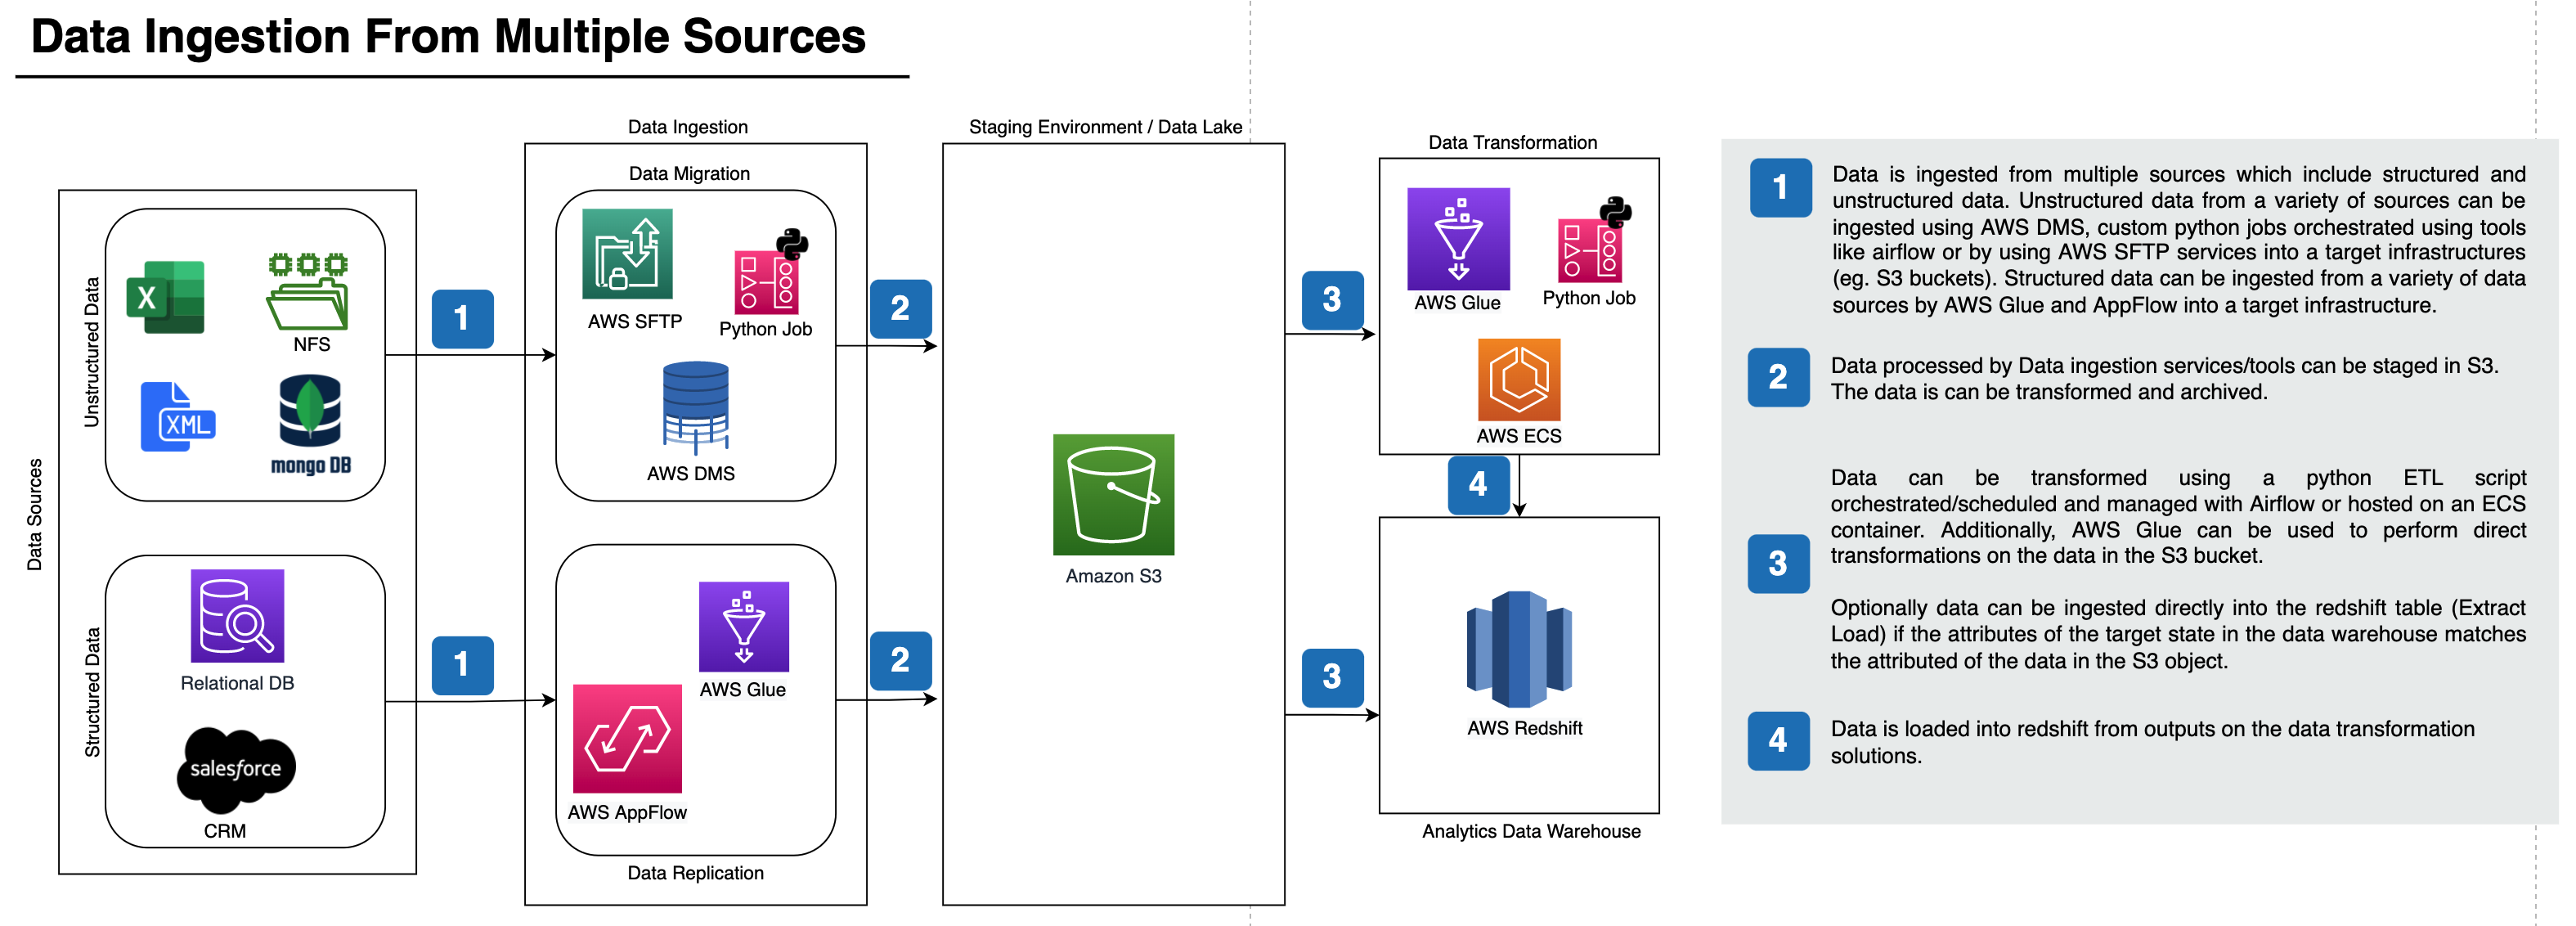
This part presents an architectural design to ingest data from a MongoDB database - into a Redshift data platform. The solution accomodates the addition of more data sources in the near future. The DDL scripts which form part of the solution is resusable for ingesting and loading data into redshift.

Files included in this section establishes the creation of target tables for the data ingestion process:

  • dwh.cfg (Infrastucture parameters and configuration)
  • DDL_queries.py (DDL queries to drop, creat, copy/insert data into Redshift)
  • table_setup_load.py (Class to manage the establish connection to database setup and teardown of tables in Redshift)
  • execute_ddl_process.py (script to execute processes in table_setup_load class)
  • test_execute_ddl_process.py (script to test the setup and teardown of resources.)
  • requirement.txt (key libraries needed to execute .py scripts)
  • makefile (file to automate process of installing and testing libraries and .py scripts respectively.)

Execution:

  1. Execute execute_ddl_process.py to create and load data into target tables from S3.

Modifications:

  1. Bucket file sources and other config paramters can be added in dwh.cfg
  2. New DDl queries which includes ingesting data from multiple tables from aggregations/joins can be added in DDL_queries.py.
  3. For other functions not captured in this section work, custom functions can be added in table_setup_load.py
  4. Before executing scripts for production environments, test the modifications by executing test_execute_ddl_process.py

The architecture below highlights the processes involved in ingesting data from various data sources into redshift

  • Architeture

Data Architecture

Owner
Emmanuel Boateng Sifah
Computer scientist, Doctoral researcher, Solutions engineer, Data scientist, Data analyst and Data engineer
Emmanuel Boateng Sifah
Flexible HDF5 saving/loading and other data science tools from the University of Chicago

deepdish Flexible HDF5 saving/loading and other data science tools from the University of Chicago. This repository also host a Deep Learning blog: htt

UChicago - Department of Computer Science 255 Dec 10, 2022
Python beta calculator that retrieves stock and market data and provides linear regressions.

Stock and Index Beta Calculator Python script that calculates the beta (β) of a stock against the chosen index. The script retrieves the data and resa

sammuhrai 4 Jul 29, 2022
🧪 Panel-Chemistry - exploratory data analysis and build powerful data and viz tools within the domain of Chemistry using Python and HoloViz Panel.

🧪📈 🐍. The purpose of the panel-chemistry project is to make it really easy for you to do DATA ANALYSIS and build powerful DATA AND VIZ APPLICATIONS within the domain of Chemistry using using Python a

Marc Skov Madsen 97 Dec 08, 2022
Project under the certification "Data Analysis with Python" on FreeCodeCamp

Sea Level Predictor Assignment You will anaylize a dataset of the global average sea level change since 1880. You will use the data to predict the sea

Bhavya Gopal 3 Jan 31, 2022
CleanX is an open source python library for exploring, cleaning and augmenting large datasets of X-rays, or certain other types of radiological images.

cleanX CleanX is an open source python library for exploring, cleaning and augmenting large datasets of X-rays, or certain other types of radiological

Candace Makeda Moore, MD 20 Jan 05, 2023
The official repository for ROOT: analyzing, storing and visualizing big data, scientifically

About The ROOT system provides a set of OO frameworks with all the functionality needed to handle and analyze large amounts of data in a very efficien

ROOT 2k Dec 29, 2022
Reading streams of Twitter data, save them to Kafka, then process with Kafka Stream API and Spark Streaming

Using Streaming Twitter Data with Kafka and Spark Reading streams of Twitter data, publishing them to Kafka topic, process message using Kafka Stream

Rustam Zokirov 1 Dec 06, 2021
This program analyzes a DNA sequence and outputs snippets of DNA that are likely to be protein-coding genes.

This program analyzes a DNA sequence and outputs snippets of DNA that are likely to be protein-coding genes.

1 Dec 28, 2021
small package with utility functions for analyzing (fly) calcium imaging data

fly2p Tools for analyzing two-photon (2p) imaging data collected with Vidrio Scanimage software and micromanger. Loading scanimage data relies on scan

Hannah Haberkern 3 Dec 14, 2022
A tool to compare differences between dataframes and create a differences report in Excel

similarpanda A module to check for differences between pandas Dataframes, and generate a report in Excel format. This is helpful in a workplace settin

Andre Pretorius 9 Sep 15, 2022
Recommendations from Cramer: On the show Mad-Money (CNBC) Jim Cramer picks stocks which he recommends to buy. We will use this data to build a portfolio

Backtesting the "Cramer Effect" & Recommendations from Cramer Recommendations from Cramer: On the show Mad-Money (CNBC) Jim Cramer picks stocks which

Gábor Vecsei 12 Aug 30, 2022
Performance analysis of predictive (alpha) stock factors

Alphalens Alphalens is a Python Library for performance analysis of predictive (alpha) stock factors. Alphalens works great with the Zipline open sour

Quantopian, Inc. 2.5k Jan 09, 2023
A Python adaption of Augur to prioritize cell types in perturbation analysis.

A Python adaption of Augur to prioritize cell types in perturbation analysis.

Theis Lab 2 Mar 29, 2022
Hydrogen (or other pure gas phase species) depressurization calculations

HydDown Hydrogen (or other pure gas phase species) depressurization calculations This code is published under an MIT license. Install as simple as: pi

Anders Andreasen 13 Nov 26, 2022
Flenser is a simple, minimal, automated exploratory data analysis tool.

Flenser Have you ever been handed a dataset you've never seen before? Flenser is a simple, minimal, automated exploratory data analysis tool. It runs

John McCambridge 79 Sep 20, 2022
Learn machine learning the fun way, with Oracle and RedBull Racing

Red Bull Racing Analytics Hands-On Labs Introduction Are you interested in learning machine learning (ML)? How about doing this in the context of the

Oracle DevRel 55 Oct 24, 2022
PyEmits, a python package for easy manipulation in time-series data.

PyEmits, a python package for easy manipulation in time-series data. Time-series data is very common in real life. Engineering FSI industry (Financial

Thompson 5 Sep 23, 2022
CSV database for chihuahua (HUAHUA) blockchain transactions

super-fiesta Shamelessly ripped components from https://github.com/hodgerpodger/staketaxcsv - Thanks for doing all the hard work. This code does only

Arlene Macciaveli 1 Jan 07, 2022
AptaMat is a simple script which aims to measure differences between DNA or RNA secondary structures.

AptaMAT Purpose AptaMat is a simple script which aims to measure differences between DNA or RNA secondary structures. The method is based on the compa

GEC UTC 3 Nov 03, 2022
An easy-to-use feature store

A feature store is a data storage system for data science and machine-learning. It can store raw data and also transformed features, which can be fed straight into an ML model or training script.

ByteHub AI 48 Dec 09, 2022