gpdvega is a bridge between GeoPandas and Altair that allows to seamlessly chart geospatial data

Overview

gpdvega Coverage Status Build Status HitCount GitHub license GitHub issues

gpdvega is a bridge between GeoPandas a geospatial extension of Pandas and the declarative statistical visualization library Altair, which allows to seamlessly chart geospatial data using altair.

Example

import altair as alt
import geopandas as gpd
import gpdvega

alt.renderers.enable('notebook') # render for Jupyter Notebook

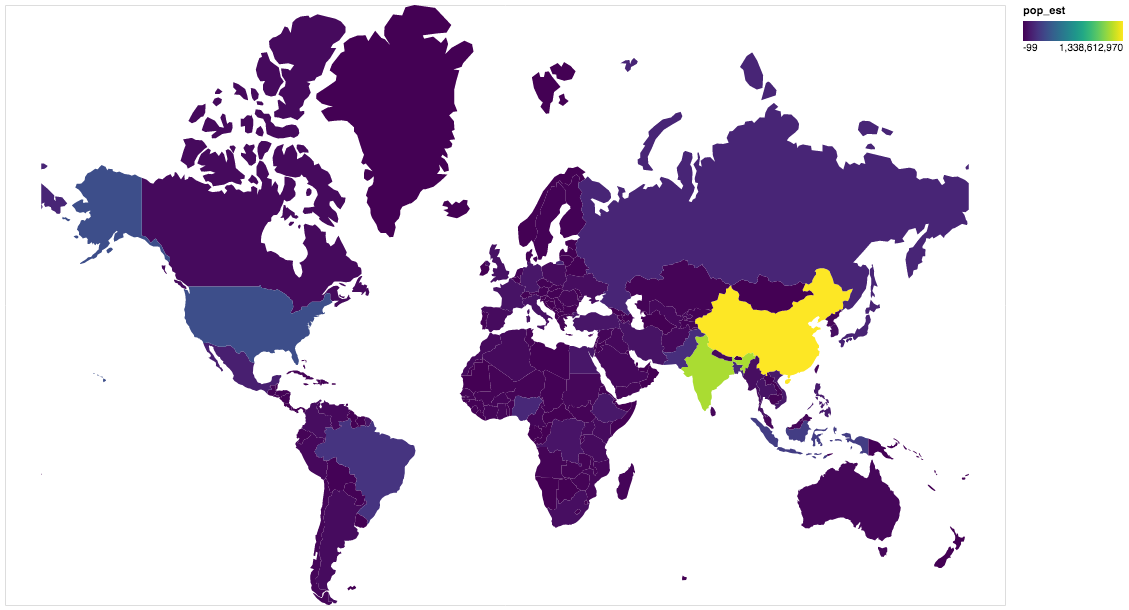
world = gpd.read_file(gpd.datasets.get_path('naturalearth_lowres'))

# GeoDataFrame could be passed as usual pd.DataFrame
alt.Chart(world[world.continent!='Antarctica']).mark_geoshape(
).project(
).encode(
    color='pop_est', # shorthand infer types as for regular pd.DataFrame
    tooltip='id:Q' # GeoDataFrame.index is accessible as id
).properties(
    width=500,
    height=300
)

output

Install

Dependencies

gpdvega requires:

  • Altair (>= 2.2.0 )
  • GeoPandas (>= 0.4.0)

User installation

using pip

pip install gpdvega

Changelog

See the changelog for a history of notable changes to gpdvega

Python script to locate mobile number

Python script to locate mobile number How to use this script run the command to install the required libraries pip install -r requirements.txt run the

Shekhar Gupta 8 Oct 10, 2022
Python renderer for OpenStreetMap with custom icons intended to display as many map features as possible

Map Machine project consists of Python OpenStreetMap renderer: SVG map generation, SVG and PNG tile generation, Röntgen icon set: unique CC-BY 4.0 map

Sergey Vartanov 0 Dec 18, 2022
A trivia questions about Europe

EUROPE TRIVIA QUIZ IN PYTHON Project Outline Ask user if he / she knows more about Europe. If yes show the Trivia main screen, else show the end Trivi

David Danso 1 Nov 17, 2021
Construct and use map tile grids in different projection.

Morecantile +-------------+-------------+ ymax | | | | x: 0 | x: 1 | | y: 0 | y: 0

Development Seed 67 Dec 23, 2022
Xarray backend to Copernicus Sentinel-1 satellite data products

xarray-sentinel WARNING: this product is a "technology preview" / pre-Alpha Xarray backend to explore and load Copernicus Sentinel-1 satellite data pr

B-Open 191 Dec 15, 2022
Tools for the extraction of OpenStreetMap street network data

OSMnet Tools for the extraction of OpenStreetMap (OSM) street network data. Intended to be used in tandem with Pandana and UrbanAccess libraries to ex

Urban Data Science Toolkit 47 Sep 21, 2022
Get-countries-info - A python code that fetches data of any country

Country-info A python code getting countries information including country's map

CODE 2 Feb 21, 2022
Introduction to Geospatial Analysis in Python

Introduction to Geospatial Analysis in Python This repository is in support of a talk on geospatial data. Data To recreate all of the examples, the da

Dillon Gardner 6 Oct 19, 2022
pure-Python (Numpy optional) 3D coordinate conversions for geospace ecef enu eci

Python 3-D coordinate conversions Pure Python (no prerequistes beyond Python itself) 3-D geographic coordinate conversions and geodesy. API similar to

Geospace code 292 Dec 29, 2022
Google Maps keeps old satellite imagery around for a while – this tool collects what's available for a user-specified region in the form of a GIF.

google-maps-at-88-mph The folks maintaining Google Maps regularly update the satellite imagery it serves its users, but outdated versions of the image

Noah Doersing 111 Sep 27, 2022
A simple python script that, given a location and a date, uses the Nasa Earth API to show a photo taken by the Landsat 8 satellite. The script must be executed on the command-line.

What does it do? Given a location and a date, it uses the Nasa Earth API to show a photo taken by the Landsat 8 satellite. The script must be executed

Caio 42 Nov 26, 2022
Read images to numpy arrays

mahotas-imread: Read Image Files IO with images and numpy arrays. Mahotas-imread is a simple module with a small number of functions: imread Reads an

Luis Pedro Coelho 67 Jan 07, 2023
PySAL: Python Spatial Analysis Library Meta-Package

Python Spatial Analysis Library PySAL, the Python spatial analysis library, is an open source cross-platform library for geospatial data science with

Python Spatial Analysis Library 1.1k Dec 18, 2022
Python library to decrypt Airtag reports, as well as a InfluxDB/Grafana self-hosted dashboard example

Openhaystack-python This python daemon will allow you to gather your Openhaystack-based airtag reports and display them on a Grafana dashboard. You ca

Bezmenov Denys 19 Jan 03, 2023
Platform for building statistical models of cities and regions

UrbanSim UrbanSim is a platform for building statistical models of cities and regions. These models help forecast long-range patterns in real estate d

Urban Data Science Toolkit 419 Dec 30, 2022
Open GeoJSON data on geojson.io

geojsonio.py Open GeoJSON data on geojson.io from Python. geojsonio.py also contains a command line utility that is a Python port of geojsonio-cli. Us

Jacob Wasserman 114 Dec 21, 2022
A Jupyter - Leaflet.js bridge

ipyleaflet A Jupyter / Leaflet bridge enabling interactive maps in the Jupyter notebook. Usage Selecting a basemap for a leaflet map: Loading a geojso

Jupyter Widgets 1.3k Dec 27, 2022
A toolbox for processing earth observation data with Python.

eo-box eobox is a Python package with a small collection of tools for working with Remote Sensing / Earth Observation data. Package Overview So far, t

13 Jan 06, 2022
A set of utility functions for working with GeoJSON annotations in Kaibu

kaibu-utils A set of utility functions for working with Kaibu. Create a new repository Create a new repository and select imjoy-team/imjoy-python-temp

ImJoy Team 0 Dec 12, 2021
Spatial Interpolation Toolbox is a Python-based GUI that is able to interpolate spatial data in vector format.

Spatial Interpolation Toolbox This is the home to Spatial Interpolation Toolbox, a graphical user interface (GUI) for interpolating geographic vector

Michael Ward 2 Nov 01, 2021