PyPassword is a simple follow up to PyPassphrase

Overview

PyPassword

PyPassword is a simple follow up to PyPassphrase. After finishing that project it occured to me that while some may wish to use that option, may not be able to do so due to pre-defined password requirements (for example, spaces not allowed or an arbitrary limit on the number of characters). Therefore, it seemed reasonable to create a more traditional password generator but wrap it also in a GUI frontend with PySimpleGUI.

There is nothing particularly special about this application past its compliment to PyPassphrase. In fact, I will likely merge the two applications so that both options exist in one.

Stay Tuned!

In the meantime, if you choose to use this as a stand-alone password generator keep in mind no attempts are made to make the resulting passwords easier to remember and it is highly recommended that you use a trusted and secure password manager such as Keepass or Linux Pass to store and manage the passwords.

The passwords are generated using the Python string library using lowercase, uppercase, digits and punctuation characters. Which group is used is chosen at random using the Python secrets library. A loop is used to randomize the list of characters and then from that list a random sample is taken that is the length of the password specified.

The result is some truly cyrptic passwords that, if using sufficient length (generally 15 characters or more), will be strong enough for most applications.

Currently only the command line option exists to launch the application and that for only Linux at the moment. To use the application simply download the binary and from the location where it is saved launch a terminal session and run the command ./pypassword. This will launch the GUI frontend.

Screenshots

You might also like...
A simple script that displays pixel-based animation on GitHub Activity

GitHub Activity Animator This project contains a simple Javascript snippet that produces an animation on your GitHub activity tracker. The project als

A simple python tool for explore your object detection dataset

A simple tool for explore your object detection dataset. The goal of this library is to provide simple and intuitive visualizations from your dataset and automatically find the best parameters for generating a specific grid of anchors that can fit you data characteristics

A deceptively simple plotting library for Streamlit

🍅 Plost A deceptively simple plotting library for Streamlit. Because you've been writing plots wrong all this time. Getting started pip install plost

Simple spectra visualization tool for astronomers

SpecViewer A simple visualization tool for astronomers. Dependencies Python = 3.7.4 PyQt5 = 5.15.4 pyqtgraph == 0.10.0 numpy = 1.19.4 How to use py

Simple CLI python app to show a stocks graph performance. Made with Matplotlib and Tiingo.

stock-graph-python Simple CLI python app to show a stocks graph performance. Made with Matplotlib and Tiingo. Tiingo API Key You will need to add your

Simple Inkscape Scripting

Simple Inkscape Scripting Description In the Inkscape vector-drawing program, how would you go about drawing 100 diamonds, each with a random color an

eoplatform is a Python package that aims to simplify Remote Sensing Earth Observation by providing actionable information on a wide swath of RS platforms and provide a simple API for downloading and visualizing RS imagery

An Earth Observation Platform Earth Observation made easy. Report Bug | Request Feature About eoplatform is a Python package that aims to simplify Rem

simple tool to paint axis x and y

simple tool to paint axis x and y

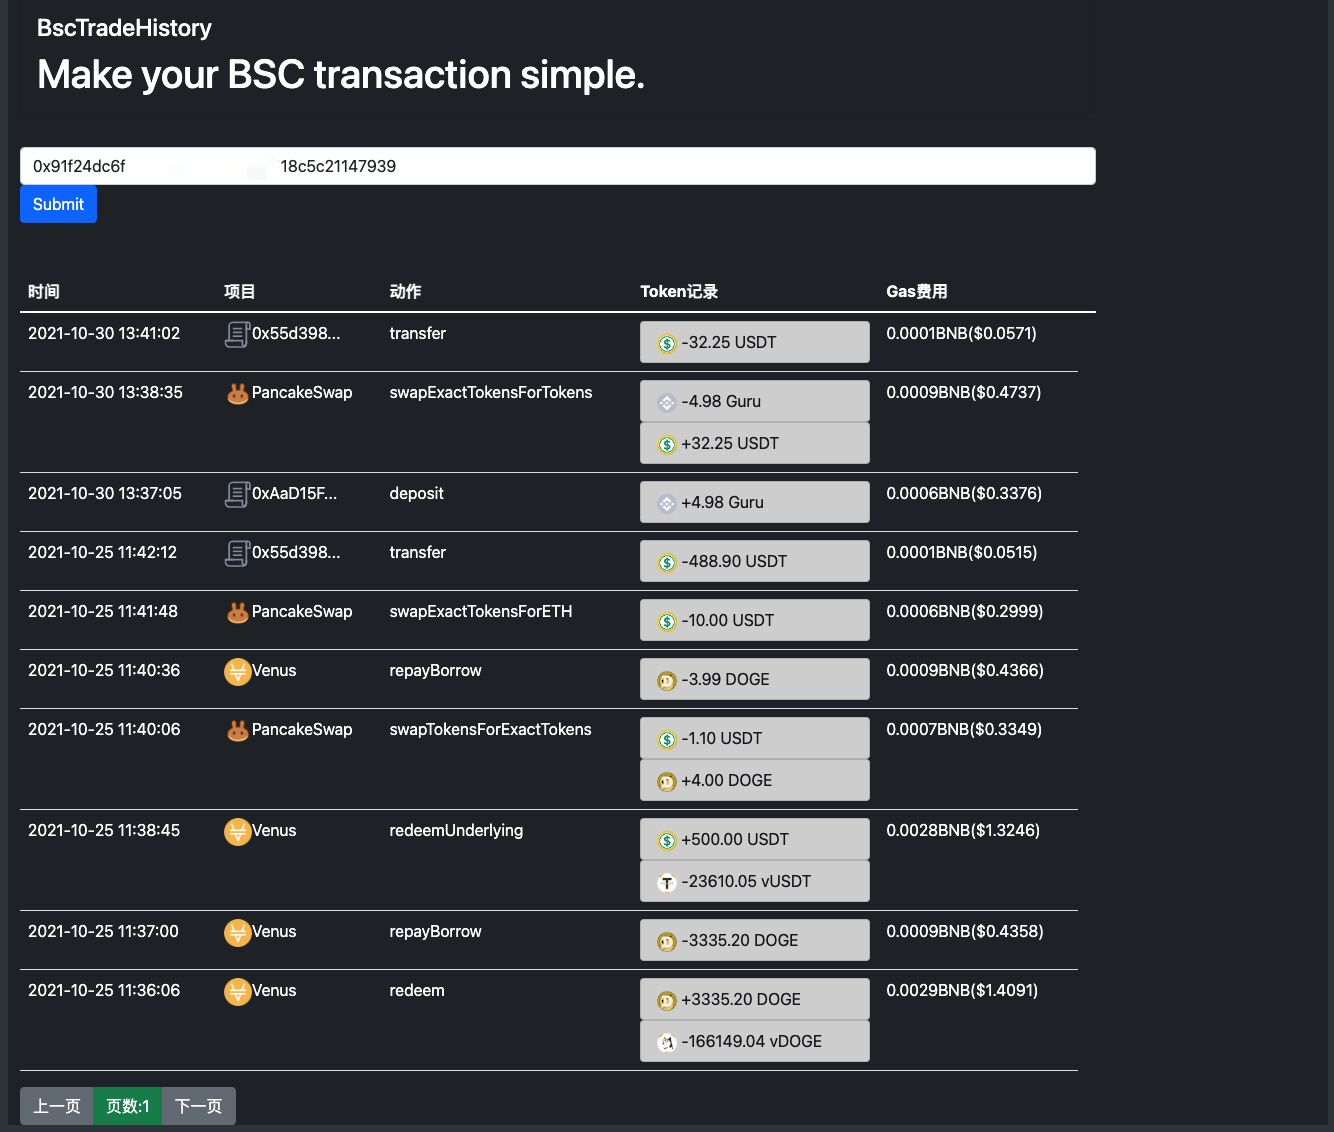
Make your BSC transaction simple.

bsc_trade_history Make your BSC transaction simple. 中文ReadMe Background: inspired by debank ,Practice my hands on this small project Blog:Crypto-BscTr

Comments
Releases(v1.1.0)
Owner
Scotty
Scotty
termplotlib is a Python library for all your terminal plotting needs.

termplotlib termplotlib is a Python library for all your terminal plotting needs. It aims to work like matplotlib. Line plots For line plots, termplot

Nico Schlömer 553 Dec 30, 2022
Visualization Data Drug in thailand during 2014 to 2020

Visualization Data Drug in thailand during 2014 to 2020 Data sorce from ข้อมูลเปิดภาครัฐ สำนักงาน ป.ป.ส Inttroducing program Using tkinter module for

Narongkorn 1 Jan 05, 2022
A little logger for machine learning research

Blinker Blinker provides a fast dispatching system that allows any number of interested parties to subscribe to events, or "signals". Signal receivers

Reinforcement Learning Working Group 27 Dec 03, 2022
A dashboard built using Plotly-Dash for interactive visualization of Dex-connected individuals across the country.

Dashboard For The DexConnect Platform of Dexterity Global Working prototype submission for internship at Dexterity Global Group. Dashboard for real ti

Yashasvi Misra 2 Jun 15, 2021
Rubrix is a free and open-source tool for exploring and iterating on data for artificial intelligence projects.

Open-source tool for exploring, labeling, and monitoring data for AI projects

Recognai 1.5k Jan 07, 2023
A curated list of awesome Dash (plotly) resources

Awesome Dash A curated list of awesome Dash (plotly) resources Dash is a productive Python framework for building web applications. Written on top of

Luke Singham 1.7k Jan 07, 2023
A Jupyter - Leaflet.js bridge

ipyleaflet A Jupyter / Leaflet bridge enabling interactive maps in the Jupyter notebook. Usage Selecting a basemap for a leaflet map: Loading a geojso

Jupyter Widgets 1.3k Dec 27, 2022
China and India Population and GDP Visualization

China and India Population and GDP Visualization Historical Population Comparison between India and China This graph shows the population data of Indi

Nicolas De Mello 10 Oct 27, 2021
Simple, realtime visualization of neural network training performance.

pastalog Simple, realtime visualization server for training neural networks. Use with Lasagne, Keras, Tensorflow, Torch, Theano, and basically everyth

Rewon Child 416 Dec 29, 2022
Streaming pivot visualization via WebAssembly

Perspective is an interactive visualization component for large, real-time datasets. Originally developed for J.P. Morgan's trading business, Perspect

The Fintech Open Source Foundation (www.finos.org) 5.1k Dec 27, 2022
Here I plotted data for the average test scores across schools and class sizes across school districts.

HW_02 Here I plotted data for the average test scores across schools and class sizes across school districts. Average Test Score by Race This graph re

7 Oct 27, 2021
RockNext is an Open Source extending ERPNext built on top of Frappe bringing enterprise ready utilization.

RockNext is an Open Source extending ERPNext built on top of Frappe bringing enterprise ready utilization.

Matheus Breguêz 13 Oct 12, 2022
view cool stats related to your discord account.

DiscoStats cool statistics generated using your discord data. How? DiscoStats is not a service that breaks the Discord Terms of Service or Community G

ibrahim hisham 5 Jun 02, 2022
Write python locally, execute SQL in your data warehouse

RasgoQL Write python locally, execute SQL in your data warehouse ≪ Read the Docs · Join Our Slack » RasgoQL is a Python package that enables you to ea

Rasgo 265 Nov 21, 2022
Interactive chemical viewer for 2D structures of small molecules

👀 mols2grid mols2grid is an interactive chemical viewer for 2D structures of small molecules, based on RDKit. ➡️ Try the demo notebook on Google Cola

Cédric Bouysset 154 Dec 26, 2022
Homework 2: Matplotlib and Data Visualization

Homework 2: Matplotlib and Data Visualization Overview These data visualizations were created for my introductory computer science course using Python

Sophia Huang 12 Oct 20, 2022
A high performance implementation of HDBSCAN clustering. http://hdbscan.readthedocs.io/en/latest/

HDBSCAN Now a part of scikit-learn-contrib HDBSCAN - Hierarchical Density-Based Spatial Clustering of Applications with Noise. Performs DBSCAN over va

Leland McInnes 91 Dec 29, 2022
DataVisualization - The evolution of my arduino and python journey. New level of competence achieved

DataVisualization - The evolution of my arduino and python journey. New level of competence achieved

1 Jan 03, 2022
Sentiment Analysis application created with Python and Dash, hosted at socialsentiment.net

Social Sentiment Dash Application Live-streaming sentiment analysis application created with Python and Dash, hosted at SocialSentiment.net. Dash Tuto

Harrison 456 Dec 25, 2022
The interactive graphing library for Python (includes Plotly Express) :sparkles:

plotly.py Latest Release User forum PyPI Downloads License Data Science Workspaces Our recommended IDE for Plotly’s Python graphing library is Dash En

Plotly 12.7k Jan 05, 2023