当前位置:网站首页>Vectortilelayer replacement style
Vectortilelayer replacement style
2022-07-26 09:53:00 【Zhou Xiaotiao】
Problem description :
Base map ( Vector slice layer url) unchanged , But you need to add different style Form the effect of animation rotation .
It's not difficult to change the style of the layer , Find the corresponding feature, Use feature.setStyle That's all right. . But the problem I encountered in the project was that I couldn't get feature, Or get feature Unavailable ( As soon as my colleague came across the use of feature.setStyle Not in effect , Finally, the reason was not found , Finally, add layers of different styles each time you change the style , Then add a pile of layers, Resulting in a very large map ).
This article is about no feature How to change the style when ——layer.setStyle
Code details :
// prop:  Used for splicing url Of
// layerId:  Layers id, Unique identification
// geom: Used to change different style
loadRainForcastLayer(prop, layerId,geom) {

    let levelJson = JSON.parse(geom);
    // style  and  setStyle  Methods will appear this Point to different problems , So first put it forward
    let that = this
	// Find all in the map layer, Judge whether the layer to be added already exists
    this.getLayers().forEach((layer) => {

      if (layer.getProperties().id&&layer.getProperties().id == layerId) {

        this.rainForcastLayer = layer;
      }
    });
    // If the layer exists , Change the style directly
    if (this.rainForcastLayer) {

		this.rainForcastLayer.setVisible(true);
        this.rainForcastLayer.setStyle(function(feature,res){

          let id = feature.get("id");

          //  Down here   adopt id Get the style of the layer   Color  ↓
          let number=levelJson[id]?levelJson[id]:0
          let level=that.getLevel(number)

          let text=String(number)==0?"":String(number)
          let color=conf.mapViewer.Predicforeca[level]
    	//  From here up   adopt id Get the style of the layer   Color  ↑

          let vectorTileStyle = new Style({

            stroke: new Stroke({

              color: "rgba(255,255,255,0)",
              width: 2,
            }),
            fill: new Fill({

              color: color
            }),
            text: new Text({
     // Text style
              font: '12px Calibri,sans-serif',
              fill: new Fill({

                color: '#000'
              }),
              stroke: new Stroke({

                color: '#000',
                width: 1,
              }),
             //  Pay attention to this text Can only be  string  Format , So the previous conversion
              text:text
            }),

          });
          return vectorTileStyle
        })
			return;
		}


		let style = "";

		// Start splicing here url, If there is a complete available url You can skip this paragraph  ↓
		var gridsetName = "EPSG:4326";
    	var gridNames = [
			"EPSG:4326:0",
			"EPSG:4326:1",
			"EPSG:4326:2",
			"EPSG:4326:3",
			"EPSG:4326:4",
			"EPSG:4326:5",
			"EPSG:4326:6",
			"EPSG:4326:7",
			"EPSG:4326:8",
			"EPSG:4326:9",
			"EPSG:4326:10",
			"EPSG:4326:11",
			"EPSG:4326:12",
			"EPSG:4326:13",
			"EPSG:4326:14",
			"EPSG:4326:15",
			"EPSG:4326:16",
			"EPSG:4326:17",
			"EPSG:4326:18",
		];
    let format = "application/vnd.mapbox-vector-tile";
    var resolutions = [0.703125, 0.3515625, 0.17578125, 0.087890625, 0.0439453125, 0.02197265625, 0.010986328125, 0.0054931640625, 0.00274658203125, 0.001373291015625, 6.866455078125E-4, 3.4332275390625E-4, 1.71661376953125E-4, 8.58306884765625E-5, 4.291534423828125E-5, 2.1457672119140625E-5, 1.0728836059570312E-5, 5.364418029785156E-6, 2.682209014892578E-6, 1.341104507446289E-6, 6.705522537231445E-7, 3.3527612686157227E-7];
    let vectorTileParams = {

			REQUEST: "GetTile",
			SERVICE: "WMTS",
			VERSION: "1.0.0",
			LAYER: prop.layer,
			STYLE: style,
			TILEMATRIX: gridsetName + ":{z}",
			TILEMATRIXSET: gridsetName,
			FORMAT: format,
			TILECOL: "{x}",
			TILEROW: "{y}",
		};
    var projection = new Projection({

			code: "EPSG:4326",
			units: "degrees",
			axisOrientation: "neu",
		});

    let baseUrl = ipConfig.geoServer + "/gwc/service/wmts";
		let url = baseUrl + "?";
		for (var param in vectorTileParams) {

			url = url + param + "=" + vectorTileParams[param] + "&";
		}
    // End the splicing here url, If there is a complete available url You can skip this paragraph  ↑

    // Add this layer for the first time
    this.rainForcastLayer = new VectorTileLayer({

      style: function(feature){

        let id = feature.get("id");
        let number=levelJson[id]?levelJson[id]:0;
        let level=that.getLevel(number)
        let text=String(number)==0?"":String(number)
        let color=conf.mapViewer.Predicforeca[level]
        let styles=new Style({

          stroke: new Stroke({

            color: "rgba(255,255,255,0)",
            width: 2,
          }),
          fill: new Fill({

            color: color
          }),
          text: new Text({
     // Text style
            font: '12px Calibri,sans-serif',
            stroke: new Stroke({

              color: '#000',
              width: 1,
            }),
            fill: new Fill({

              color: '#000'
            }),
            text:text
          })
        })
        return styles;
      },
      zIndex: ZINDEXCONSTANT.NINECLASSLAYER,
      id: layerId,
      projection: projection,
      maxResolution: 350,
      source: new VectorTileSource({

        projection: projection,
        tileGrid: new WMTSTileGrid({

          tileSize: [256, 256],
          origin: [-180.0, 90.0],
          resolutions: resolutions,
          matrixIds: gridNames,
        }),
        format: new MVT(),
        url: url,
        wrapX: true,
        tilePixelRatio: 1,

      }),
    });
	this.addLayer(this.rainForcastLayer);


  }
The method of map operation is written , Then set a timer directly when animating :
play(){

  this.timeInterval = setInterval(() => {

            if (this.currentRowIndex < this.forecastList.length - 1) {

              this.currentRowIndex++;
            } else {

              this.currentRowIndex = 0;
            }
            this.levelJson=JSON.parse(this.forecastList[this.currentRowIndex].predicProduct)
            this.loadRainForcastLayer(
               {

                  key: 'layer-rainForcast',
                  layer:"meteo_qpf:QPF",
                  title: ' Rainfall forecast ',
                },
                "layer-rainForcast",
                this.forecastList[this.currentRowIndex].predicProduct
              );
          }, 3000);}
Then when it stops :
stop(){

	// Hide the corresponding layer
  this.rainForcastLayer && this.rainForcastLayer.setVisible(false);
  // Clear timer
  clearInterval(this.timeInterval)
}
Then the function can be completed !
边栏推荐
- R语言ggpubr包ggsummarystats函数可视化分组箱图(自定义分组颜色)并在X轴标签下方添加分组对应的统计值(样本数N、中位数median、四分位数的间距iqr、统计值的色彩和分组图色匹配
- 在.NET 6.0中配置WebHostBuilder
- Flutter Event 派发
- m进制数str转n进制数
- 一种分布式深度学习编程新范式:Global Tensor
- Fiddler packet capturing tool for mobile packet capturing
- Qt随手笔记(二)Edit控件及float,QString转化、
- POJ 1012 Joseph
- JS 一行代码 获取数组最大值与最小值
- protobuf的基本用法
猜你喜欢

regular expression

Mysql5.7.25 master-slave replication (one-way)

2022年中科磐云——服务器内部信息获取 解析flag
开发转测试:从0开始的6年自动化之路...

Xiaobai makes a wave of deep copy and shallow copy

AR model in MATLAB for short-term traffic flow prediction
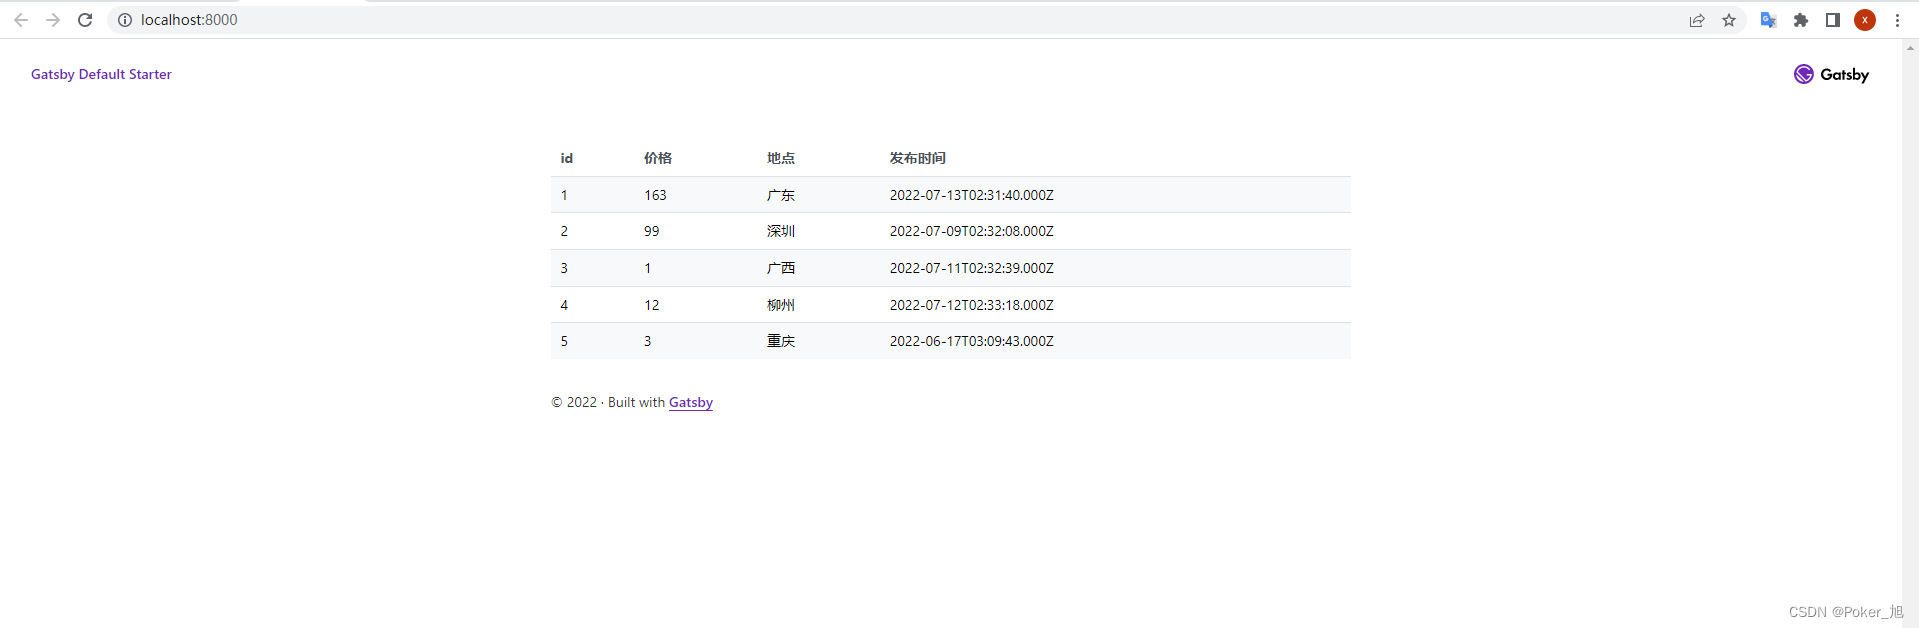
SSG框架Gatsby访问数据库,并显示到页面上

【荧光字效果】

解决ProxyError: Conda cannot proceed due to an error in your proxy configuration.

Gauss elimination
随机推荐
[fluorescent character effect]
[information system project manager] summary of essence of high-level series for the first time
Fiddler packet capturing tool for mobile packet capturing
QT handy notes (II) edit control and float, qstring conversion
regular expression
【荧光字效果】
Nodejs service background execution (forever)
挡不住了,纯国产PC已就位,美国的软硬件体系垄断正式被破
Flutter event distribution
Unstoppable, pure domestic PCs have been in place, and the monopoly of the U.S. software and hardware system has been officially broken
在.NET 6.0中配置WebHostBuilder
Search module use case writing
Gauss elimination
IE7 set overflow attribute failure solution
IIS website configuration
小白搞一波深拷贝 浅拷贝
Show default image when wechat applet image cannot be displayed
Alibaba cloud technology expert haochendong: cloud observability - problem discovery and positioning practice
Usage of the formatter attribute of El table
Docker configuring MySQL Cluster