Monitor and log Network and Disks statistics in MegaBytes per second.

Overview

iometrics

Python

Monitor and log Network and Disks statistics in MegaBytes per second.

Install

pip install iometrics

Usage

Pytorch-lightning integration

from pytorch_lightning import Trainer
from iometrics.pytorch_lightning.callbacks import NetworkAndDiskStatsMonitor

net_disk_stats = NetworkAndDiskStatsMonitor()

trainer = Trainer(callbacks=[net_disk_stats])

Metrics generated

  • network/recv_MB_per_sec – Received MB/s on all relevant network interfaces as a SUM.
  • network/sent_MB_per_sec – Sent MB/s on all relevant network interfaces as a SUM.
  • disk/util% – Disk utilization percentage as the average of all disk devices.
  • disk/read_MB_per_sec – Disks read MB/s as the sum of all disk devices.
  • disk/writ_MB_per_sec – Disks written MB/s as the sum of all disk devices.
  • disk/io_read_count_per_sec – Disks read I/O operations per second as the sum of all disk devices.
  • disk/io_writ_count_per_sec – Disks written I/O operations per second as the sum of all disk devices.
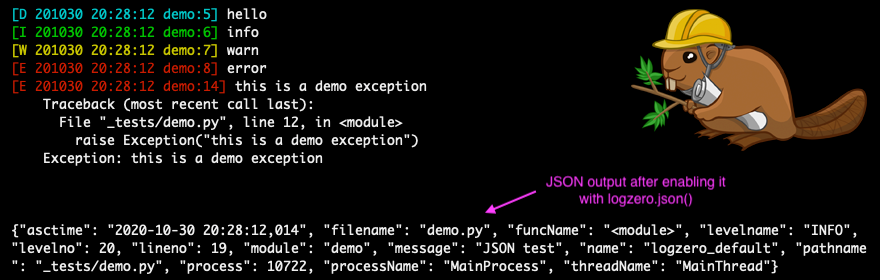
Screen shot

Pure-Python implementation (zero dependencies)

Quick check

python -c 'from iometrics.example import usage; usage()'

Example output

|        Network (MBytes/s)       | Disk Util |            Disk MBytes          |           Disk I/O          |
|     Received    |     Sent      |     %     |    MB/s Read    |  MB/s Written |     I/O Read    | I/O Write |
|   val  |   avg  |  val  |  avg  | val | avg |  val   |  avg   |  val  |  avg  |   val  |   avg  | val | avg |
| ------:| ------:| -----:| -----:| ---:| ---:| ------:| ------:| -----:| -----:| ------:| ------:| ---:| ---:|
|    4.6 |    3.5 |   0.1 |   0.1 |  49 |   2 |   52.8 |    1.1 |   0.0 |   0.9 |    211 |      4 |   5 |  18 |
|    4.1 |    3.5 |   0.1 |   0.1 |  61 |   3 |   60.4 |    2.4 |  40.3 |   1.7 |    255 |     10 | 149 |  21 |

Full code

import time
from iometrics import NetworkMetrics, DiskMetrics
from iometrics.example import DUAL_METRICS_HEADER
net  = NetworkMetrics()
disk = DiskMetrics()
for i in range(100):
    time.sleep(1)
    net.update_stats()
    disk.update_stats()
    if i % 15 == 0:
        print(DUAL_METRICS_HEADER)
    row = (
        f"| {net.mb_recv_ps.val:6.1f} | {net.mb_recv_ps.avg:6.1f} "
        f"| {net.mb_sent_ps.val:5.1f} | {net.mb_sent_ps.avg:5.1f} "
        f"| {int(disk.io_util.val):3d} | {int(disk.io_util.avg):3d} "
        f"| {disk.mb_read.val:6.1f} | {disk.mb_read.avg:6.1f} "
        f"| {disk.mb_writ.val:5.1f} | {disk.mb_writ.avg:5.1f} "
        f"| {int(disk.io_read.val):4d} | {int(disk.io_read.avg):4d} "
        f"| {int(disk.io_writ.val):3d} | {int(disk.io_writ.avg):3d} "
        f"|"
    )
    print(row)

Contributing

See CONTRIBUTING.md

You might also like...
loghandler allows you to easily log messages to multiple endpoints.

loghandler loghandler allows you to easily log messages to multiple endpoints. Using Install loghandler via pip pip install loghandler In your code im

A simple package that allows you to save inputs & outputs as .log files

wolf_dot_log A simple package that allows you to save inputs & outputs as .log files pip install wolf_dot_log pip3 install wolf_dot_log |Instructions|

This is a wonderful simple python tool used to store the keyboard log.

Keylogger This is a wonderful simple python tool used to store the keyboard log. Record your keys. It will capture passwords and credentials in a comp

Python script to scan log files/system for unauthorized access around system

checkLogs Python script to scan log files/system for unauthorized access around Linux systems Table of contents General info Getting started Usage Gen

ClusterMonitor - a very simple python script which monitors and records the CPU and RAM consumption of submitted cluster jobs

ClusterMonitor A very simple python script which monitors and records the CPU and RAM consumption of submitted cluster jobs. Usage To start recording

Robust and effective logging for Python 2 and 3.

Robust and effective logging for Python 2 and 3.

Soda SQL Data testing, monitoring and profiling for SQL accessible data.

Soda SQL Data testing, monitoring and profiling for SQL accessible data. What does Soda SQL do? Soda SQL allows you to Stop your pipeline when bad dat

A Fast, Extensible Progress Bar for Python and CLI

tqdm tqdm derives from the Arabic word taqaddum (تقدّم) which can mean "progress," and is an abbreviation for "I love you so much" in Spanish (te quie

Rich is a Python library for rich text and beautiful formatting in the terminal.

Rich 中文 readme • lengua española readme • Läs på svenska Rich is a Python library for rich text and beautiful formatting in the terminal. The Rich API

Comments
  • Add Docker Support

    Add Docker Support

    Change Summary

    Add Docker Support

    Related issue number

    https://github.com/elgalu/iometrics/issues/3

    Checklist

    • [ ] Unit tests for the changes exist
    • [ ] Tests pass on CI and coverage is maintained
    • [x] Documentation reflects the changes where applicable
    opened by m0rt3z4gh 0
  • Not working properly in containers (Docker)

    Not working properly in containers (Docker)

    Network metrics properly reported in the Host:

    |        Network (MBytes/s)       | Disk Util |            Disk MBytes          |             Disk I/O            |
    |     Received    |     Sent      |     %     |    MB/s Read    |  MB/s Written |     I/O Read    |   I/O Write   |
    |   val  |   avg  |  val  |  avg  | val | avg |  val   |  avg   |  val  |  avg  |   val  |   avg  |  val  |  avg  |
    | ------:| ------:| -----:| -----:| ---:| ---:| ------:| ------:| -----:| -----:| ------:| ------:| -----:| -----:|
    |  417.2 |  417.2 |   3.0 |   3.0 |   8 |   8 |    0.9 |    0.9 | 370.5 | 370.5 |    220 |    220 | 11897 | 11897 |
    |  335.1 |  376.1 |   2.4 |   2.7 |  10 |   9 |    1.4 |    1.1 | 275.5 | 323.0 |    335 |    278 |  9168 | 10532 |
    |  434.2 |  395.5 |   3.2 |   2.9 |   9 |   9 |    3.9 |    2.1 | 169.9 | 272.0 |    653 |    403 | 11450 | 10838 |
    

    Network metrics are not visible in the container Disclaimer: the timeline extracts are not perfectly synchronized

    |        Network (MBytes/s)       | Disk Util |            Disk MBytes          |             Disk I/O            |
    |     Received    |     Sent      |     %     |    MB/s Read    |  MB/s Written |     I/O Read    |   I/O Write   |
    |   val  |   avg  |  val  |  avg  | val | avg |  val   |  avg   |  val  |  avg  |   val  |   avg  |  val  |  avg  |
    | ------:| ------:| -----:| -----:| ---:| ---:| ------:| ------:| -----:| -----:| ------:| ------:| -----:| -----:|
    |    0.0 |    0.0 |   0.0 |   0.0 |   7 |   9 |    0.9 |    1.3 |  82.4 | 556.4 |    216 |    310 | 20093 |  9335 |
    |    0.0 |    0.0 |   0.0 |   0.0 |   9 |   9 |   24.9 |    2.0 | 375.4 | 550.8 |    783 |    325 |  3604 |  9156 |
    |    0.0 |    0.0 |   0.0 |   0.0 |  10 |   9 |   60.5 |    3.8 | 103.9 | 537.2 |   1315 |    355 | 12689 |  9263 |
    

    To reproduce

    1. generate network I/O outside the container (in the host)
    2. start a container without any special flags, without any admin or additional capabilities

    TODO

    Find a fix with the least possible privileges

    bug 
    opened by elgalu 0
  • Features/azdo pipeline

    Features/azdo pipeline

    Change Summary

    Related issue number

    Checklist

    • [ ] Unit tests for the changes exist
    • [ ] Tests pass on CI and coverage is maintained
    • [ ] Documentation reflects the changes where applicable
    opened by ugurgural 0
Releases(0.0.8)
Owner
Leo Gallucci
Leo is the creator of docker-selenium which aims to get Selenium running as simple and fast as possible
Leo Gallucci
Monitor creation, deletion and changes to LDAP objects live during your pentest or system administration!

LDAP Monitor Monitor creation, deletion and changes to LDAP objects live during your pentest or system administration! With this tool you can quickly

Podalirius 500 Dec 28, 2022
HTTP(s) "monitoring" webpage via FastAPI+Jinja2. Inspired by https://github.com/RaymiiOrg/bash-http-monitoring

python-http-monitoring HTTP(s) "monitoring" powered by FastAPI+Jinja2+aiohttp. Inspired by bash-http-monitoring. Installation can be done with pipenv

itzk 39 Aug 26, 2022
🐑 Syslog Simulator hazır veya kullanıcıların eklediği logları belirtilen adreslere ve port'a seçilen döngüde syslog ile gönderilmesini sağlayan araçtır. | 🇹🇷

syslogsimulator hazır ürün loglarını SIEM veya log toplayıcısına istediğiniz portta belirli sürelerde göndermeyi sağlayan küçük bir araçtır.

Enes Aydın 3 Sep 28, 2021
A python library used to interact with webots robocup game web logs

A python library used to interact with webots robocup game web logs

Hamburg Bit-Bots 2 Nov 05, 2021
giving — the reactive logger

giving is a simple, magical library that lets you log or "give" arbitrary data throughout a program and then process it as an event stream.

Olivier Breuleux 0 May 24, 2022
A very basic esp32-based logic analyzer capable of sampling digital signals at up to ~3.2MHz.

A very basic esp32-based logic analyzer capable of sampling digital signals at up to ~3.2MHz.

Davide Della Giustina 43 Dec 27, 2022
Colored terminal output for Python's logging module

coloredlogs: Colored terminal output for Python's logging module The coloredlogs package enables colored terminal output for Python's logging module.

Peter Odding 496 Dec 30, 2022
Rich is a Python library for rich text and beautiful formatting in the terminal.

Rich 中文 readme • lengua española readme • Läs på svenska Rich is a Python library for rich text and beautiful formatting in the terminal. The Rich API

Will McGugan 41.5k Jan 07, 2023
Monitoring plugin to check disk io with Icinga, Nagios and other compatible monitoring solutions

check_disk_io - Monitor disk io This is a monitoring plugin for Icinga, Nagios and other compatible monitoring solutions to check the disk io. It uses

DinoTools 3 Nov 15, 2022
A python logging library

logi v1.3.4 instolation the lib works on python 3x versions pip install logi examples import import logi log = logger(path='C:/file path', timestamp=T

2 Jul 06, 2022
Ransomware leak site monitoring

RansomWatch RansomWatch is a ransomware leak site monitoring tool. It will scrape all of the entries on various ransomware leak sites, store the data

Zander Work 278 Dec 31, 2022
A Fast, Extensible Progress Bar for Python and CLI

tqdm tqdm derives from the Arabic word taqaddum (تقدّم) which can mean "progress," and is an abbreviation for "I love you so much" in Spanish (te quie

tqdm developers 23.7k Jan 01, 2023
A small utility to pretty-print Python tracebacks. ⛺

TBVaccine TBVaccine is a utility that pretty-prints Python tracebacks. It automatically highlights lines you care about and deemphasizes lines you don

Stavros Korokithakis 365 Nov 11, 2022
ClusterMonitor - a very simple python script which monitors and records the CPU and RAM consumption of submitted cluster jobs

ClusterMonitor A very simple python script which monitors and records the CPU and RAM consumption of submitted cluster jobs. Usage To start recording

23 Oct 04, 2021
A Prometheus exporter for monitoring & analyzing Grafana Labs' technical documentation

grafana-docs-exporter A Prometheus exporter for monitoring & analyzing Grafana Labs' technical documentation Here is the public endpoint.

Matt Abrams 5 May 02, 2022
Command-line tool that instantly fetches Stack Overflow results when an exception is thrown

rebound Rebound is a command-line tool that instantly fetches Stack Overflow results when an exception is thrown. Just use the rebound command to exec

Jonathan Shobrook 3.9k Jan 03, 2023
Log processor for nginx or apache that extracts user and user sessions and calculates other types of useful data for bot detection or traffic analysis

Log processor for nginx or apache that extracts user and user sessions and calculates other types of useful data for bot detection or traffic analysis

David Puerta Martín 1 Nov 11, 2021
Pretty-print tabular data in Python, a library and a command-line utility. Repository migrated from bitbucket.org/astanin/python-tabulate.

python-tabulate Pretty-print tabular data in Python, a library and a command-line utility. The main use cases of the library are: printing small table

Sergey Astanin 1.5k Jan 06, 2023
Fuzzy-logger - Fuzzy project is here Log all your pc's actions Simple and free to use Security of datas !

Fuzzy-logger - ➡️⭐ Fuzzy ⭐ project is here ! ➡️ Log all your pc's actions ! ➡️ Simple and free to use ➡️ Security of datas !

natrix_dev 2 Oct 02, 2022
This is a key logger based in python which when executed records all the keystrokes of the system it has been executed on .

This is a key logger based in python which when executed records all the keystrokes of the system it has been executed on

Purbayan Majumder 0 Mar 28, 2022