nettrace
nettrace is is a powerful tool to trace network packet and diagnose network problem inside kernel on TencentOS. It make use of eBPF and BCC.
BCC (BPF Compiler Collection) is a toolkit to make eBPF programs easier to write, with kernel instrumentation in C (and includes a C wrapper around LLVM), and front-ends in Python and lua.
'skb' is the struct that used in kernel to store network package. By tracing kernel function and tracepoint (with the help of kprobe based on eBPF) that handle skb, nettrace is able to show the path of skb bypass inside kernel network stack. Therefor, some network issue (such as package drop) can be solved simply.
1. install
1.1 source code
For centos, the package 'bcc' should be installed; For ubuntu, the package 'bpfcc-tools' shoudl be installed.
Then, simply download the source code and run 'nettrace.py' in it.
1.2 rpm
Download the rpm package from the release and install it. Then you can run 'nettrace' command.
1.3 docker
Download the docker image in the release. You can use it in two ways:
Way 1:
import the image to docker with the command:
docker import ./docker-nettrace.tar.bz2 nettrace
and create the container with command:
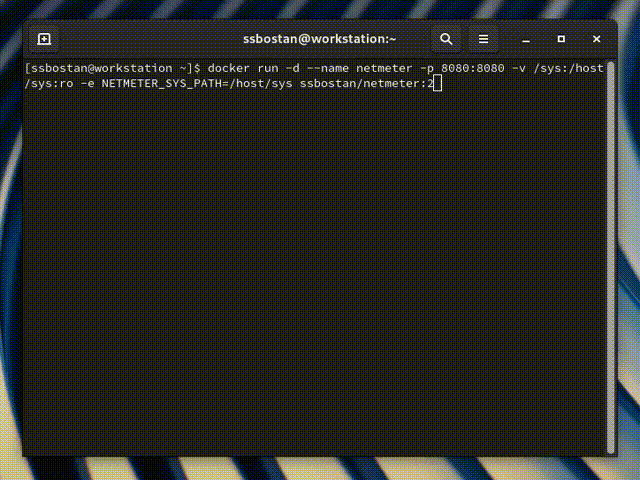
docker run -itd -v /usr/src/:/usr/src/ -v /lib/modules/:/lib/modules/ --name nettrace --privileged nettrace bash
Then, you can enter the container with command:
docker exec -it nettrace bash
and use the command 'nettrace' in it.
Way 2:
directly unzip the tar file with the command mkdir nettrace && tar -xf ./docker-nettrace.tar.bz2 -C nettrace and run the command cd nettrace && ./ntenter.sh, then you can use the command 'nettrace'.
the command ./ntenter.sh clean is able to umount the mountpoint and header files that it created, so run this command to do the clean job if you don't need nettrace anymore.
2. usage
2.1 Base usage
Below is the basic usage of nettrace to trace icmp package with ip address 10.35.13.63. The kernel function that skb bypass, timestamp and basic icmp information are printed.
$ nettrace -p icmp --addr 10.35.13.63
begin tracing......
453516.922978: [napi_gro_receive        ]: ICMP: 10.35.13.63 -> 9.135.224.89, ping request   , seq: 1
453516.922998: [enqueue_to_backlog      ]: ICMP: 10.35.13.63 -> 9.135.224.89, ping request   , seq: 1
453516.923012: [__netif_receive_skb_core]: ICMP: 10.35.13.63 -> 9.135.224.89, ping request   , seq: 1
453516.923019: [tpacket_rcv             ]: ICMP: 10.35.13.63 -> 9.135.224.89, ping request   , seq: 1
453516.923025: [ip_rcv                  ]: ICMP: 10.35.13.63 -> 9.135.224.89, ping request   , seq: 1
453516.923028: [ip_rcv_core             ]: ICMP: 10.35.13.63 -> 9.135.224.89, ping request   , seq: 1
453516.923032: [skb_clone               ]: ICMP: 10.35.13.63 -> 9.135.224.89, ping request   , seq: 1
453516.923036: [nf_hook_slow            ]: ICMP: 10.35.13.63 -> 9.135.224.89, ping request   , seq: 1
453516.923055: [ip_rcv_finish           ]: ICMP: 10.35.13.63 -> 9.135.224.89, ping request   , seq: 1
453516.923061: [ip_local_deliver        ]: ICMP: 10.35.13.63 -> 9.135.224.89, ping request   , seq: 1
453516.923063: [nf_hook_slow            ]: ICMP: 10.35.13.63 -> 9.135.224.89, ping request   , seq: 1
453516.923070: [ip_local_deliver_finish ]: ICMP: 10.35.13.63 -> 9.135.224.89, ping request   , seq: 1
With --detail specified, more information can be see:
$ nettrace -p icmp --addr 10.35.13.63 --detail
begin tracing......
454861.534996: [ffff8887b6260800][2:eth1][pid:0,swapper/3][link-in     ][napi_gro_receive        ]: ICMP: 10.35.13.63 -> 9.135.224.89, ping request   , seq: 1
454861.535022: [ffff8887b6260800][2:eth1][pid:0,swapper/3][link-in     ][enqueue_to_backlog      ]: ICMP: 10.35.13.63 -> 9.135.224.89, ping request   , seq: 1
454861.535048: [ffff8887b6260800][2:eth1][pid:0,swapper/2][link-in     ][__netif_receive_skb_core]: ICMP: 10.35.13.63 -> 9.135.224.89, ping request   , seq: 1
454861.535060: [ffff8887b6260800][2:eth1][pid:0,swapper/2][pkt-in      ][tpacket_rcv             ]: ICMP: 10.35.13.63 -> 9.135.224.89, ping request   , seq: 1
454861.535070: [ffff8887b6260800][2:eth1][pid:0,swapper/2][ip-in       ][ip_rcv                  ]: ICMP: 10.35.13.63 -> 9.135.224.89, ping request   , seq: 1
454861.535078: [ffff8887b6260800][2:eth1][pid:0,swapper/2][ip-in       ][ip_rcv_core             ]: ICMP: 10.35.13.63 -> 9.135.224.89, ping request   , seq: 1
454861.535086: [ffff8887b6260800][2:eth1][pid:0,swapper/2][life        ][skb_clone               ]: ICMP: 10.35.13.63 -> 9.135.224.89, ping request   , seq: 1
454861.535094: [ffff88858f242100][2:eth1][pid:0,swapper/2][netfilter   ][nf_hook_slow            ]: ICMP: 10.35.13.63 -> 9.135.224.89, ping request   , seq: 1
454861.535119: [ffff88858f242100][2:eth1][pid:0,swapper/2][ip-in       ][ip_rcv_finish           ]: ICMP: 10.35.13.63 -> 9.135.224.89, ping request   , seq: 1
454861.535129: [ffff88858f242100][2:eth1][pid:0,swapper/2][ip-in       ][ip_local_deliver        ]: ICMP: 10.35.13.63 -> 9.135.224.89, ping request   , seq: 1
As we can see, the address of skb, network interface, current process and the tracer that the function belongs to are displayed.
2.2 optional
$ nettrace -h
usage: nettrace.py [-h] [-s SADDR] [-d DADDR] [--addr ADDR] [-p PROTO] [--dport DPORT] [--sport SPORT] [--port PORT] [--tcp-flags TCP_FLAGS] [-t TRACER] [-o OUTPUT] [--detail] [--stack] [--stack-tracer STACK_TRACER] [--force-stack] [--ret] [--timeline] [-c COUNT] [--skb-mode] [-v]

optional arguments:
  -h, --help            show this help message and exit
  -s SADDR, --saddr SADDR
                        ip source address
  -d DADDR, --daddr DADDR
                        ip dest address
  --addr ADDR           ip source or dest address
  -p PROTO, --proto PROTO
                        network protocol (L3 or L4) in lower case, such ip, tcp, udp, etc.
  --dport DPORT         TCP/UDP dest port
  --sport SPORT         TCP/UDP source port
  --port PORT           TCP/UDP source or dest port
  --tcp-flags TCP_FLAGS
                        TCP flags to filter, such as S(syn), A(ack), R(rst), etc
  -t TRACER, --tracer TRACER
                        The network module or kernel function to trace. Use "-t ?" to see available tracer
  -o OUTPUT, --output OUTPUT
                        print extern info. options include: pid, if, id, cpu and module. pid: process info; if: ifindex and ifname; id: memory address of skb; cpu: the cpu id that run on; module: the network module of the tracer belong to. multiple options should be splited by ","
  --detail              show all info for trace output, which means enable all options in "--output"
  --stack               print kernel function call stack
  --stack-tracer STACK_TRACER
                        print kernel call stack for special tracer.
  --force-stack         force print stack for "all" tracer
  --ret                 trace the return value
  --timeline            print skb on timeline
  -c COUNT, --count COUNT
                        skb count to trace (timeline should be enabled)
  --skb-mode            keep tracing skb once it is matched
  -v, --verbose         show more verbose info
--stack: print the function call stack for the kernel function or tracepoint that enabled.--stack-tracer: maybe you don't want to print stack for all kernel function that enable, you can specify the tracer (or kernel function) that you want to print stack.--force_stack: by default, you can't set-t alland--stacktogether for performance problem. With this option, you can do it.--tcp-flags: use tcp flags to filter tcp skb. S(syn), A(ack), R(rst) and P(push) are supported.--ret: once this enabled, both kprobe and kretprobe will be create for kernel function in the tracer that enabled, and the return value will be printed.
2.3 example
trace icmp package with source ip '192.168.1.8':
# nettrace -p icmp -s 192.168.1.8
trace tcp package with source ip '192.168.1.8' and syn+ack flags:
# nettrace -p tcp -s 192.168.1.8 --tcp-flags SA
trace icmp package with source ip '192.168.1.8' in ip and icmp layer:
# nettrace -p icmp -s 192.168.1.8 -t ip,icmp
trace icmp package with source ip '192.168.1.8' in timeline mode:
# nettrace -p icmp -s 192.168.1.8 --timeline
trace icmp package with source ip '192.168.1.8' in skb mode:
# nettrace -p icmp -s 192.168.1.8 --skb-mode
trace icmp package with source ip '192.168.1.8' and print detail information
# nettrace -p icmp -s 192.168.1.8 --detail
3. tracer
3.1 trace tree
kernel function and tracepoint are organized in a 'tracer' tree, and every node of the tree is a tracer. 'all' is the root of the 'tracer' tree. The tree can be displayed with the command: nettrace -t ?
$ nettrace -t ?
available tracer:
---------------------------------------------------

all: trace the whole kernel network stack
    link: link layer (L2) of the network stack
        link-in: link layer (L2) of packet in
            napi_gro_receive
            enqueue_to_backlog
            __netif_receive_skb_core
            do_xdp_generic
            xdp_do_generic_redirect
            generic_xdp_tx
            sch_handle_ingress
        link-out: link layer (L2) of packet out
            dev_queue_xmit
            dev_hard_start_xmit
        sched: TC(traffic control) module
            tcf_classify
            sch_handle_egress
            cls_bpf_classify
            tcf_bpf_act
......
This is the part of the tracer tree. 'link' just represent the link layer (L2) of the network stack, and 'link-in' represent receive package, 'link-out' represent send package. 'ip' represent ip layer, 'tcp' represent tcp layer, etc.
When trace skb, tracer can be specified by -t (or --tracer), and multiple are supported. By default, 'all' tracer is used. For example, nettrace -t napi_gro_receive,ip to trace the function napi_gro_receive (function is tracer too) and ip layer.
3.2. custom
Tracer tree is keep in tracer.json, so it is simple to extend your own tracer. Leaf node of the tree can be the kernel function or tracepoint that we want to trace, and they have the following fields:
- name: The name of kernel function or tracepoint.
- skb: For kprobe, this is the index of 'struct sk_buff' in the function params which begin from 0; For tracepoint, this is the name of 'struct sk_buff', which may be 'skbaddr'.
- type: the type of this item, which can be 'kprobe' by default, 'kretprobe' and 'tracepoint'.
- tp: this is for tracpoint, which shoud be the path of tracepint in format of 'skb:kfree_skb'.
- is_end: if this function/tracepoint is the end of the life of the skb. This is used to trace the life of skb.
- regex: the regex for kernel function name. Sometimes, the function name compiled can be different, such as 'do_xdp_generic' is compiled to 'do_xdp_generic.cold'. So we can use regex to match the compiled name with 'do_xdp_generic.*'.
If nettrace is used by rpm package or docker image, the 'tracer.json' is located in '/opt/nettrace/tracer.json'.
4. timeline mode
By default, kernel function are printed directly. It's not easy to distinguish single skb, especially multi skb are printed at the same time. To solve this problem, timeline mode is introduced. In this mode, every skb has a 'context', which is used to mange the life of the skb. The skb won't be printed until it 'dies', and it will be print singly:
$ nettrace -p icmp --addr 10.35.13.63 --detail --timeline
begin tracing......
<------------------- skb: ffff88858f243100 ---------------------->
456901.372837: [ffff8887b6260200][2:eth1][pid:0,swapper/3       ][link-in     ][napi_gro_receive        ]: ICMP: 10.35.13.63 -> 9.135.224.89, ping request   , seq: 1
456901.372863: [ffff8887b6260200][2:eth1][pid:0,swapper/3       ][link-in     ][enqueue_to_backlog      ]: ICMP: 10.35.13.63 -> 9.135.224.89, ping request   , seq: 1
456901.372883: [ffff8887b6260200][2:eth1][pid:897081,nettrace   ][link-in     ][__netif_receive_skb_core]: ICMP: 10.35.13.63 -> 9.135.224.89, ping request   , seq: 1
456901.372893: [ffff8887b6260200][2:eth1][pid:897081,nettrace   ][pkt-in      ][tpacket_rcv             ]: ICMP: 10.35.13.63 -> 9.135.224.89, ping request   , seq: 1
456901.372902: [ffff8887b6260200][2:eth1][pid:897081,nettrace   ][ip-in       ][ip_rcv                  ]: ICMP: 10.35.13.63 -> 9.135.224.89, ping request   , seq: 1
456901.372909: [ffff8887b6260200][2:eth1][pid:897081,nettrace   ][ip-in       ][ip_rcv_core             ]: ICMP: 10.35.13.63 -> 9.135.224.89, ping request   , seq: 1
456901.372921: [ffff8887b6260200][2:eth1][pid:897081,nettrace   ][life        ][skb_clone               ]: ICMP: 10.35.13.63 -> 9.135.224.89, ping request   , seq: 1
                return value:ffff88858f242900
456901.372930: [ffff88858f242900][2:eth1][pid:897081,nettrace   ][netfilter   ][nf_hook_slow            ]: ICMP: 10.35.13.63 -> 9.135.224.89, ping request   , seq: 1
456901.372952: [ffff88858f242900][2:eth1][pid:897081,nettrace   ][ip-in       ][ip_rcv_finish           ]: ICMP: 10.35.13.63 -> 9.135.224.89, ping request   , seq: 1
456901.372961: [ffff88858f242900][2:eth1][pid:897081,nettrace   ][ip-in       ][ip_local_deliver        ]: ICMP: 10.35.13.63 -> 9.135.224.89, ping request   , seq: 1
456901.372967: [ffff88858f242900][2:eth1][pid:897081,nettrace   ][netfilter   ][nf_hook_slow            ]: ICMP: 10.35.13.63 -> 9.135.224.89, ping request   , seq: 1
456901.372977: [ffff88858f242900][2:eth1][pid:897081,nettrace   ][ip-in       ][ip_local_deliver_finish ]: ICMP: 10.35.13.63 -> 9.135.224.89, ping request   , seq: 1
456901.373002: [ffff88858f242900][2:eth1][pid:897081,nettrace   ][icmp-in     ][icmp_rcv                ]: ICMP: 10.35.13.63 -> 9.135.224.89, ping request   , seq: 1
456901.373006: [ffff88858f242900][2:eth1][pid:897081,nettrace   ][icmp-in     ][icmp_echo               ]: ICMP: 10.35.13.63 -> 9.135.224.89, ping request   , seq: 1
456901.373064: [ffff88858f242900][2:eth1][pid:897081,nettrace   ][life        ][consume_skb             ]: ICMP: 10.35.13.63 -> 9.135.224.89, ping request   , seq: 1
456901.373068: [ffff8887b6260200][2:eth1][pid:897081,nettrace   ][pkt-in      ][packet_rcv              ]: ICMP: 10.35.13.63 -> 9.135.224.89, ping request   , seq: 1
456901.373072: [ffff8887b6260200][2:eth1][pid:897081,nettrace   ][life        ][consume_skb             ]: ICMP: 10.35.13.63 -> 9.135.224.89, ping request   , seq: 1

<------------------- skb: ffff88858f243a00 ---------------------->
461052.796174: [ffff88858f243a00][    ][pid:0,swapper/2         ][ip-out      ][ip_send_skb             ]: ICMP: 9.135.224.89 -> 10.35.13.63, ping reply     , seq: 1
461052.796179: [ffff88858f243a00][    ][pid:0,swapper/2         ][ip-out      ][__ip_local_out          ]: ICMP: 9.135.224.89 -> 10.35.13.63, ping reply     , seq: 1
461052.796182: [ffff88858f243a00][    ][pid:0,swapper/2         ][netfilter   ][nf_hook_slow            ]: ICMP: 9.135.224.89 -> 10.35.13.63, ping reply     , seq: 1
461052.796186: [ffff88858f243a00][    ][pid:0,swapper/2         ][ip-out      ][ip_output               ]: ICMP: 9.135.224.89 -> 10.35.13.63, ping reply     , seq: 1
461052.796189: [ffff88858f243a00][2:eth1][pid:0,swapper/2       ][netfilter   ][nf_hook_slow            ]: ICMP: 9.135.224.89 -> 10.35.13.63, ping reply     , seq: 1
461052.796194: [ffff88858f243a00][2:eth1][pid:0,swapper/2       ][ip-out      ][ip_finish_output        ]: ICMP: 9.135.224.89 -> 10.35.13.63, ping reply     , seq: 1
461052.796197: [ffff88858f243a00][2:eth1][pid:0,swapper/2       ][ip-out      ][ip_finish_output2       ]: ICMP: 9.135.224.89 -> 10.35.13.63, ping reply     , seq: 1
461052.796203: [ffff88858f243a00][2:eth1][pid:0,swapper/2       ][link-out    ][dev_queue_xmit          ]: ICMP: 9.135.224.89 -> 10.35.13.63, ping reply     , seq: 1
461052.796210: [ffff88858f243a00][2:eth1][pid:0,swapper/2       ][link-out    ][dev_hard_start_xmit     ]: ICMP: 9.135.224.89 -> 10.35.13.63, ping reply     , seq: 1
461052.796214: [ffff88858f243a00][2:eth1][pid:0,swapper/2       ][life        ][skb_clone               ]: ICMP: 9.135.224.89 -> 10.35.13.63, ping reply     , seq: 1
                return value:ffff88858f242900
461052.796219: [ffff88858f242900][2:eth1][pid:0,swapper/2       ][pkt-in      ][tpacket_rcv             ]: ICMP: 9.135.224.89 -> 10.35.13.63, ping reply     , seq: 1
461052.796224: [ffff88858f242900][2:eth1][pid:0,swapper/2       ][life        ][consume_skb             ]: ICMP: 9.135.224.89 -> 10.35.13.63, ping reply     , seq: 1
461052.796264: [ffff88858f243a00][2:eth1][pid:0,swapper/0       ][life        ][consume_skb             ]: ICMP: 9.135.224.89 -> 10.35.13.63, ping reply     , seq: 1
As we can see, printing for every skb are split clearly. What's more, the skb cloned from one skb is thought to be in the same context. Therefor, the skb with address ffff8887b6260200 is printed with ffff88858f242900 together.
5. skb mode
Traditional packet filter is supported, such protocol, ip source address, ip destination address, source port, destination port, etc. However, while the data of skb changing (for example, NAT), it can't work probably.
skb mode is used to solve this problem. While it is enabled with --skb-mode, nettrace will keep tracing the skb once it is matched, even if ip address or port changed. This mode is helpful when you want to trace the skb whose data will be change by iptables.
As we can see below, we want to trace icmp package with ip address 192.168.122.8. However, DNAT is done by iptables, and the ip source address of this skb changed to 9.135.224.89. With this mode enabled, we still can keep tracing it.
$ nettrace -p icmp --addr 192.168.122.8 --timeline --skb-mode
begin tracing......
<------------------- skb: ffff88818f02f900 ---------------------->
463697.331957: [__netif_receive_skb_core]: ICMP: 192.168.122.8 -> 10.123.119.98, ping request   , seq: 0
463697.331972: [nf_hook_slow            ]: ICMP: 192.168.122.8 -> 10.123.119.98, ping request   , seq: 0
463697.331985: [nf_hook_slow            ]: ICMP: 192.168.122.8 -> 10.123.119.98, ping request   , seq: 0
463697.331990: [__netif_receive_skb_core]: ICMP: 192.168.122.8 -> 10.123.119.98, ping request   , seq: 0
463697.331994: [ip_rcv                  ]: ICMP: 192.168.122.8 -> 10.123.119.98, ping request   , seq: 0
463697.331998: [ip_rcv_core             ]: ICMP: 192.168.122.8 -> 10.123.119.98, ping request   , seq: 0
463697.332001: [nf_hook_slow            ]: ICMP: 192.168.122.8 -> 10.123.119.98, ping request   , seq: 0
463697.332004: [ip_rcv_finish           ]: ICMP: 192.168.122.8 -> 10.123.119.98, ping request   , seq: 0
463697.332010: [ip_forward              ]: ICMP: 192.168.122.8 -> 10.123.119.98, ping request   , seq: 0
463697.332014: [nf_hook_slow            ]: ICMP: 192.168.122.8 -> 10.123.119.98, ping request   , seq: 0
463697.332024: [ip_output               ]: ICMP: 192.168.122.8 -> 10.123.119.98, ping request   , seq: 0
463697.332027: [nf_hook_slow            ]: ICMP: 192.168.122.8 -> 10.123.119.98, ping request   , seq: 0
463697.332037: [ip_finish_output        ]: ICMP: 9.135.224.89  -> 10.123.119.98, ping request   , seq: 0
463697.332039: [ip_finish_output2       ]: ICMP: 9.135.224.89  -> 10.123.119.98, ping request   , seq: 0
463697.332042: [dev_queue_xmit          ]: ICMP: 9.135.224.89  -> 10.123.119.98, ping request   , seq: 0
463697.332046: [dev_hard_start_xmit     ]: ICMP: 9.135.224.89  -> 10.123.119.98, ping request   , seq: 0
463697.332060: [consume_skb             ]: ICMP: 9.135.224.89  -> 10.123.119.98, ping request   , seq: 0
 7 Sep 26, 2022

 0 Jan 23, 2022
 1 Feb 9, 2022

 87 Dec 18, 2022

 10 Nov 7, 2022
 5 Sep 22, 2022

 69 Nov 3, 2022
 97 Dec 3, 2022

 549 Dec 31, 2022


 9 Sep 28, 2022
 1 Feb 09, 2022
 2.3k Dec 28, 2022
 269 Dec 20, 2022
 2 Jan 16, 2022
 1.7k Dec 31, 2022
 7 Mar 25, 2022
 0 Jan 05, 2023
 0 Jul 23, 2021
 3 May 20, 2022
 216 Dec 30, 2022
 12 Jan 16, 2022
 4 Apr 25, 2022
 195 Dec 21, 2022
 7 Aug 17, 2022
 3 Aug 05, 2022
 7 Sep 28, 2021
 3 May 31, 2021
 4 Jul 03, 2022
 0 Dec 24, 2022